Introduction
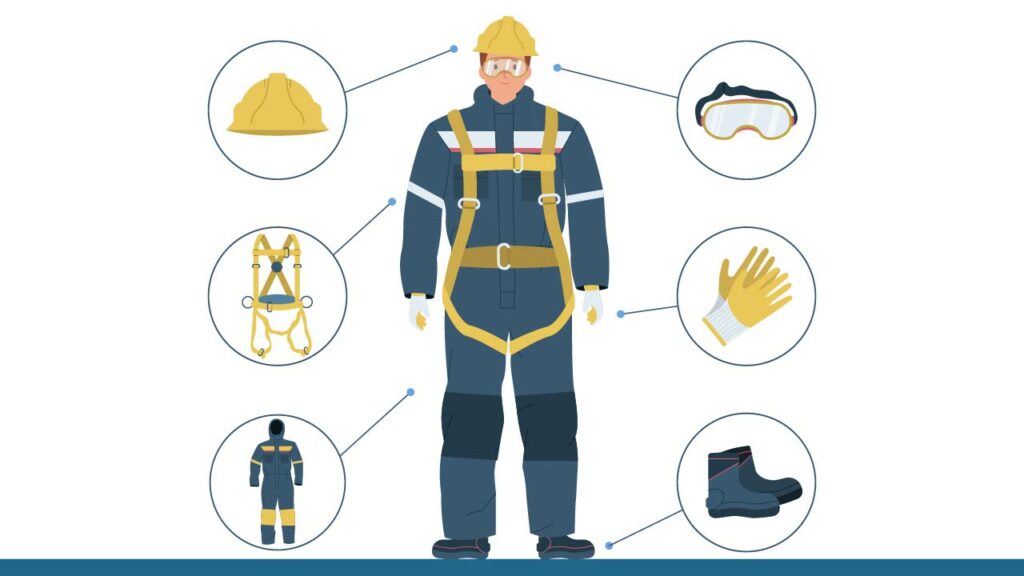
Personal Protective Equipment Statistics: (PPE) encompasses protective clothing, helmets, goggles, and other garments or devices intended to shield the wearer’s body from harm or infection. The risks mitigated by such protective gear include physical, electrical, thermal, chemical, biological hazards, and airborne particulates.
Statistics regarding personal protective equipment (PPE) are essential for comprehending workplace safety, indicating that inadequate use of PPE is closely associated with an increased likelihood of injuries and occupational diseases.
These statistics demonstrate the efficacy of appropriate PPE, the types that are most commonly utilized or required across different sectors, and the main reasons why employees do not use it, including lack of availability, discomfort, or inadequate training. Furthermore, they illustrate how the demand for various PPE items can fluctuate in response to situations such as a pandemic.
Editor’s Choice
- The worldwide revenue for Personal Protective Equipment (PPE) is anticipated to reach USD 147.1 billion by the year 2033.
- The worldwide Personal Protective Equipment (PPE) market has demonstrated steady growth from 2023 to 2033, with a compound annual growth rate (CAGR) of 5.9%.
- Hand protection consistently maintained the largest market share, beginning at 25% in 2016, experiencing minor fluctuations, and concluding at 24.08% by 2026.
- In 2022, Denmark led the world in personal protective equipment (PPE) imports per capita, amounting to USD 56.78.
- In the case of medical gowns, 60% are manufactured in China, whereas the remaining 40% are sourced from other parts of the globe.
General PPE Statistics
- The worldwide revenue for Personal Protective Equipment (PPE) is anticipated to reach USD 147.1 billion by the year 2033.
- Hand protection products have consistently maintained the largest market share in the United States, beginning at 25% in 2016, experiencing minor fluctuations, and arriving at 24.08% by 2026.
- In 2019, the global market for personal protective products was primarily dominated by several major exporters.
- China was at the forefront of the market, holding a significant 17.20% share of global exports.
- In January 2020, the monthly export value was recorded at USD 155.1 million, which saw a 17.9% increase by February, reaching USD 182.8 million.
- In 2022, Denmark was the leader in per capita imports of personal protective equipment (PPE), with a value of USD 56.78.
- In August 2021, the demand for personal protective equipment (PPE) among businesses indicated that hand sanitizer was the most in-demand product, with 90.1% of businesses indicating a requirement for it.
- In January 2022, nearly 1 in 10 (8.6%) businesses within the manufacturing, retail, and wholesale sectors were engaged in the production or distribution of personal protective equipment (PPE), reflecting a 3.2% point increase compared to August 2021.
Personal Protective Equipment Market Statistics
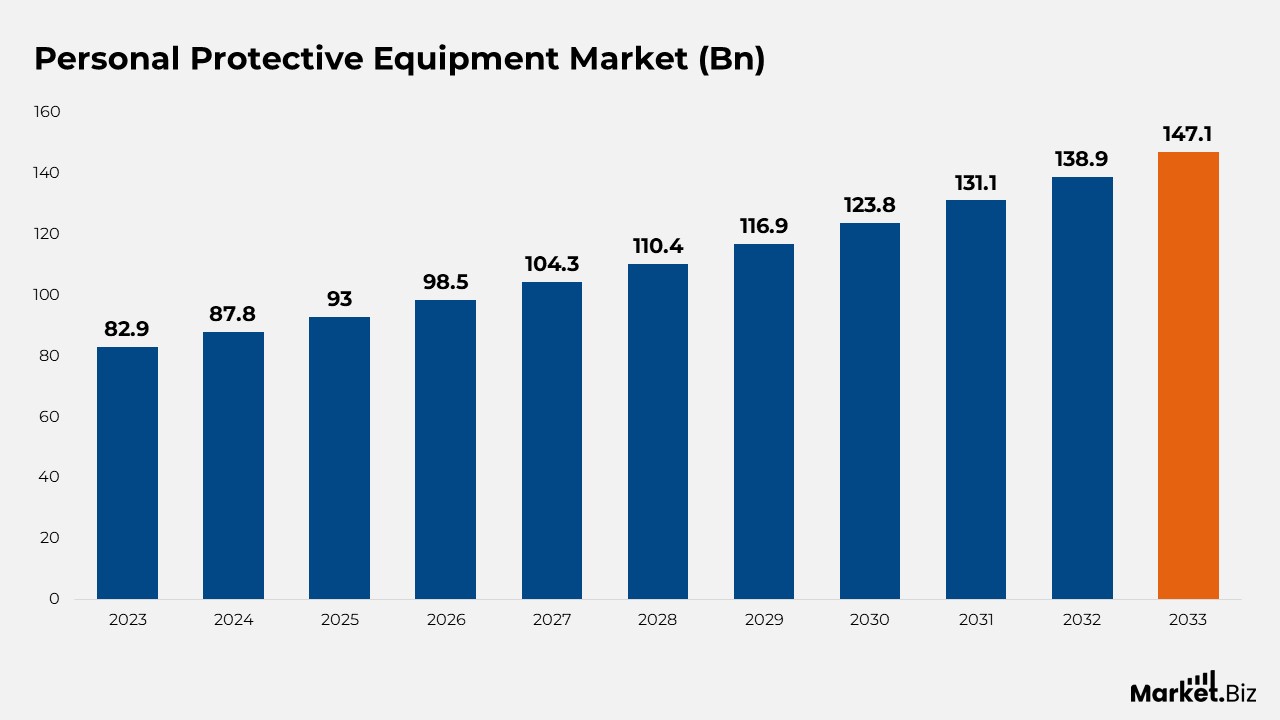
- The worldwide Personal Protective Equipment (PPE) market has demonstrated steady growth from 2023 to 2033, with a compound annual growth rate (CAGR) of 5.9%.
- In 2023, the market revenue was recorded at USD 82.9 billion, and it is anticipated to rise to USD 87.8 billion in 2024.
- This positive trend is expected to persist, with projections indicating that the market will reach USD 93.0 billion in 2025 and USD 98.5 billion in 2026.
- By 2027, the market is forecasted to expand to USD 104.3 billion, with further growth to USD 110.4 billion in 2028.
- The revenue is expected to increase to USD 116.9 billion in 2029, USD 123.8 billion in 2030, and USD 131.1 billion in 2031.
- The growth pattern continues, with projections suggesting that the market will achieve USD 138.9 billion in 2032 and reach USD 147.1 billion by 2033.
- This ongoing growth is indicative of the rising demand and investment in PPE on a global scale.
PPE Market Share by Product Category
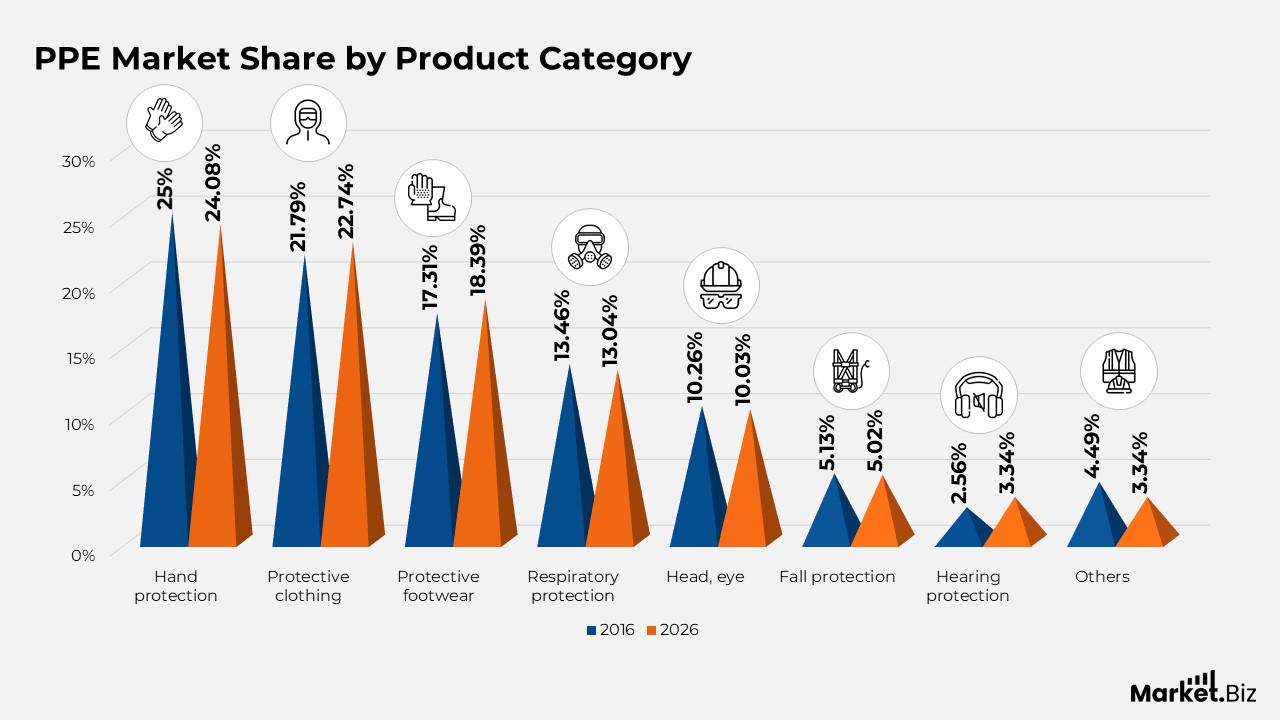
- Hand protection consistently maintained the largest market share, beginning at 25% in 2016, experiencing minor fluctuations, and concluding at 24.08% by 2026.
- Protective clothing closely followed, starting at 21.79% in 2016, reaching a peak of 23.65% in 2020, and stabilizing around 22.74% in 2026.
- Protective footwear held a notable share, commencing at 17.31% in 2016 and slightly increasing to 18.39% by 2026.
- Respiratory protection exhibited variations, starting at 13.46% in 2016, peaking at 13.86% in 2017, and arriving at 13.04% in 2026.
- The share of head, eye, and face protection experienced a slight decline from 10.26% in 2016 to 10.03% in 2026.
- Fall protection remained relatively stable, beginning at 5.13% in 2016, with minor fluctuations, and reaching 5.02% in 2026.
- Hearing protection displayed variability, starting at 2.56% in 2016, peaking at 3.37% in 2018, and concluding at 3.34% in 2026.
- The ‘Others’ category also demonstrated fluctuations, starting at 4.49% in 2016 and varying throughout the years to 3.34% in 2026.
Import Statistics of PPE
- In 2017, textiles dominated the import category with a value of USD 21.51 billion, followed by handwear at USD 16.72 billion, plastics in clothing at USD 8.05 billion, eyewear at USD 5.26 billion, surgical gloves at USD 2.83 billion, and breathing appliances at USD 3.75 billion.
- The subsequent year experienced growth in most categories, with textiles reaching USD 23.35 billion and handwear increasing to USD 18.65 billion.
- By 2019, textile imports had risen to USD 24.84 billion, while handwear saw a slight increase to USD 19.08 billion.
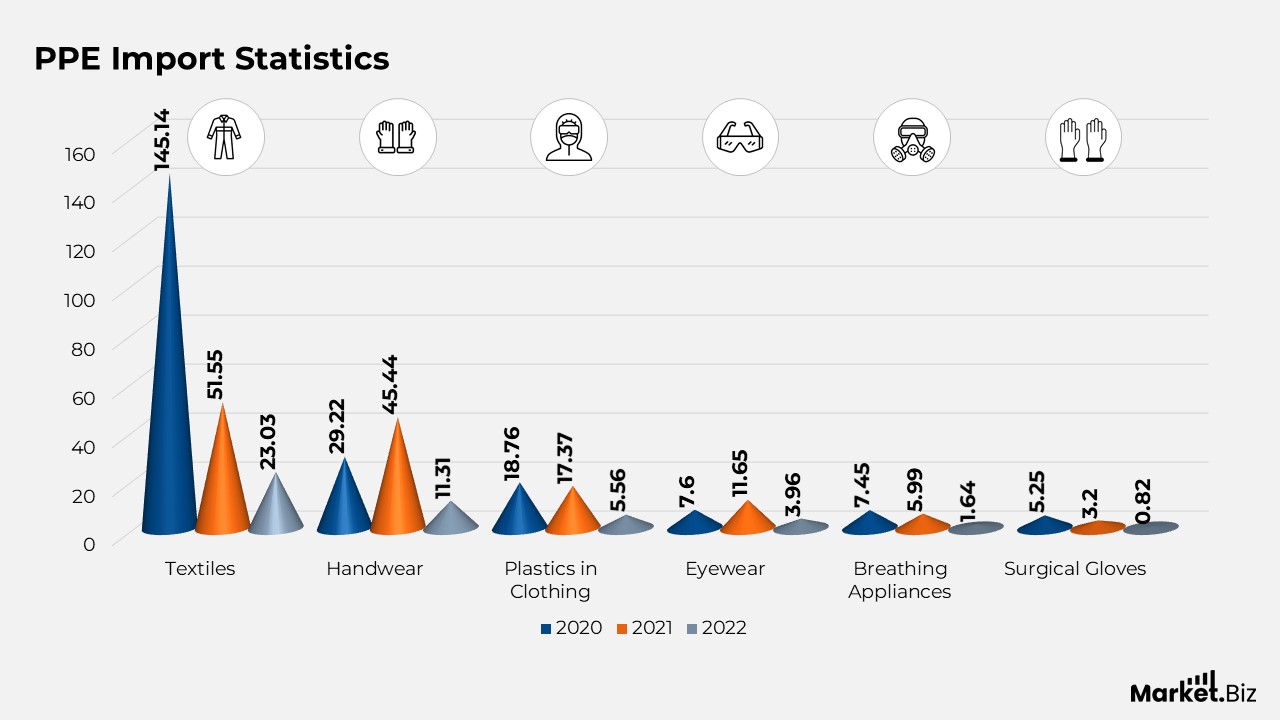
- The year 2020 witnessed a significant surge in PPE imports due to the COVID-19 pandemic, with textiles soaring to USD 145.14 billion, handwear to USD 29.22 billion, and plastics in clothing to USD 18.76 billion.
- Breathing and eyewear appliances also experienced notable increases, reaching USD 7.6 billion and USD 7.45 billion, respectively, while surgical gloves rose to USD 5.25 billion.
- In 2021, import values adjusted, with textiles decreasing to USD 51.55 billion and handwear sharply increasing to USD 45.44 billion.
- The value of plastics in clothing remained relatively unchanged at USD 17.37 billion, whereas imports of eyewear rose to USD 11.65 billion.
- Breathing appliances experienced a minor decline to USD 5.99 billion, while the market for surgical gloves held steady at USD 3.2 billion.
- By the year 2022, import values approached levels seen before the pandemic, with textiles valued at USD 23.03 billion, handwear at USD 11.31 billion, and plastics in clothing at USD 5.56 billion.
- Eyewear imports amounted to USD 3.96 billion, breathing appliances were recorded at USD 1.64 billion, and surgical gloves decreased to USD 0.82 billion.
PPE Import by Country Statistics
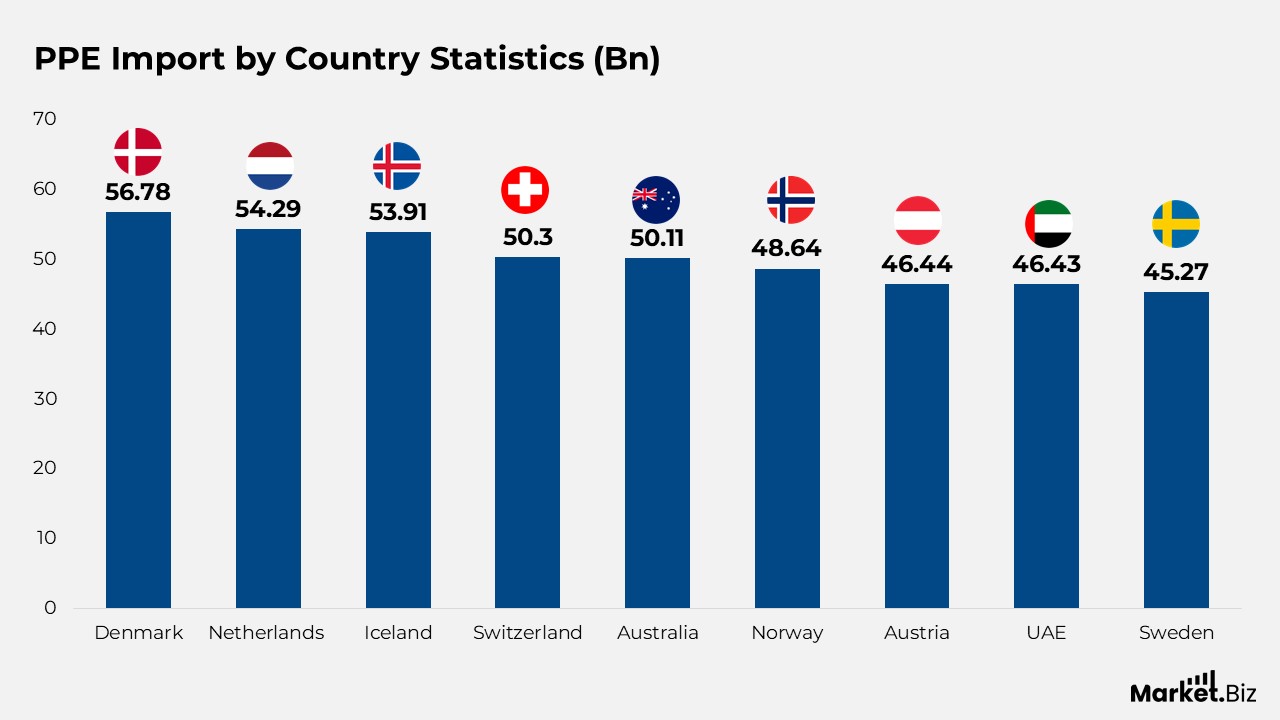
- In 2022, Denmark led the world in personal protective equipment (PPE) imports per capita, amounting to USD 56.78.
- The Netherlands followed closely behind with per capita imports reaching USD 54.29.
- Iceland and Switzerland also exhibited notable per capita imports, recorded at USD 53.91 and USD 50.30, respectively.
- Australia’s per capita PPE imports totaled USD 50.11, whereas Norway’s imports were reported at USD 48.64 per capita.
- Austria ranks with imports of USD 46.44, closely followed by the UAE at USD 46.43.
- Sweden also had a notable presence, with PPE imports per capita getting USD 45.27.
PPE Export Statistics
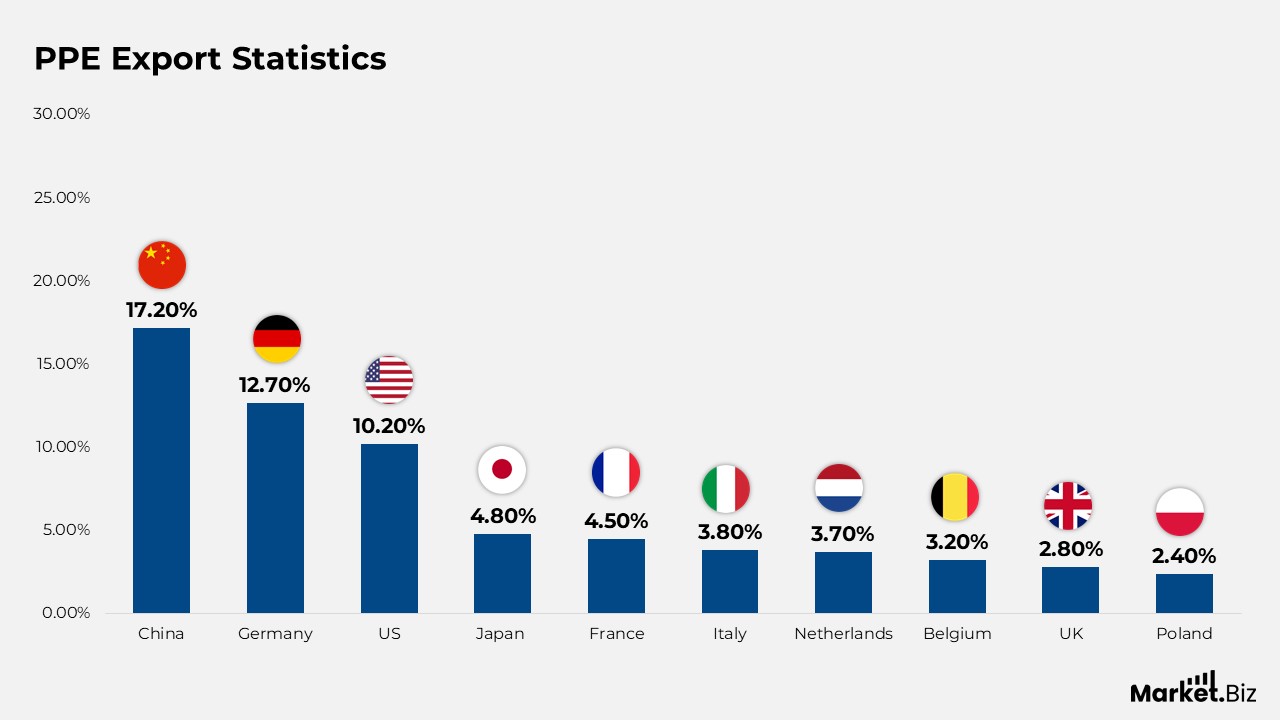
- In 2019, the global market for personal protective products was primarily influenced by several major exporters. China was at the forefront, commanding a significant 17.20% of the total world exports.
- Germany was next, representing 12.70% of the exports, while the United States maintained a 10.20% share.
- Japan and France contributed 4.80% and 4.50%, respectively.
- Italy was responsible for 3.80% of the global protective products exports, closely trailed by the Netherlands with 3.70%.
- Belgium possessed a 3.20% share, while the United Kingdom and Poland accounted for 2.80% and 2.40%, respectively.
Production Distribution Statistics
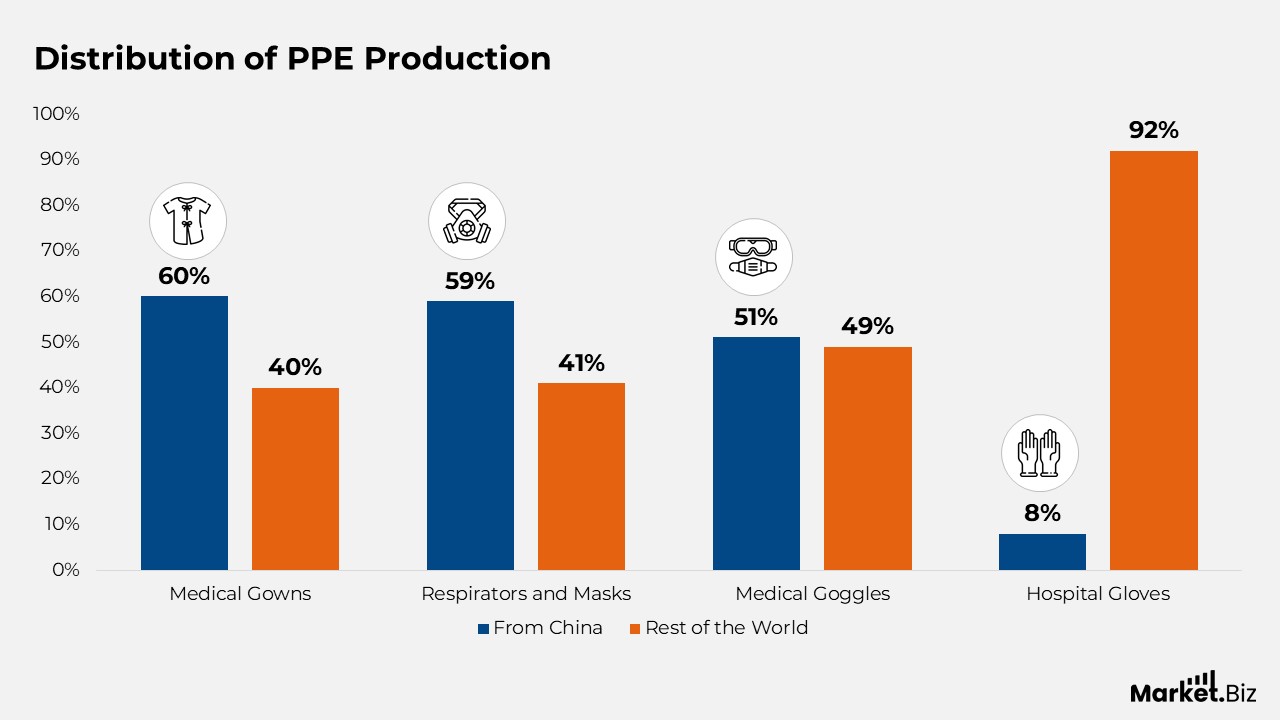
- In the case of medical gowns, 60% are manufactured in China, whereas the remaining 40% are sourced from other parts of the globe.
- Similarly, 59% of respirators and masks are produced in China, while 41% are made in other locations.
- Medical goggles exhibit a minor variation, with 51% being produced in China and 49% from different areas.
- Conversely, hospital gloves are primarily manufactured outside of China, with a mere 8% coming from China and a significant 92% from the rest of the world.
PPE Demand Statistics
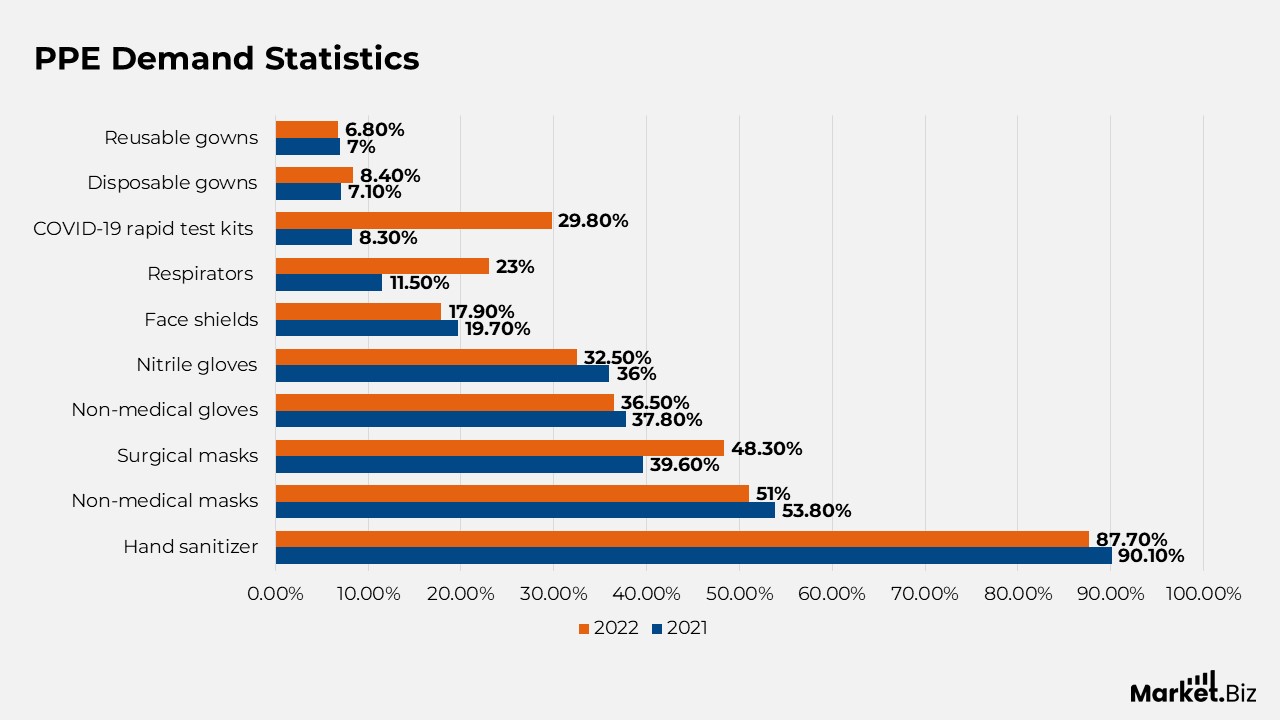
- In August 2021, businesses exhibited a significant demand for personal protective equipment (PPE), with hand sanitizer emerging as the most requested item, required by 90.1% of businesses.
- Non-medical masks were the second most sought-after, with 53.8% of businesses needing them, while surgical masks were requested by 39.6% of businesses.
- Additionally, non-medical gloves and nitrile gloves were in demand at rates of 37.8% and 36.0%, respectively.
- Face shields were necessary for 19.7% of businesses, and respirators were required by 11.5%.
- The demand for COVID-19 rapid test kits was lower at 8.3%, alongside disposable gowns at 7.1% and reusable gowns at 7.0%.
- By January 2022, the demand for hand sanitizer had slightly decreased to 87.7%. Non-medical masks and non-medical gloves also experienced a minor decline, with 51.0% and 36.5%, respectively.
- Conversely, the demand for surgical masks rose to 48.3%, and respirators saw a notable increase to 23.0%. The demand for COVID-19 rapid test kits surged to 29.8%.
- Meanwhile, nitrile gloves, face shields, disposable gowns, and reusable gowns experienced slight decreases in demand, recorded at 32.5%, 17.9%, 8.4%, and 6.8%, respectively.
Shortage Statistics of PPE
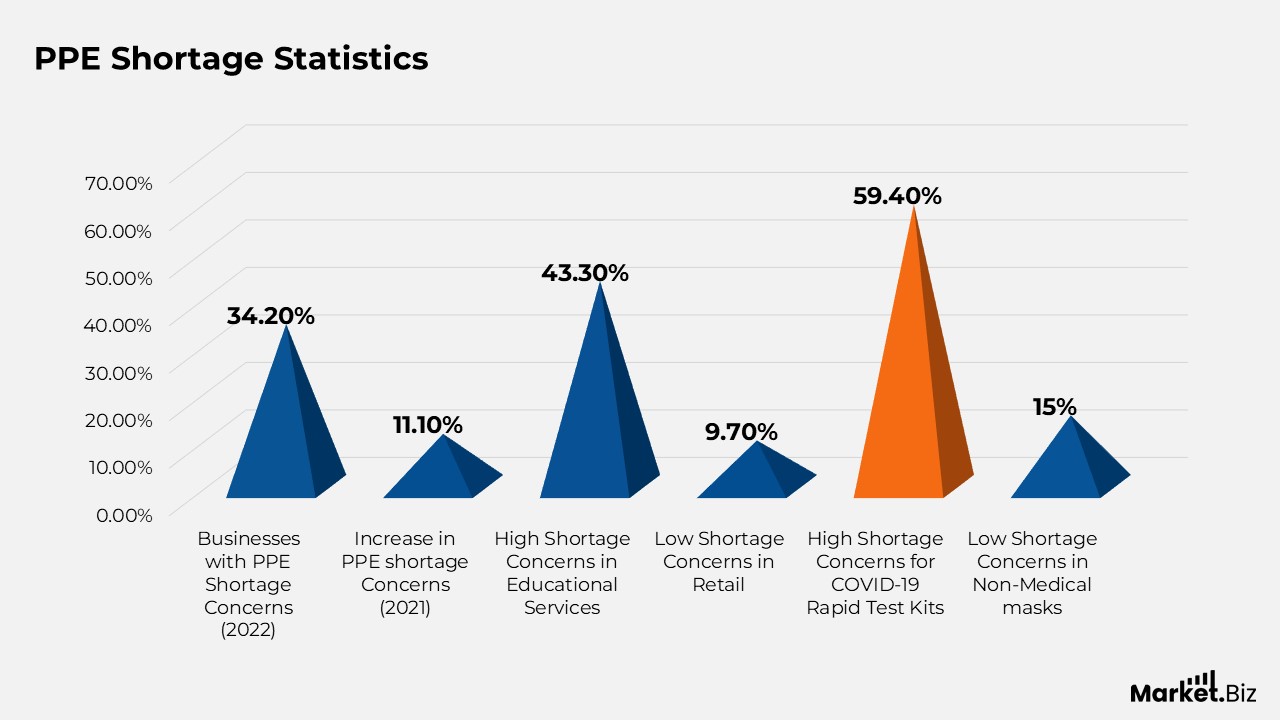
- In January 2022, more than one-third (34.2%) of businesses that needed at least one form of personal protective equipment (PPE) to comply with public health regulations voiced worries regarding PPE shortages anticipated within the following three months, representing an increase of 11.1% points from August 2021.
- Businesses within the educational services sector exhibited the highest level of concern, with 43.3% indicating worries about shortages of at least one type of necessary PPE, while the retail sector showed the least concern at 9.7%.
- The most significant anticipated shortages were for COVID-19 rapid test kits, with 59.4% of businesses expressing apprehensions, whereas non-medical masks had the lowest reported concerns regarding shortages at 15%.
PPE During COVID-19
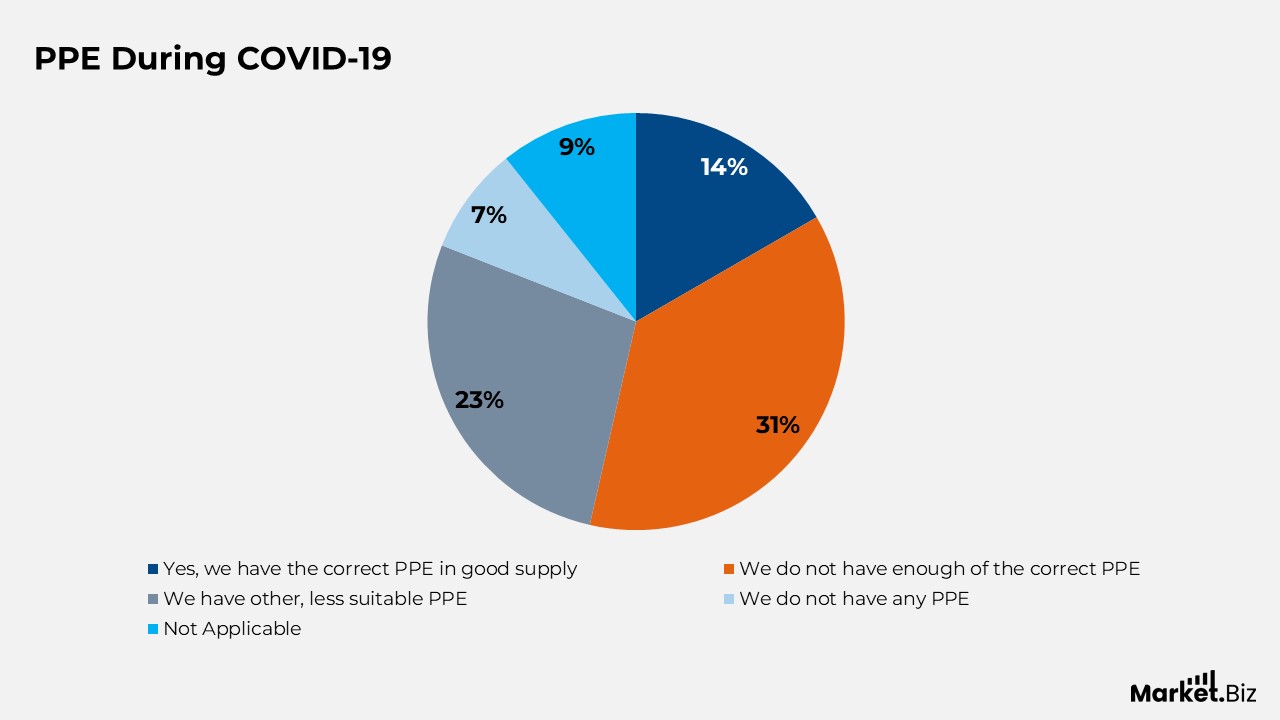
- A survey indicated that merely 14% of participants affirmed possessing the appropriate personal protective equipment (PPE) in adequate supply at their places of employment.
- Meanwhile, 31% noted that they had the correct PPE, albeit not in sufficient amounts.
- Furthermore, 23% reported having alternative, less appropriate PPE rather than the necessary types.
- Alarmingly, 7% of participants expressed that they lacked any PPE altogether.
- Additionally, 9% of respondents indicated that the question was not relevant to their circumstances.
Personal Protective Equipment: Recent Development
- In January 2022, MSA Safety purchased Bristol Uniforms, a UK-based company, for $60 million.
- In April 2022, Honeywell took over Norcross Safety Products for $1.2 billion.
- Ansell inaugurated a new manufacturing facility in India with an investment of $80 million aimed at producing high-quality surgical gloves.
- In 2022, Honeywell introduced two new NIOSH-certified respiratory protection products to cater to the requirements of healthcare workers, thereby broadening its PPE offerings in the healthcare industry.
Personal Protective Equipment Future Prediction Statistics
- The worldwide PPE market is anticipated to exceed $80 billion by the year 2026, with certain reports estimating it could surpass $85 billion, propelled by a robust compound annual growth rate (CAGR).
- The market for “smart” PPE, which incorporates technology, is projected to experience substantial growth, with an estimated value of $33.07 billion by 2026.
Conclusion
In summary, the worldwide personal protective equipment (PPE) market plays a crucial role in safeguarding the well-being of employees in diverse sectors, such as healthcare, manufacturing, and construction. Grasping PPE statistics is essential for formulating effective safety initiatives.
It offers measurable proof of the significance of PPE and aids in crafting focused interventions, including enhancing training, guaranteeing availability, and enforcing stricter oversight to minimize workplace incidents and shield workers from dangers.
FAQs
Including gloves, shoe covers, gowns, head covers, respirators, masks, face shields, eye protection, and goggles. Gloves are essential for safeguarding oneself when directly interacting with potentially infectious materials or contaminated surfaces. Gowns serve to protect clothing from being contaminated with potentially infectious substances.
The global personal protective equipment (PPE) market was valued at USD 82.45 billion in 2024. It is anticipated that the market will expand from USD 85.97 billion in 2025 to USD 118.07 billion by 2032, reflecting a compound annual growth rate (CAGR) of 4.6% throughout the forecast period.
3M Company is recognized as the largest global manufacturer of PPE, renowned for its extensive range of high-quality products, including N95 respirators, protective eyewear, hearing protection, and various other industrial safety solutions.