Introduction
Reusable Water Bottles Statistics: The market for reusable water bottles is currently witnessing significant growth, propelled by rising environmental awareness and health trends, with the global market value anticipated to surpass $10 billion by the year 2025.
Data indicates that this is a substantial market, exhibiting a Compound Annual Growth Rate (CAGR) of approximately 4.5% to 5%, which signifies a worldwide transition from single-use plastics to more sustainable and long-lasting options.
Reusable water bottles present an eco-friendly alternative to single-use plastics. They are available in various materials, including plastic, stainless steel, glass, and aluminium. These bottles are engineered for durability, often equipped with leak-proof caps, and are commonly free from BPA.
Stainless steel bottles excel in insulation for maintaining temperature, while glass bottles guarantee taste purity. Even though glass is more delicate and heavier, and aluminium necessitates a protective coating, each material possesses its own advantages.
Editor’s Choice
- The revenue generated by the global reusable water bottles market reached USD 9.7 billion in 2023.
- The market is projected to continue expanding, reaching USD 10.7 billion in 2025 and USD 11.3 billion in 2026.
- In 2020, China led the world in bottled water consumption, utilizing 27.8 billion gallons, thereby establishing itself as the largest market by volume.
- The United States recorded a per-capita consumption of 194.22 liters, with Germany closely following at 179.89 liters.
- In 2022, the market achieved a total revenue of USD 9.3 billion, with USD 5.8 billion coming from offline sales and USD 3.5 billion from online sales.
- The total recycling rate for all HDPE bottles declined from 30.9% in 2019 to 28.8% in 2020.
General Reusable Water Bottles Statistics
- In 2020, China was at the forefront of global bottled water consumption, utilising 27.8 billion gallons, thus establishing itself as the largest market by volume.
- The revenue generated by the global reusable water bottles market reached USD 9.7 billion in 2023.
- By the year 2032, it is anticipated that the market will attain a revenue of USD 14.6 billion, with USD 9.1 billion derived from offline channels and USD 5.5 billion from online channels. This indicates a strong and continuous growth across both distribution channels throughout the forecast period.
- The market for reusable water bottles is primarily propelled by insulated bottles, which command a substantial market share of 62%.
- As of 2018, Norway was the leader in PET plastic bottle recycling, boasting an impressive recycling rate of 97%.
- In the previous year, 69% of Gen Z consumers opted to purchase a reusable water bottle cause of its environmental sustainability, a rate significantly higher than that of other age demographics.
- In the European Union, the 2021 Single-Use Plastics Directive has played a crucial role, requiring member states to encourage the use of reusable alternatives.
Reusable Water Bottles Market Statistics
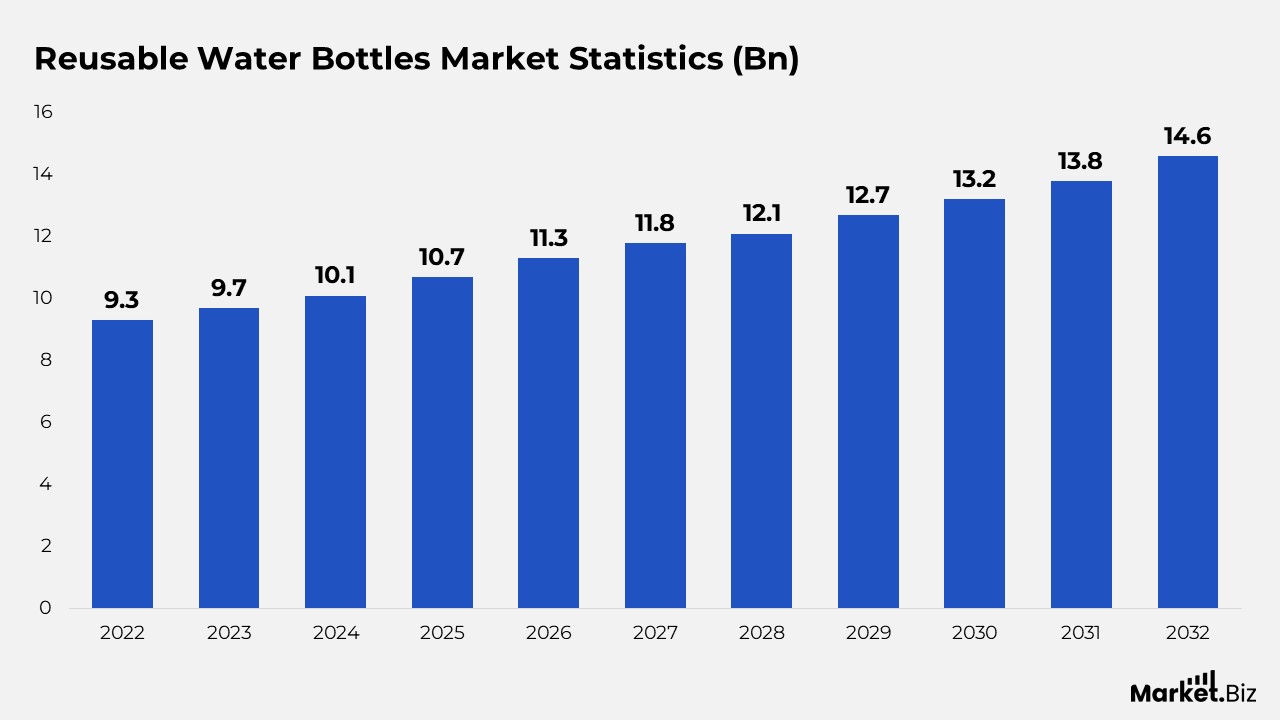
- The global market for reusable water bottles has shown a steady increase in revenue, achieving a compound annual growth rate (CAGR) of 4.7%, starting from USD 9.3 billion in 2022.
- This amount rose to USD 9.7 billion in 2023, with forecasts suggesting ongoing growth to USD 10.1 billion by 2024.
- The market is projected to continue expanding, reaching USD 10.7 billion in 2025 and USD 11.3 billion in 2026.
- By 2027, revenue is expected to rise to USD 11.8 billion, followed by further growth to USD 12.1 billion in 2028.
- The upward trend is anticipated to continue, with market revenues predicted to increase to USD 12.7 billion in 2029, USD 13.2 billion in 2030, and USD 13.8 billion in 2031.
- By 2032, the market is forecasted to reach a revenue of USD 14.6 billion, indicating sustained growth throughout the decade.
Consumption of Bottled Water by Country
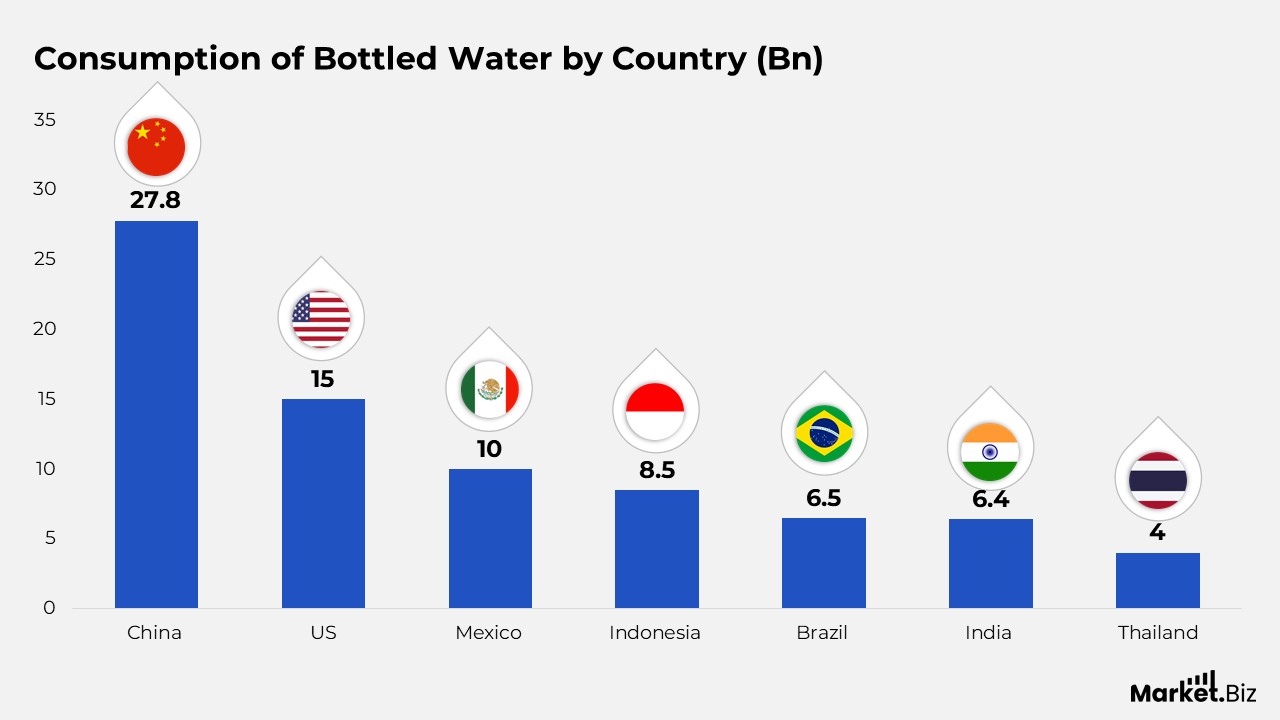
- In 2020, China led the world in bottled water consumption, utilizing 27.8 billion gallons, thereby establishing itself as the largest market by volume.
- The United States followed as the second-largest consumer, with a total of 15 billion gallons.
- Mexico claimed the third spot, with a consumption of 10 billion gallons.
- Indonesia and Brazil also represented significant markets, with consumption figures of 8.5 billion and 6.5 billion gallons, respectively.
- After Brazil, India closely followed, consuming 6.4 billion gallons.
- Other countries involved Thailand, which consumed 4 billion gallons; Italy, with a consumption of 3.5 billion gallons.
- Germany, at 2.8 billion gallons.
- France, which consumed 2.2 billion gallons.
Bottled Water Sales by Country
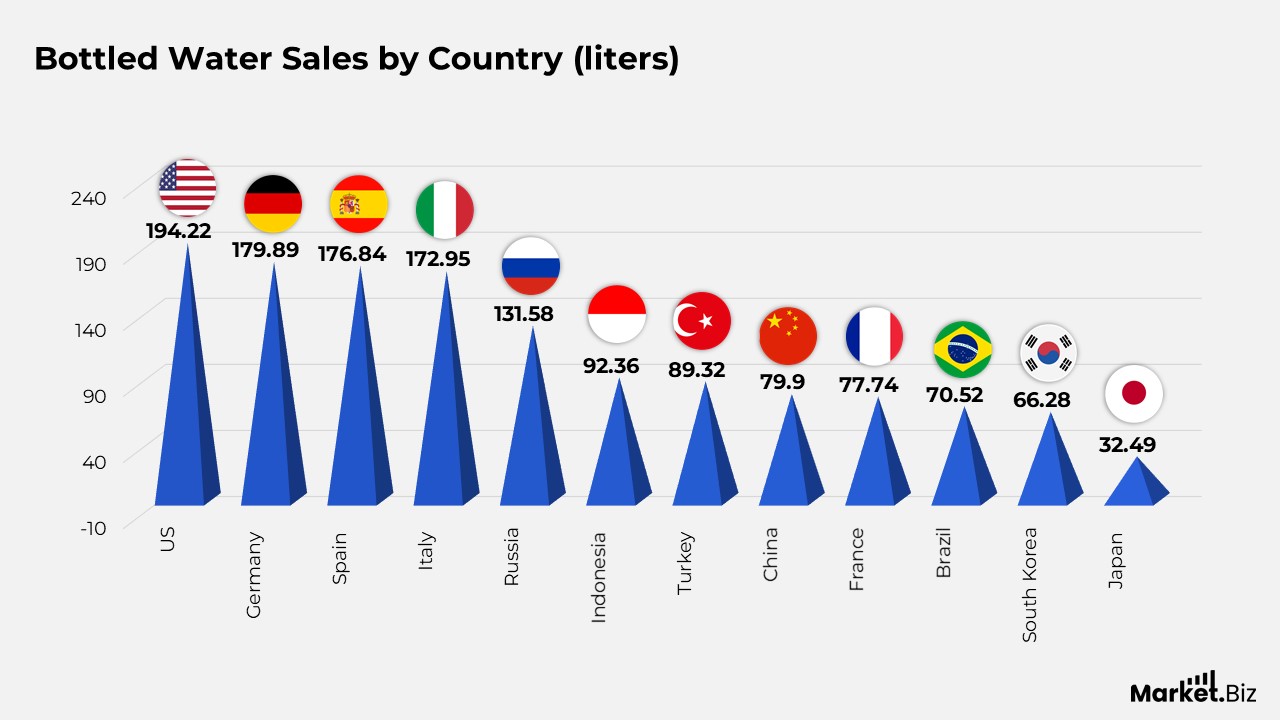
- The United States recorded a per-capita consumption of 194.22 liters, with Germany closely following at 179.89 liters.
- Spain and Italy also exhibited significant per-capita consumption rates, measuring 176.84 liters and 172.95 liters, respectively.
- Russia’s per-capita volume stood at 131.58 liters, while Indonesia and Turkey reported 92.36 liters and 89.32 liters per person, respectively.
- In China, the per-capita consumption was 79.9 liters, which is slightly above France’s 77.74 liters.
- Brazil, South Korea, and Japan demonstrated lower consumption rates at 70.52 liters, 66.28 liters, and 32.49 liters, respectively.
- Conversely, Nigeria and India had the lowest per-capita consumption figures among the countries listed, with 27.72 liters and 17.19 liters, respectively.
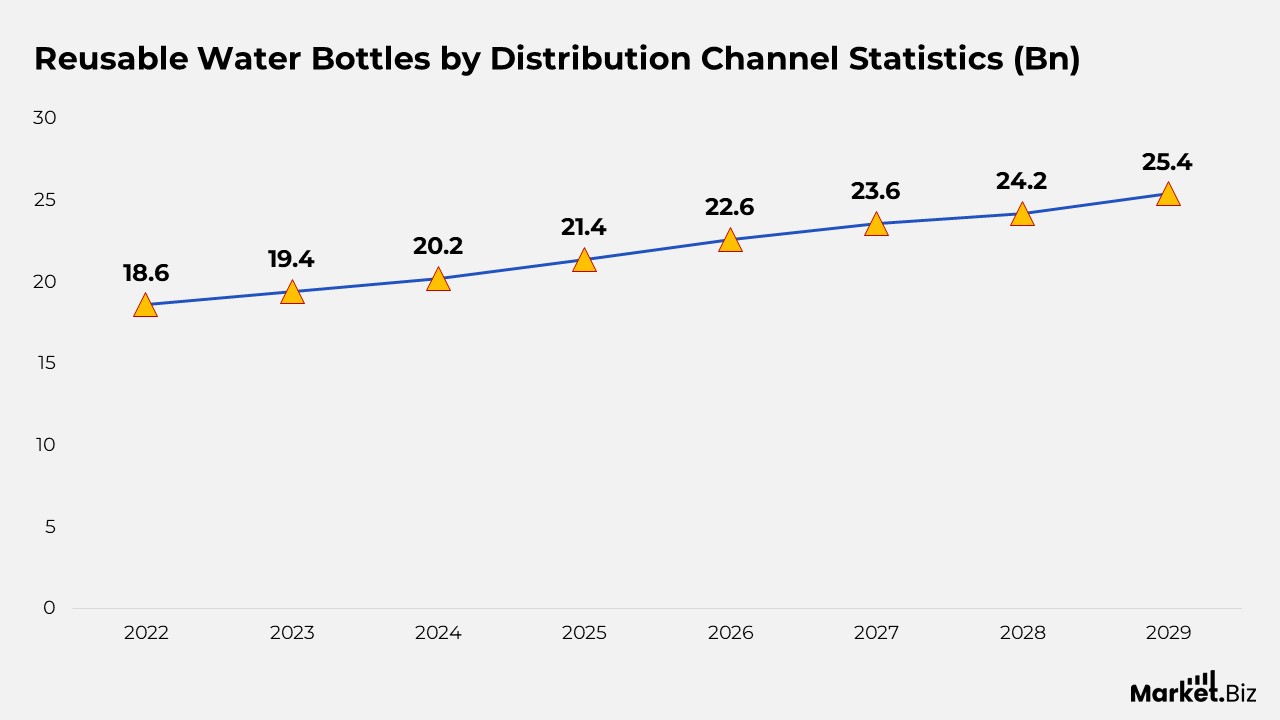
Reusable Water Bottles by Distribution Channel Statistics
- In 2022, the market achieved a total revenue of USD 9.3 billion, with USD 5.8 billion coming from offline sales and USD 3.5 billion from online sales.
- By 2023, revenues increased to USD 9.7 billion, with offline channels accounting for USD 6.0 billion and online channels for USD 3.7 billion.
- This upward trend is anticipated to persist, with total market revenue projected to reach USD 10.1 billion in 2024 (USD 6.3 billion offline, USD 3.8 billion online) and USD 10.7 billion in 2025 (USD 6.6 billion offline, USD 4.1 billion online).
- The market is projected to reach USD 11.3 billion by 2026, with offline sales amounting to USD 7.0 billion and online sales totaling USD 4.3 billion.
- By 2027, total market revenue is forecasted to rise to USD 11.8 billion (USD 7.3 billion offline, USD 4.5 billion online), and by 2028, to USD 12.1 billion (USD 7.5 billion offline, USD 4.6 billion online).
- The market is projected to reach USD 12.7 billion in 2029 (USD 7.9 billion offline, USD 4.8 billion online) and USD 13.2 billion in 2030 (USD 8.2 billion offline, USD 5.0 billion online).
- By the year 2031, it is anticipated that the overall market revenue will increase to USD 13.8 billion, comprising USD 8.6 billion from offline sources and USD 5.2 billion from online channels.
- Ultimately, it is projected that by 2032, the market will reach a revenue of USD 14.6 billion, comprising USD 9.1 billion from offline channels and USD 5.5 billion from online channels.
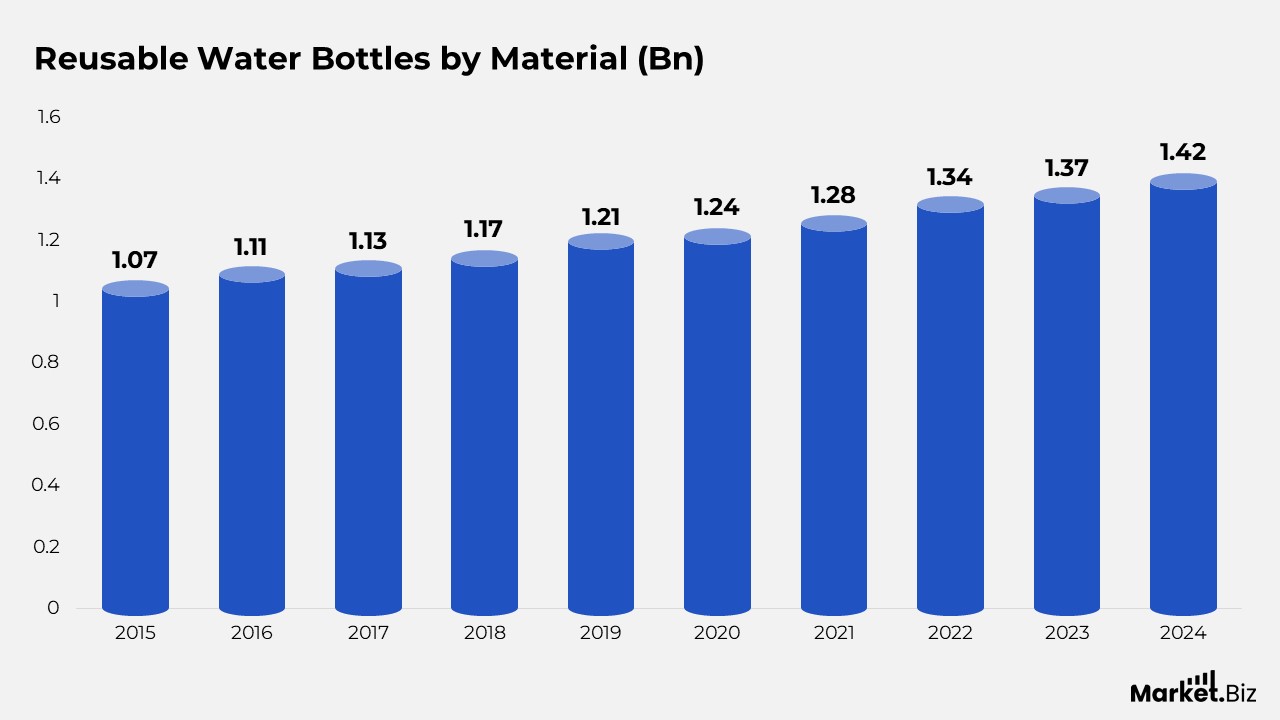
Reusable Water Bottles by Material
- In 2015, the valuation of the market for plastic water bottles was USD 0.4 billion, while metal bottles were valued at USD 0.3 billion, glass bottles at USD 0.26 billion, and silicone bottles at USD 0.11 billion.
- By 2020, the market for plastic bottles expanded to USD 0.46 billion, whereas metal and glass bottles each attained a value of USD 0.34 billion, and silicone bottles held steady at USD 0.12 billion.
- The favourable trend continued through 2021 and 2022, as plastic bottles attained USD 0.47 billion, metal bottles grew to USD 0.38 billion by 2022, and glass bottles reached USD 0.34 billion in 2021, which saw a slight increase to USD 0.35 billion in 2023.
- Silicone bottles experienced a modest rise to USD 0.15 billion by 2022.
- Forecasts for 2025 indicate that plastic bottles will maintain their market leadership, with an anticipated value of USD 0.53 billion.
- While glass bottles are expected to grow to USD 0.38 billion.
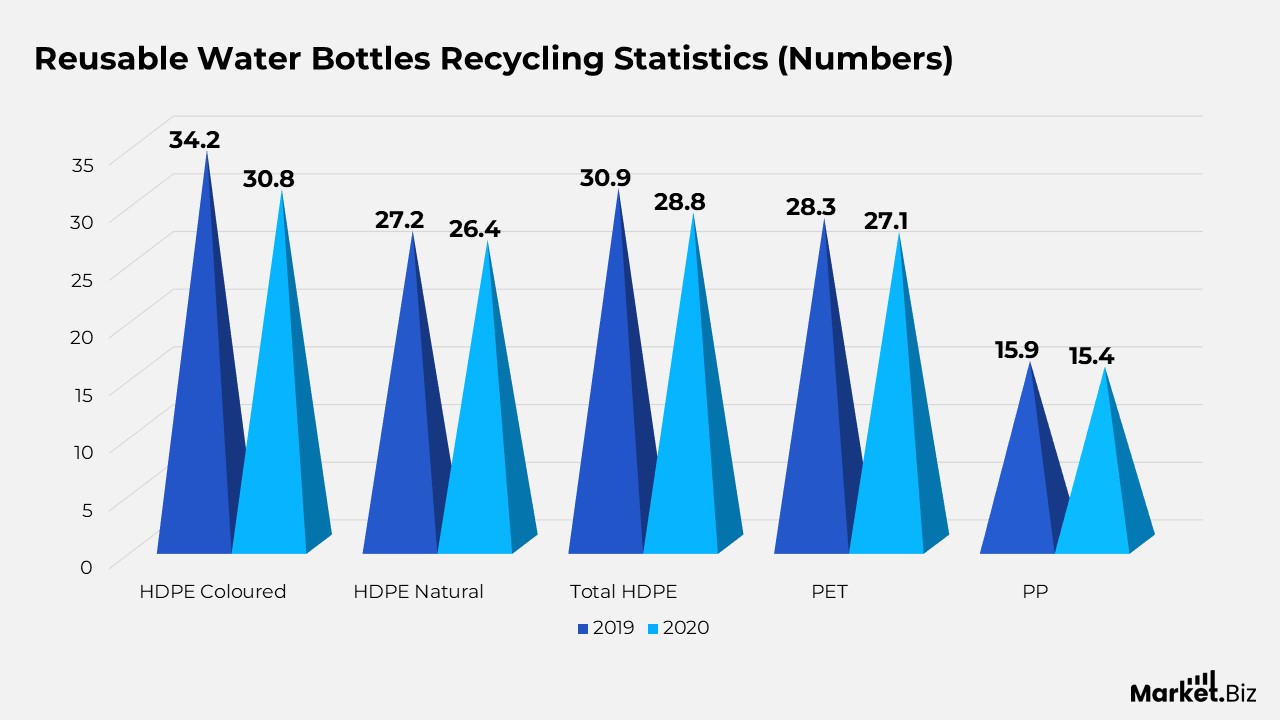
Recycling Statistics for Reusable Water Bottles
- In 2019, the recycling rate for colored High-Density Polyethylene bottles was recorded at 34.2%, which subsequently fell to 30.8% in 2020.
- Similarly, the recycling rate for natural HDPE bottles decreased from 27.2% in 2019 to 26.4% in 2020.
- The total recycling rate for all HDPE bottles declined from 30.9% in 2019 to 28.8% in 2020.
- Polyethylene Terephthalate bottles also saw a drop in recycling rates, decreasing from 28.3% in 2019 to 27.1% in 2020.
- Furthermore, the recycling rate for Polypropylene (PP) bottles experienced a slight reduction from 15.9% in 2019 to 15.4% in 2020.
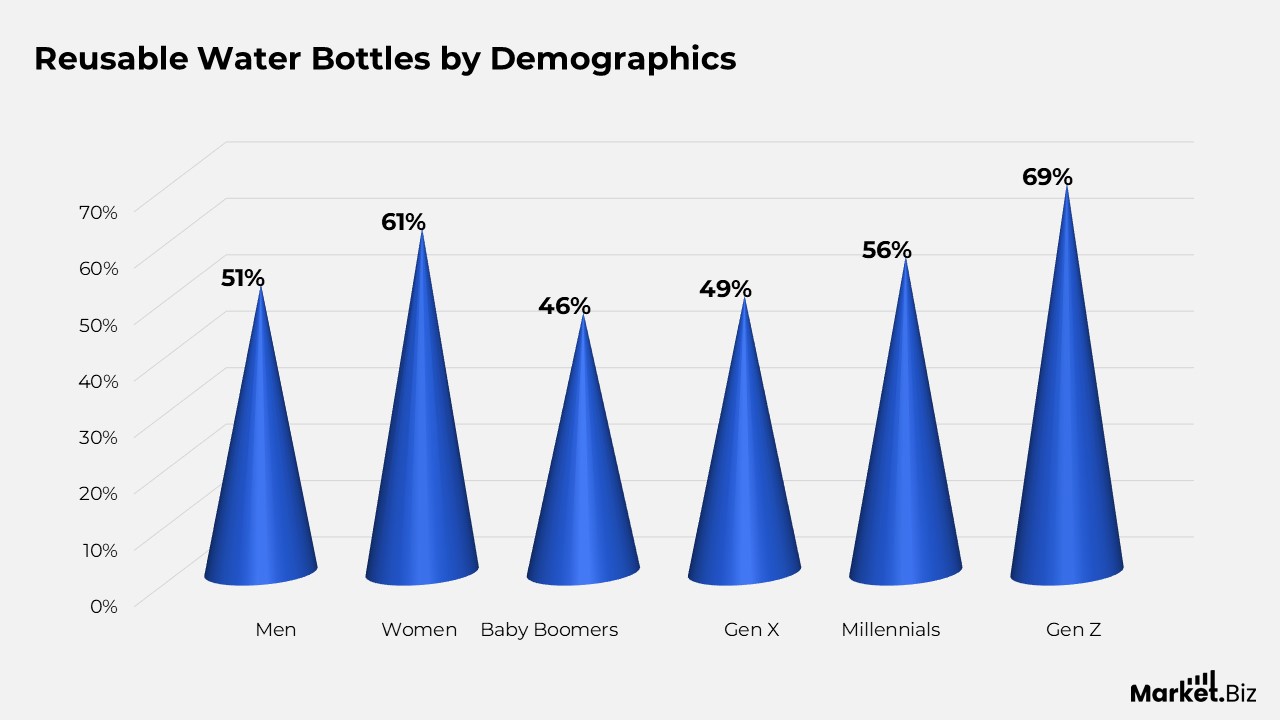
Reusable Water Bottles by Demographics
- Over the past year, 69% of Generation Z individuals opted to buy a reusable water bottle due to its environmental sustainability, which is a notably higher percentage than that of other age demographics.
- Millennials followed with a rate of 56%, Gen X at 49%, and Baby Boomers at 46%. Although Generation Z shows a greater tendency to purchase reusable water bottles, they also demonstrate a significant reliance on and consumption of bottled water, which poses a threat to the environment.
- This pattern corresponds with studies suggesting that Generation Z is especially driven to embrace more sustainable lifestyles.
- In terms of gender, 61% of women acquired a reusable water bottle for environmental reasons in the last year, while 51% of men did the same.
- From a regional standpoint, no particular area displayed an exceptionally high or low rate of purchasing reusable water bottles for environmental reasons. The West recorded the highest percentage at 57%, followed closely by the Midwest at 56%, the Northeast at 55%, and the South at 53%.
Moreover
- This indicates that geographical location has a minimal influence on the choice to buy reusable water bottles for environmental purposes when compared to other demographic factors.
- Geography also had a negligible impact on purchasing habits across different regions. Residents in suburban areas were the most inclined to purchase a reusable water bottle for environmental reasons at 57%, followed by urban dwellers at 56% and rural inhabitants at 51%.
- Income level showed a positive relationship with the likelihood of buying a reusable water bottle for environmental sustainability.
- Among those with higher incomes, 59% made such a purchase, in contrast to 57% of middle-income individuals and 51% of those with lower incomes.
- Finally, the probability of purchasing a reusable water bottle for environmental reasons was comparable between parents and non-parents, with both demographics at 55%.
Reusable Water Bottles by Consumer Preferences
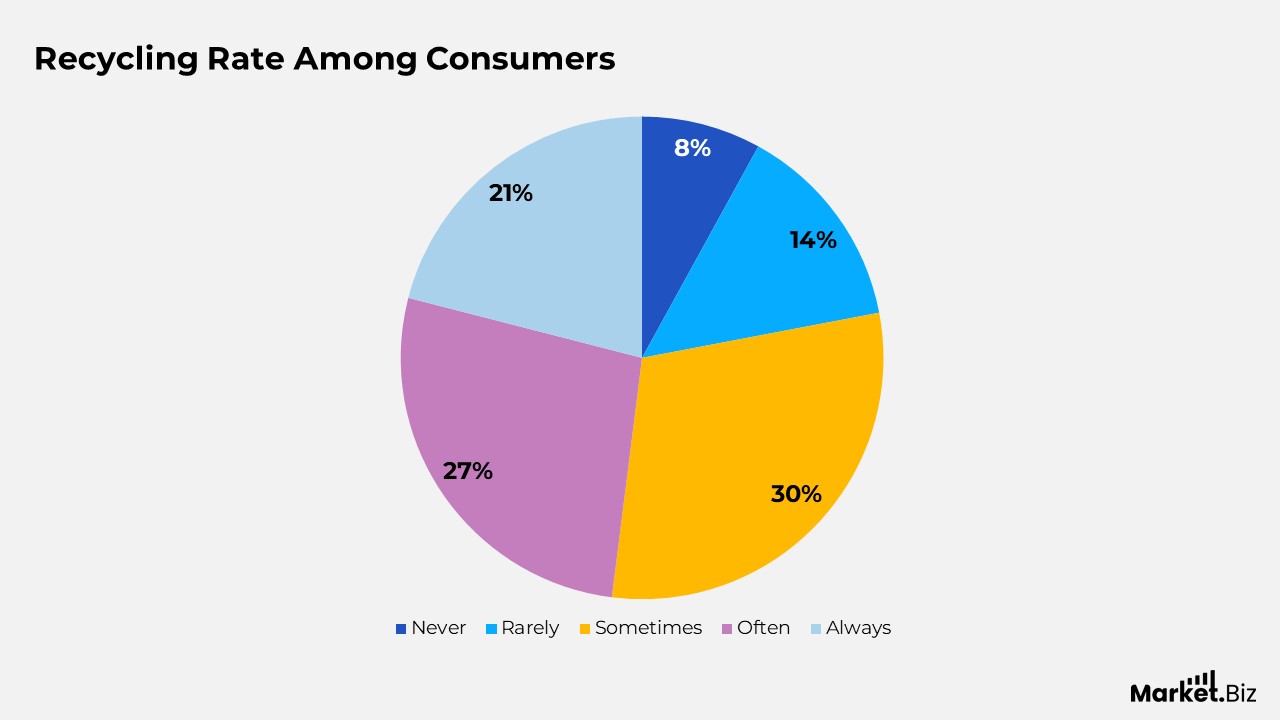
- In 2023, the recycling behaviors of consumers in Southeast Asia concerning single-use plastic bottles exhibited considerable variation.
- A small percentage of respondents, 8%, indicated that they never engage in recycling these bottles, whereas 14% mentioned that they do so infrequently.
- The most significant segment, accounting for 30% of respondents, expressed that they occasionally recycle single-use plastic bottles.
- Individuals who frequently recycle constituted 27% of the population, and 21% of respondents affirmed that they consistently recycle these bottles.
Recent Developments
- In 2023, Soma, a company known for its sustainable filtration systems and glass water bottles, raised $25 million in a Series B funding round.
- LARQ, a well-known startup recognised for its self-cleaning water bottles, has successfully secured $50 million in early 2024. This funding will be allocated towards research and development, the creation of new products, and the expansion of its global distribution network.
- In early 2024, S’well produced a new line of reusable water bottles called “Sustain,” made from 90% recycled stainless steel.
Reusable Water Bottles Future Prediction
- The worldwide market for reusable water bottles was anticipated to attain around $10.36 billion by the year 2026, as per a report from 2021, with a projected compound annual growth rate (CAGR) of 3.70% from 2020 to 2026.
- The reusable water bottle market in the Asia Pacific region was forecasted to witness a CAGR of 9% throughout the period ending in 2026.
Conclusion
Reusable Water Bottles Statistics: The worldwide market for reusable water bottles is witnessing considerable expansion. This growth is driven by a rising consumer consciousness regarding environmental sustainability and health advantages.
Insulated bottles lead the market, showcasing a robust demand for items that provide both practicality and eco-friendliness. Nevertheless, variations in consumption and recycling rates across regions suggest that while certain markets are well-developed, others remain in the developmental stage.
In spite of these obstacles, the market is anticipated to keep growing. This expansion is propelled by innovation and an increasing focus on minimising single-use plastics. Ongoing initiatives in recycling and consumer education will be crucial for maintaining this growth.
FAQs
Drinking the advised 8 glasses of water daily costs approximately $0.49 annually from the tap, whereas it amounts to $1,400 when using bottled water. 60% of adults in the U.S. possess a reusable water bottle, allowing them to filter water at home and carry it conveniently.
All containers for bottled water, irrespective of their composition, be it HDPE, PET, or PC plastic, are fully recyclable. The EPA reports that the recycling rate for PET plastic bottles and jars stands at 29.1%. Furthermore, the same webpage from the EPA states that the overall recycling rate for all plastic types (including PET, HDPE, PP, etc.) is 8.7%.
It is not solely about maintaining hydration; it is also about adhering to current trends. For Gen Z, a water bottle serves as a combination of a handbag, footwear, and a distinctive personality trait. They coordinate it with their attire, showcase it in social media Reels, and even promote eco-friendly attitudes while enjoying iced lattes.