
Introduction
Natural Gas Statistics: In recent years, natural gas has emerged as a vital component of the global energy mix, serving as a cleaner alternative to fossil fuels and facilitating the shift toward more sustainable energy sources. The demand for natural gas has surged notably across power generation, industrial uses, and residential heating, leading to substantial increases in both consumption and production worldwide.
Breakthroughs in extraction methods, such as hydraulic fracturing and horizontal drilling, have unlocked large reserves, particularly in North America, significantly altering global supply patterns. This statistical analysis explores key trends in natural gas production, consumption, trade flows, and pricing, offering valuable insights into the factors shaping the market, regional variations, and prospects in the energy sector.
Editor’s Choice
- The EIA projects natural gas production to average approximately 103 billion cubic feet per day (Bcf/d) throughout the latter half of 2023 and into 2024, maintaining levels close to historic highs for most of the forecast period.
- As of January 1, 2021, global established natural gas reserves were estimated at 7,299 trillion cubic feet (Tcf).
- According to the Energy Institute, worldwide natural gas production increased a little in 2023, reaching 4.05 trillion cubic meters, compared to 4.04 trillion cubic meters in 2022.
- When used for electricity generation, natural gas releases roughly 50-60% less carbon dioxide (CO2) than coal.
- Although natural gas usage for power generation grew by 2.6% in 2021, its share of the global electricity mix declined from 23.7% in 2020 to 22.9% in 2021.
- In 2023, natural gas contributed to 22.5% of global electricity generation, reflecting a decrease of about one percentage point from the previous year.
- Despite this share reduction, total global electricity generation from natural gas increased to 6,635 terawatt-hours in 2023, paralleling a rise in overall power demand.
(Source: U.S. Energy Information Administration)
Natural Gas Generator Market Size
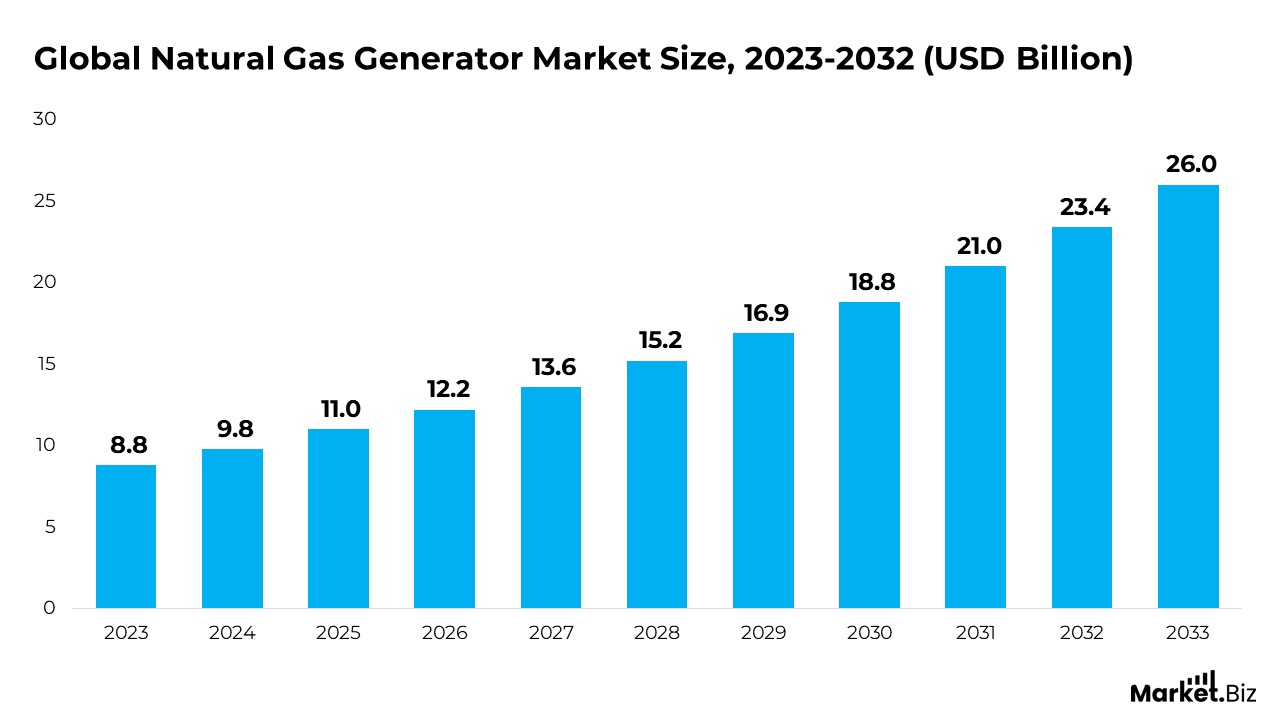
- According to Market.us, the global natural gas generator market is projected to grow from $8.8 billion in 2025 to $26 billion by 2032, representing a compound annual growth rate (CAGR) of 11.4% from 2022 to 2032.
- The market growth is driven by the rising incidence of power outages globally and a stronger focus on reducing carbon footprints, alongside the expanding adoption of natural gas and its increasing use in electricity generation.
- In 2023, the low-power genset category dominated the natural gas generator market, accounting for a share of more than 48%. This growth is largely fueled by the demand for dependable power backup solutions from the residential and commercial sectors, as modern households rely heavily on multiple electrical devices that require a stable energy supply.
- The standby application segment led the natural gas generator market in 2023, securing a commanding 61.2% market share. This dominance reflects the essential requirement for emergency power backup across diverse industries and institutions.
- The commercial sector was the largest contributor in 2023, holding over 51.6% of the natural gas generator market. The critical need for continuous power in commercial venues such as office buildings, hotels, retail outlets, and especially healthcare centers drives this segment’s strong position.
- North America led the natural gas generator market in 2023, with a 43% share valued at approximately US$3.2 billion. This leadership stems from the region’s abundant shale gas reserves, robust natural gas transport infrastructure, and the presence of key Original Equipment Manufacturers (OEMs) and Engineering, Procurement, and Construction (EPC) firms.
(Source: Market.us)
Global Natural Gas Statistics
- In January, the Henry Hub natural gas price averaged $3.30 per MMBtu when adjusted for inflation before declining to below $2.50 per MMBtu starting in February.
- U.S. natural gas consumption averaged 103.0 billion cubic feet per day (Bcf/d) from January 1 to April 30, 2023, marking a decrease of 1.0 Bcf/d compared to the same timeframe in 2022, as reported in the Natural Gas Monthly.
- This reduction was mainly driven by the residential and commercial sectors, where combined usage dropped by 18% in January and 12% in February 2023 compared to the previous year.
- Warmer-than-normal temperatures across the Lower 48 states resulted in fewer population-weighted heating degree days (HDDs) during January and February 2023 relative to the five-year average.
- The decline in HDDs led to reduced natural gas consumption for heating purposes, and, consequently, lower withdrawals from storage inventories.
- Overall, U.S. natural gas consumption averaged 103.0 Bcf/d between January and March 2023, down by 1.9 Bcf/d compared to the same period in 2022.
- Dry natural gas manufacture during the first half of 2023 rose by an estimated 6.2 Bcf/d over the previous year’s levels.
- After the withdrawal season (October 31 to March 31), storage inventories in the Lower 48 states stood 19% (294 Bcf) above the five-year average.
- Storage volumes remained significantly above the five-year average throughout the summer injection season (April 1 to October 31), supported by mild weather and elevated dry gas production.
- Natural gas demand in emerging and developing Asian markets increased by approximately 6% in 2024, accounting for nearly 40% of the global incremental gas demand.
(Source: U.S. Energy Information Administration)
Natural Gas Production
- Global natural gas production rose by 4.3% in 2021 but plateaued in 2022, reflecting a dip in overall demand.
- Russia experienced a sharp 12% reduction in gas output in 2022, primarily due to a decline in exports to European markets.
- This drop in Russian production was balanced by increased gas extraction in other regions such as North America, the Middle East, China, and Australia.
- North America’s gas production grew by 4.8% in 2022, with the U.S. contributing a 4.3% rise and Canada posting a stronger 7.3% increase.
- China’s gas output climbed by 6%, while Australia recorded a substantial 7.3% growth.
- The Middle East also experienced positive momentum, with gas production expanding by 3.2%.
- Latin America’s gas production rose by 3.7%, driven mainly by developments in Argentina’s Vaca Muerta field and increased output in Mexico.
- Conversely, Brazil’s gas production declined nearly 7%, attributed to a significant reduction in domestic gas consumption.
- In Europe, the Netherlands continued to reduce gas extraction, with a 15% decline in 2022, which contributed to a 7.6% overall decrease in EU gas production.
- Norway and the United Kingdom partially offset the EU’s production decline by increasing their output.
- Gas production across Africa fell by 4.8%, with lower yields reported in Algeria, Egypt, and Nigeria.
(Source: Enerdata, Down To Earth)
Natural Gas Consumption Statistics
- Global natural gas consumption has remained relatively steady over the past three years, with total usage reaching about four trillion cubic meters in 2023.
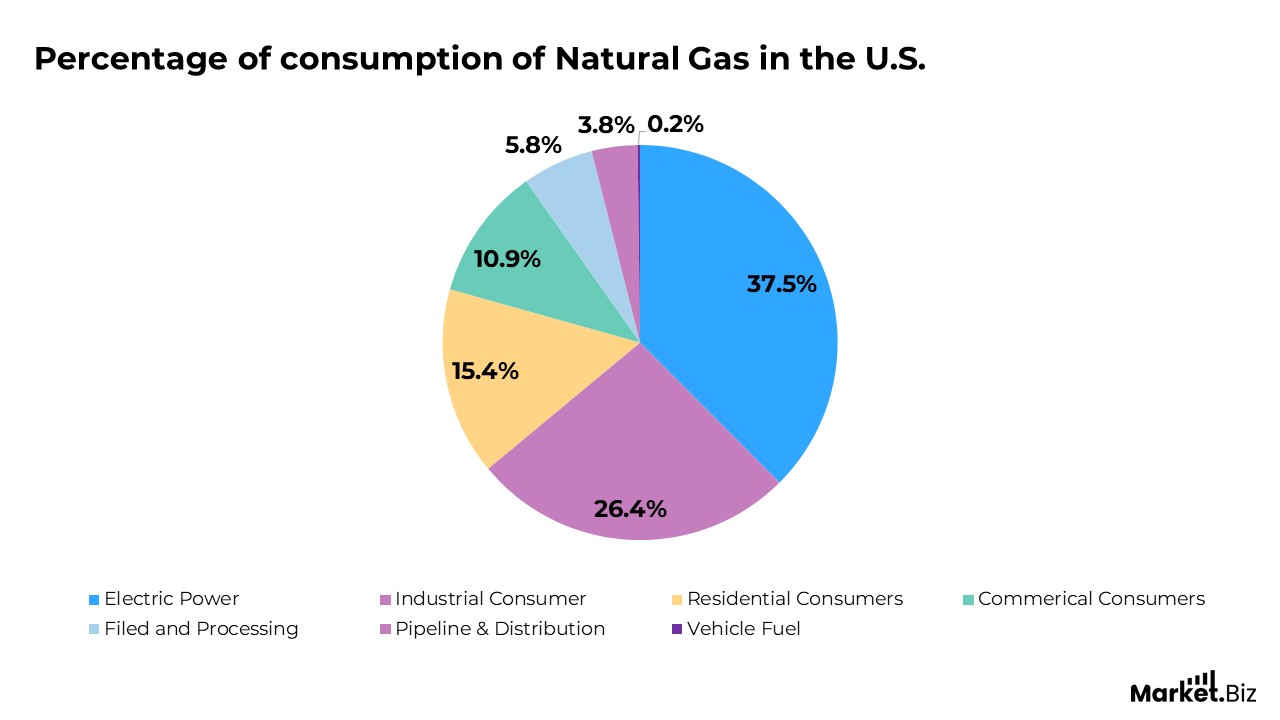
- In 2023, the United States was the world’s largest consumer of natural gas, with consumption gradually increasing since 1995 to approximately 32.5 trillion cubic feet. Within the U.S., the industrial sector accounted for the second-highest share of natural gas use, following electricity generation.
- According to the International Energy Agency (IEA), global natural gas consumption totalled around 4,239 billion cubic meters (bcm) in 2023.
Natural Gas Consumption By Country
| Country | Natural Gas Production In BCM (2025) |
|---|---|
| The U.S. | 886 |
| Canada | 121 |
| Brazil | 30 |
| Mexico | 97.6 |
| Russia | 453 |
| China | 405 |
| Iran | 246 |
| India | 62.6 |
| Australia | 40.1 |
| South Africa | 4.75 |
| Germany | 75.7 |
| U.K. | 63.5 |
| Argentina | 44.9 |
| Sweden | 0.72 |
| France | 33.9 |
| Spain | 29.3 |
| Norway | 3.79 |
| Chile | 7.01 |
(Source: World Population Review, Statista, IEA)
Gas Price
- Since the start of 2023, global natural gas prices have declined by $1.46 per million British thermal units (MMBtu), representing a 35.62% decrease based on contract-for-difference (CFD) trading that reflects the benchmark market.
- In the United States, natural gas prices typically fluctuate between $2.50 and $3.50 per million British thermal units (MMBtu).
- European natural gas prices exhibit significant variation across countries and regions, with current rates ranging from $6.00 to $10.00 per million British thermal units (MMBtu).
- Asian markets generally experience higher natural gas prices compared to other regions, with prices spanning from $8.00 to $14.00 per MMBtu, according to the latest figures.
- In the second half of 2024, natural gas prices were highest in Sweden (€0.1893 per KWh), Italy (€0.1586 per kWh) and the Netherlands (€0.1671 per kWh),
- The lowest natural gas prices during this period were recorded in Croatia (€0.0460 per kWh), Romania (€0.0540 per kWh), and Hungary (€0.0320 per kWh).
- Household natural gas prices in Sweden were over six times higher than those in Hungary.
- Prices in Sweden also exceeded the EU average (€0.1233 per KWh) by 54%
(Source: U.S. EIA, Eurostat, tradingeconomics, Ministry of Economy, Trade, and Industry)
Natural Gas Pipelines
- The U.S. natural gas pipeline system is a vast and interconnected network that transports natural gas across the continental United States.
- This network comprises approximately 3 million miles of mainline and other pipelines, connecting making sites and storage facilities to end-users.
- In 2022, approximately 29.2 trillion cubic feet (Tcf) of natural gas was delivered via this system to around 78.3 million consumers.
- The U.S. pipeline infrastructure includes about 305,000 miles of transmission pipelines for long-distance gas transport, supplemented by 2.2 million miles of distribution pipelines serving local utility areas.
- India announced plans on January 7, 2025, to expand its natural gas pipeline network by 10,805 kilometers (6,714 miles).
- This planned growth will build on the existing operational network of 24,945 kilometres (15,499 miles) as of September 10, 2024, representing a 62.6% increase since 2014, when the network was 15,340 kilometres (9,532 miles) long.
- As of 2021, over 35 Floating Storage Regasification Units (FSRUs) are actively operating globally.
- The typical storage capacity of an FSRU is approximately 170,000 cubic meters, equivalent to 6 million cubic feet of LNG.
(Source: Department for Energy Security & Net Zero, Climate Equity Monitor, U.S.EIA)
Global Natural Gas Statistics – By Country/Region
- In 2024, natural gas demand in emerging and developing Asian economies increased by approximately 6%, accounting for nearly 40% of the global rise in gas consumption. This surge was largely fueled by significant growth in China and India.
- China saw its natural gas demand rise by more than 7% during the year, although demand declined in the final two months.
- India experienced a 10% growth in natural gas demand, driven by a robust macroeconomic backdrop, the expansion of natural gas pipeline networks, and heightened gas-based power generation requirements amid high temperatures.
- North America’s natural gas consumption increased by about 1.8% (roughly 20 billion cubic meters) in 2024, primarily supported by demand for electricity generation.
- Industrial demand for natural gas showed a slight uptick compared to 2023. In the United States, total natural gas consumption increased by an estimated 1.9%, primarily driven by the power sector, where the share of gas reached a record 43%.
- In Latin America, natural gas usage grew by 1.6% (around 2 billion cubic meters) in 2024, driven mainly by power generation needs. This growth corresponded with a 17% increase in LNG imports, though trends varied across different countries.
Moreover
- Brazil and Colombia experienced particularly strong increases in natural gas demand, as severe droughts reduced hydropower availability, thereby increasing reliance on gas-fired electricity generation.
- The European Union’s natural gas consumption increased by approximately 1% in 2024. However, gas demand for power generation declined by around 5% despite an overall 1.5% rise in electricity consumption.
- In 2023, the European Union experienced a 7.1% decline in domestic natural gas demand compared to the previous year.
- The EU’s reliance on imported natural gas remained high in 2023, with an import dependency rate of 90%.
- Natural gas production within the EU continued to fall, decreasing by 18.6% in 2023 relative to 2022.
- Industrial consumption of natural gas in Europe continued to recover in 2024, aided by lower prices, but remained nearly 15% below pre-pandemic levels seen in 2019.
- The Middle East experienced an estimated 2% growth in natural gas demand, driven by increased usage in the power generation and industrial sectors. In contrast, Africa’s natural gas demand growth remained under 1%, constrained by subdued upstream production activities.
(Source: IEA, Eurostat)
Conclusion
Natural gas remains a vital component of the global energy framework, effectively addressing rising energy needs while facilitating the shift toward cleaner and more sustainable fuel options. Although there are regional differences and occasional fluctuations in production and consumption, natural gas exhibits strong stability, with consistent output and growing demand, particularly in emerging economies.
The extensive pipeline infrastructure in nations like the United States, along with planned expansions in countries such as India, underscores natural gas’s crucial role in ensuring energy security and driving economic development.
Nonetheless, challenges such as market price volatility and geopolitical risks remain, potentially impacting future supply and demand trends. On balance, natural gas is set to remain a key player in the global energy mix as efforts to achieve a more sustainable and diversified energy future continue.
FAQ’s
In 2023, worldwide natural gas production reached approximately 4.05 trillion cubic meters, reflecting a modest increase compared to previous years.
The United States ranks as the largest consumer and a leading producer, with Russia, China, and several Middle Eastern countries also contributing significantly to global natural gas production.
The U.S. consumed about 32.5 trillion cubic feet of natural gas in 2023, primarily driven by demand from the electricity generation and industrial sectors.
Natural gas accounted for nearly 22.5% of the world’s electricity generation in 2023, playing a vital role due to its comparatively lower carbon emissions than coal.
When used for power generation, natural gas emits roughly 50-60% less carbon dioxide than coal, positioning it as a cleaner alternative among fossil fuels.
Natural gas prices differ by region, with U.S. prices typically ranging between $2.50 and $3.50 per MMBtu, European prices falling between $6.00 and $10.00 per MMBtu, and Asian prices generally higher, ranging from $8.00 to $14.00 per MMBtu as of 2023-2024.