
Introduction
Insurtech Statistics: Insurtech refers to the rapid integration of advanced digital technologies into the insurance industry to improve efficiency, accuracy, and the customer experience. Insurtech statistics help measure the scale and direction of this shift by capturing data on digital policy adoption, automated claims processing, investment activity, customer behaviour, and operational cost optimisation across life, health, and property insurance segments.
These insights highlight how insurers are leveraging analytics, artificial intelligence, cloud platforms, and connected data to streamline underwriting, enhance fraud prevention, and offer more customized coverage. As the insurance sector continues to evolve toward data-driven and customer-centric models, Insurtech statistics provide a valuable lens for assessing innovation progress, competitive positioning, and long-term industry transformation.
Editor’s Choice
- Cumulative global Insurtech funding has exceeded USD 60.8 billion since 2012, reflecting sustained long-term investor confidence.
- Funding activity accelerated in Q1 2025, reaching USD 1.31 billion, despite broader market selectivity.
- Early-stage Insurtech investments declined to a 5-year low of USD 170.8 million in Q1 2025, signalling a shift toward later-stage, proven models.
- Merger and acquisition activity remains strong, highlighted by Munich Re’s acquisition of Next Insurance at a valuation of USD 2.6 billion.
- AI-centric Insurtech startups dominated deal flow, capturing 61.2% of Q1 2025 transactions and raising USD 710.9 million.
- The number of Insurtech unicorns increased to 35, with total capital raised surpassing USD 20.2 billion and combined valuations nearing USD 106 billion.
- The United States accounted for 58.8% of global deals in Q1 2025, reinforcing its leadership position.
- Asia-Pacific recorded a modest 16% deal share in Q2 2025, totalling USD 22 million across 10 deals.
- Embedded and health-benefit platforms, including ICHRA models, attracted USD 234 million in Q2 2025, representing nearly 20% of total global Insurtech funding.
How Insurtech Funding Shifted Across Insurance Segments Over Time
- Global Insurtech funding began at USD 127 million in 2008, with early investments distributed across commercial insurance (USD 35 million), customer acquisition (USD 18 million), insurance operations (USD 13 million), P2P insurance (USD 2 million), and personal insurance (USD 55 million).
- In 2009, total funding increased to USD 407 million, led by personal insurance at USD 188 million, followed by insurance operations (USD 62 million), commercial insurance (USD 55 million), customer acquisition (USD 35 million), and P2P insurance (USD 21 million).
- Funding declined to USD 200 million in 2010, with personal insurance accounting for USD 106 million, insurance operations USD 80 million, commercial insurance USD 10 million, customer acquisition USD 4 million, and P2P insurance USD 0 million.
- In 2011, total Insurtech investments recovered to USD 317 million, driven by personal insurance (USD 164 million), insurance operations (USD 106 million), commercial insurance (USD 37 million), customer acquisition (USD 10 million), and P2P insurance (USD 0 million).
- Funding rose to USD 578 million in 2012, with insurance operations leading at USD 449 million, followed by personal insurance (USD 106 million), commercial insurance (USD 22 million), customer acquisition (USD 22 million), and P2P insurance (USD 0 million).
Moreover
- A major acceleration occurred in 2013, when total funding reached USD 1,553 million, including insurance operations (USD 529 million), commercial insurance (USD 431 million), personal insurance (USD 463 million), customer acquisition (USD 129 million), and P2P insurance (USD 3 million).
- In 2014, Insurtech funding remained strong at USD 1,600 million, supported by insurance operations (USD 748 million), personal insurance (USD 519 million), commercial insurance (USD 249 million), customer acquisition (USD 84 million), and P2P insurance (USD 4 million).
- The funding peak was reached in 2015, with total investments of USD 3,009 million, dominated by personal insurance (USD 1,692 million), insurance operations (USD 1,143 million), commercial insurance (USD 128 million), customer acquisition (USD 45 million), and P2P insurance (USD 11 million).
- In 2016, funding declined to USD 1,463 million, with personal insurance at USD 689 million, insurance operations at USD 511 million, customer acquisition at USD 162 million, commercial insurance at USD 86 million, and P2P insurance at USD 16 million.
- Investor confidence returned in 2017, pushing total funding to USD 2,491 million, led by customer acquisition (USD 820 million), insurance operations (USD 612 million), personal insurance (USD 688 million), commercial insurance (USD 360 million), and P2P insurance (USD 11 million).
- In 2018, total Insurtech funding reached USD 2,609 million, driven primarily by personal insurance (USD 1,645 million), insurance operations (USD 597 million), commercial insurance (USD 390 million), customer acquisition (USD 362 million), and P2P insurance (USD 20 million).
- By H1 2019, Insurtech investments had already totaled USD 2,216 million, including personal insurance (USD 927 million), insurance operations (USD 597 million), commercial insurance (USD 270 million), customer acquisition (USD 197 million), and P2P insurance (USD 225 million).
(Source: Deloitte)
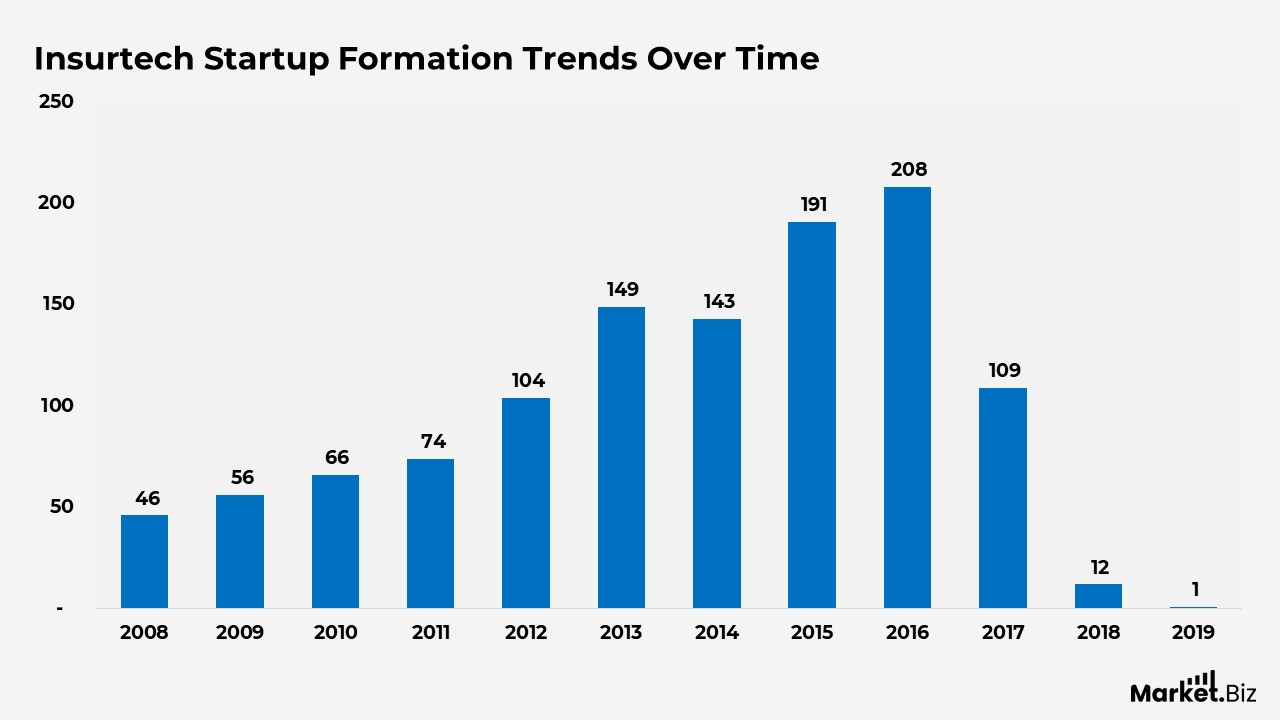
Insurtech Startup Formation Trends Over Time
- Insurtech startup formation began at an early experimentation stage in 2008, with a total of 46 companies launched across all insurance technology categories.
- In 2009, the number of newly founded Insurtech startups increased to 56, reflecting growing confidence in digital insurance concepts and early venture interest.
- Startup activity continued to rise in 2010, reaching 66 new companies as customer acquisition and operational efficiency tools gained traction.
- By 2011, annual Insurtech launches had climbed further to 74, indicating steady momentum across multiple insurance technology segments.
- A notable acceleration occurred in 2012, when total startup formation rose to 104, driven largely by increased activity in insurance operations and digital distribution models.
- The market entered a rapid expansion phase in 2013, with 149 Insurtech startups launched, marking the first year of large-scale experimentation across the insurance value chain.
- Although slightly lower, 143 new Insurtech companies were still founded in 2014, confirming sustained innovation and continued investor and founder interest.
- In 2015, Insurtech startup creation surged to 191, highlighting peak enthusiasm for insurance technology solutions across personal, operational, and customer-focused segments.
- The sector reached its highest point in 2016, with 208 new Insurtech startups launched, representing the peak of category diversification and market entry.
- A sharp decline followed in 2017, as startup formation dropped to 109, signaling early signs of saturation and increasing competitive pressure.
- In 2018, new Insurtech launches fell dramatically to just 12, indicating a major shift away from new company creation toward consolidation and scale-up of existing players.
- During the first half of 2019, only 1 new Insurtech startup was recorded, reinforcing the view that the market had largely reached saturation.
(Source: Deloitte)
How Insurtech Is Reshaping Core Insurance Business Functions
- Marketing and distribution channels experience the greatest impact from Insurtech, with 87%, reflecting strong adoption of digital platforms, data-driven targeting, and online policy distribution.
- Claims management is undergoing a significant transformation, with an 81% impact as automation, AI-driven assessment, and faster settlement processes become more prevalent.
- Product design shows an 81% impact from Insurtech, driven by modular policies, personalization, and rapid product innovation enabled by analytics and technology platforms.
- Underwriting processes are affected at a rate of 79%, highlighting the growing use of data analytics, alternative data sources, and automated risk assessment models.
- Customer service records a 77% impact, supported by chatbots, self-service portals, and Omni channel engagement tools, improving responsiveness and experience.
- Pricing functions see a 75% impact as real-time data, usage-based models, and dynamic pricing mechanisms reshape traditional premium calculation methods.
- Training and sales activities are influenced by 48%, reflecting moderate adoption of digital training tools, CRM platforms, and technology-assisted sales enablement.
- Organisational management shows a 38% impact, indicating a gradual integration of Insurtech solutions into internal workflows and decision-making structures.
- Regulation and supervision functions register a 37% impact, as compliance technologies and automated reporting tools begin to support regulatory oversight.
- Use of funds is impacted by 36%, suggesting early-stage adoption of analytics-driven capital allocation and investment optimisation tools.
(Source: KPMG, Statista)
Industry Background of Participants in Insurtech Research Studies
- Insurance companies account for the largest share of respondents, at 47%, indicating strong participation by traditional insurers in industry discussions.
- Technology companies contribute 22% of interviewees, highlighting the growing role of software, data, and digital platform providers in insurance transformation.
- Participants categorized under other industries make up 12%, reflecting diverse perspectives from adjacent or supporting sectors.
- Internet-based companies account for 8% of respondents, underscoring the influence of digital-first, online service-driven business models.
- Internet insurance companies account for 7% of participants, underscoring the growing role of fully digital or platform-led providers.
- University and research institutions contribute 4% of interviewees, indicating academic- and research-driven input into Insurtech innovation and analysis.
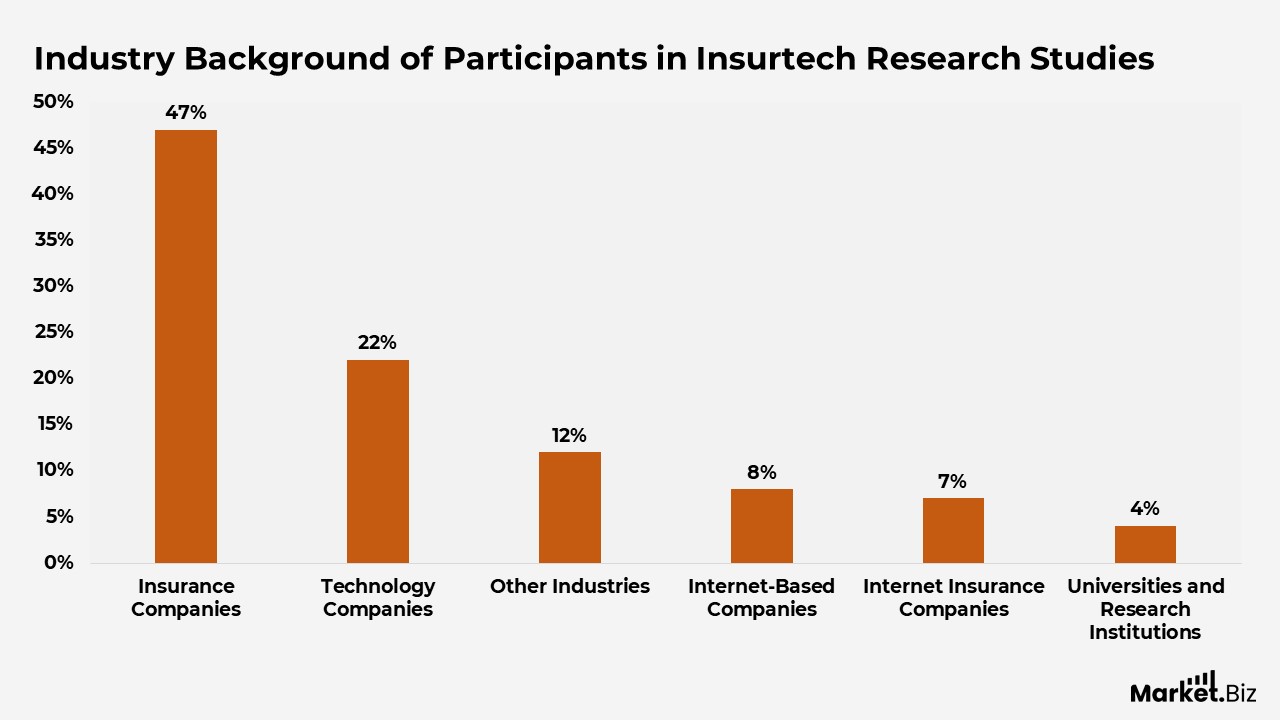
(Source: KPMG, Statista)
How Insurtech Is Expected to Shape the Future of Insurance
- A strong majority of respondents (68%) view Insurtech as a critical infrastructure component that will play a central role in the future development of the insurance industry.
- About 30% of participants consider Insurtech an important enabler of industry growth, but not the single decisive factor driving transformation.
- Only 1% of respondents believe Insurtech will have a limited impact on the future of insurance, indicating minimal skepticism about its relevance.
- Another 1% of participants regard Insurtech as not important to the industry’s future direction, representing a very small minority view.
(Source: KPMG, Statista)
How New Technologies Are Influencing Modern Insurance
- Big data analytics is viewed as the most influential technology, with 93% of respondents identifying it as a key driver of future development in the insurance industry.
- Artificial intelligence follows closely, with 87% indicating a strong impact across underwriting, claims automation, fraud detection, and customer engagement.
- Cloud computing is considered highly important by 66% of respondents, reflecting its role in scalability, data integration, and digital platform modernization.
- Biomedical technologies are expected to influence the industry’s future by 62%, particularly in health and life insurance through improved risk assessment and personalized coverage.
- Blockchain is recognized by 57% of participants as a technology with meaningful potential to enhance transparency, security, and trust in insurance processes.
- The Internet of Things is identified by 56% as a critical enabler of real-time data collection, usage-based insurance, and connected risk monitoring.
- Fifth-generation connectivity is seen as impactful by 32%, supporting faster data transmission and advanced connected insurance applications.
- Other emerging technologies collectively account for 2%, indicating limited perceived influence outside the main digital innovation areas.
(Source: KPMG, Statista)
Preferred Models for Acquiring Insurtech Solutions
- A strong majority of respondents (82%) prefer a hybrid approach that combines internal research and development with external technology procurement when sourcing Insurtech solutions.
- About 10% of participants rely exclusively on in-house research and development to build Insurtech capabilities, emphasizing internal innovation and proprietary systems.
- Only 8% of respondents source Insurtech solutions solely through external procurement, indicating limited reliance on third-party vendors.
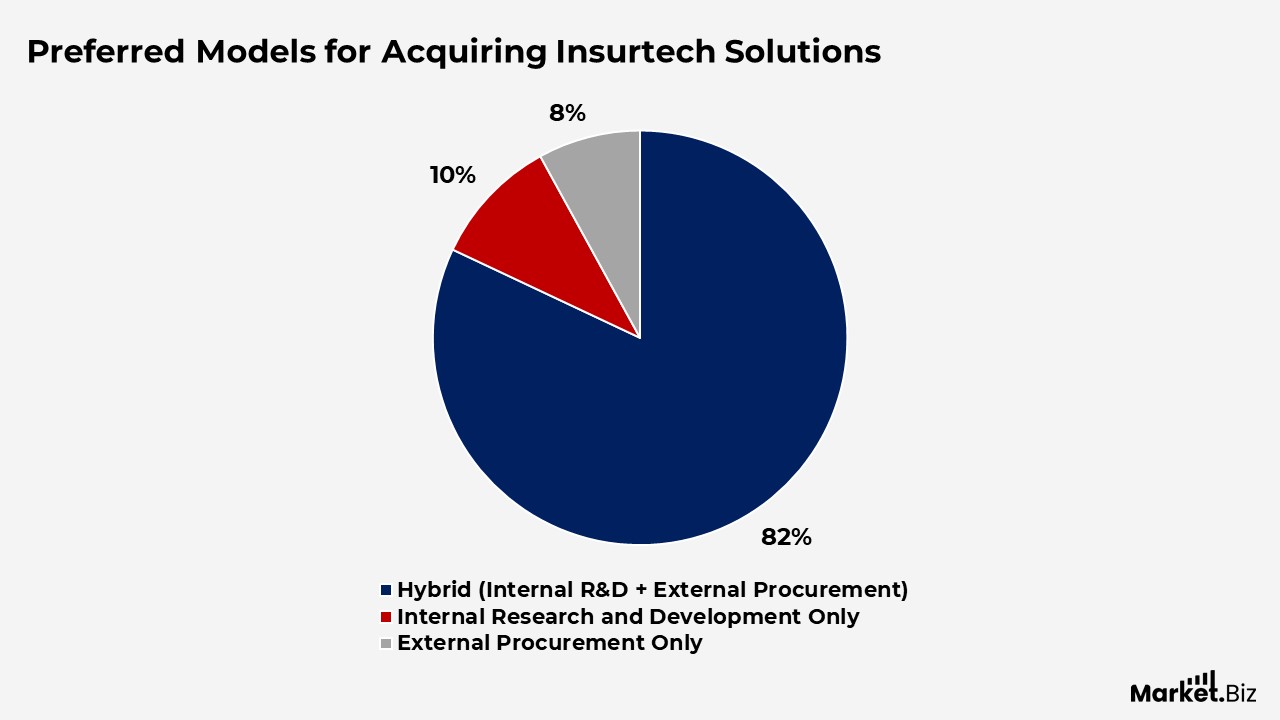
(Source: KPMG, Statista)
AI and Automation Adoption Trends in the Insurance Industry
- By 2025, approximately 34% of insurers will have fully embedded artificial intelligence across core operations, highlighting rapid progress in digital transformation.
- The use of AI-powered chatbots and virtual assistants continues to expand, with customer satisfaction scores rising to around 83%, reflecting improved service responsiveness and engagement.
- Machine-learning-driven fraud-detection systems can now identify suspicious insurance claims within 2 weeks, with leading solutions achieving accuracy of up to 91% under optimal conditions.
- The global market for telematics-based auto insurance is expected to reach approximately USD 5.89 billion by 2025, supported by the growing adoption of real-time, usage-based pricing models.
- Around 53% of organizations have already initiated robotic process automation programs, while an additional 19% plan to adopt RPA solutions within the next two years.
(Source: CoinLaw, Statista)
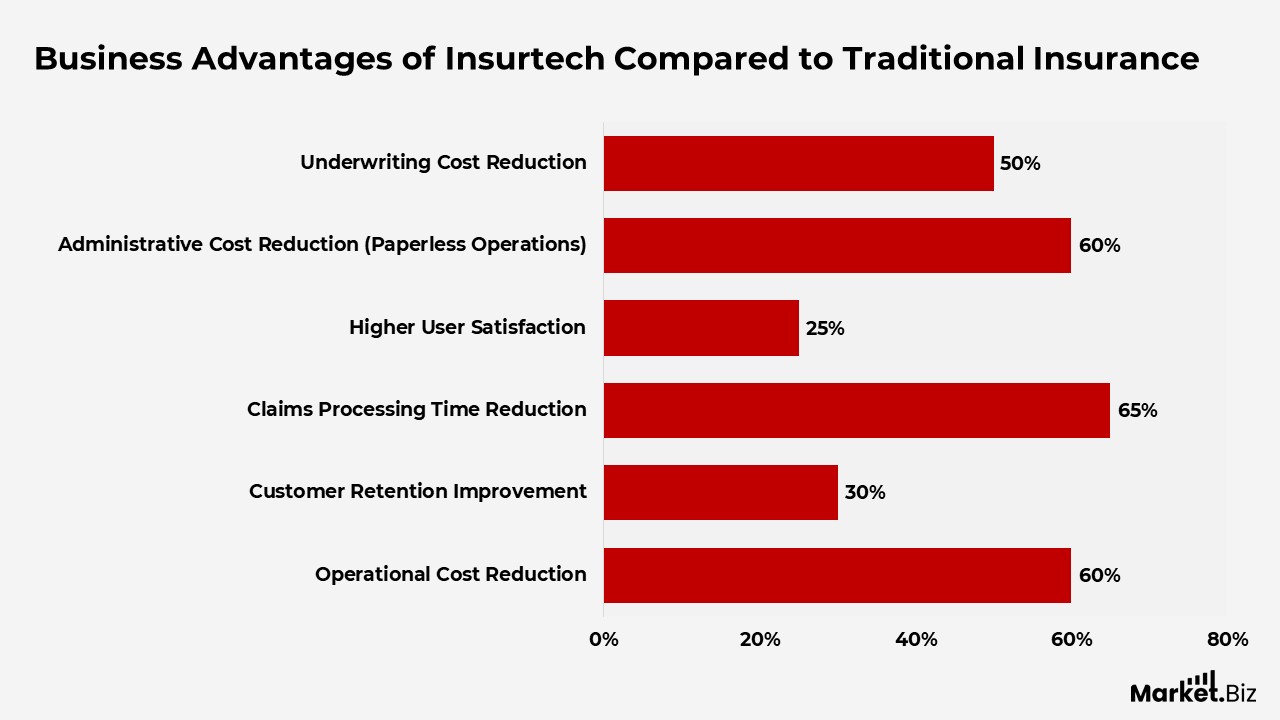
Business Advantages of Insurtech Compared to Traditional Insurance
- Digital insurance platforms are reducing operational expenses by up to 60%, enabling insurers to offer more competitive, affordable premiums.
- Customer retention rates improve by approximately 30% on digital platforms, supported by faster claims resolution and more personalized service experiences.
- Automation and AI have reduced claims processing timelines by up to 65%, significantly improving efficiency across Insurtech-driven workflows.
- User satisfaction levels on Insurtech platforms are around 25% higher than those of traditional insurers, reflecting growing preference for digital-first models.
- Paperless operations in Insurtech companies reduce administrative costs by nearly 60% while supporting environmentally sustainable practices.
- Insurtech platforms are up to 3 times more likely to deliver customized insurance policies than conventional insurers, driven by advanced data analytics and AI modelling.
- Automated risk assessment technologies reduce underwriting costs by around 50%, improving accessibility and pricing flexibility for customers.
(Source: CoinLaw, Statista)
Innovations Accelerating Insurtech Transformation
- Blockchain-enabled insurance solutions expanded rapidly, reaching an estimated value of USD 3.11 billion in 2025, up from USD 1.94 billion in 2024.
- Smart contracts are increasingly adopted for policy execution and fraud prevention, improving transparency and reducing manual intervention.
- IoT-powered technologies, including connected homes and vehicle telematics, now influence roughly 20% of property and auto insurance policies.
- Usage-based insurance models recorded growth of more than 60% in 2025, enabling premiums to be aligned with customers’ actual behaviour.
- Peer-to-peer insurance models are gaining traction, with adoption increasing by approximately 35%, driven by community-based risk-sharing.
- Wearable health devices now shape up to 40% of newly launched health insurance products, particularly in wellness-focused and incentive-based plans.
- AI-driven personalization strategies improve customer engagement by up to 45%, especially when insurers leverage behavioral and usage data.
(Source: CoinLaw, Statista)
Average Salary Distribution in the Insurance Industry
- Around 39% of insurance professionals earn annual salaries between USD 22.5K and USD 44.5K.
- Approximately 20% of employees fall within the USD 44.5K to USD 66.5K income range.
- About 15% of the workforce earns between USD 66.5K and USD 88.5K annually.
- Another 20% of insurance industry employees report salaries of USD 88.5K or higher.
(Source: CoinLaw, Statista)
Conclusion
Insurtech statistics highlight the accelerating integration of digital technologies into the insurance sector, transforming how insurers operate, engage customers, and manage risk. Trends in startup activity, investment patterns, and technology adoption reveal a clear progression from early experimentation toward more mature, scalable models focused on efficiency and long-term value creation.
The growing influence of data analytics, artificial intelligence, cloud platforms, and connected technologies underscores their role as essential building blocks of modern insurance systems. Taken together, these statistics show that Insurtech has evolved into a core driver of industry transformation, positioning technology as a central factor in shaping the future competitiveness and sustainability of insurance markets.
FAQ’s
Insurtech statistics are quantitative indicators that track the adoption of digital technologies across the insurance industry. These statistics cover areas such as technology adoption rates, startup activity, investment trends, customer behavior, operational efficiency, claims automation, and the overall impact of innovation on insurance business models.
Insurtech statistics help insurers, investors, and policymakers understand how rapidly the industry is transforming. They provide evidence of where technology is delivering value, which functions are most impacted, and how digital adoption is influencing competitiveness, cost efficiency, and customer experience.
Traditional insurance data focuses on premiums, claims ratios, and policy volumes, while Insurtech statistics emphasize technology-driven metrics such as digital distribution, automation levels, data analytics usage, and innovation investment. This offers a forward-looking view of industry evolution rather than focusing solely on financial performance.
Insurtech statistics consistently show strong adoption of technologies such as artificial intelligence, big data analytics, cloud computing, blockchain, and the Internet of Things. These tools are increasingly used to improve underwriting accuracy, accelerate claims processing, enhance fraud detection, and personalize insurance products.
Data indicates that marketing and distribution, claims management, product design, underwriting, pricing, and customer service are the most affected functions. These areas exhibit the highest levels of digital transformation, driven by automation and data-driven decision-making.