
Introduction
Video streaming statistics provide a concise, data-driven overview of how digital video consumption is evolving across platforms, devices, and regions, reflecting the growing shift toward on-demand, live, and short-form video content. These statistics capture key indicators such as user penetration, average viewing time, device preferences, content format trends, monetization models, and regional consumption patterns, helping quantify changes in audience behavior.
Driven by expanding broadband infrastructure, rising smartphone and smart TV adoption, and advances in streaming technologies, video streaming data supports strategic decision-making for platforms, content producers, advertisers, and policymakers, while offering clear insight into the scale, maturity, and future direction of the global digital media ecosystem.
Editor’s Choice
- In 2023, global online video streaming platforms collectively recorded around 1.8 billion subscribers, representing an overall market penetration of 17%, highlighting the rapid mainstream adoption of digital video services.
- Subscriber expansion is expected to accelerate in 2024, supported by rising broadband access, mobile video consumption, and increasing availability of localized streaming content.
- By 2027, the global subscriber base for video streaming services is projected to surpass 2.1 billion, pushing worldwide penetration close to 20%.
- Netflix remains the largest individual streaming platform globally, supported by a paid membership base exceeding 260.28 million, reinforcing its leadership in subscription-driven video services.
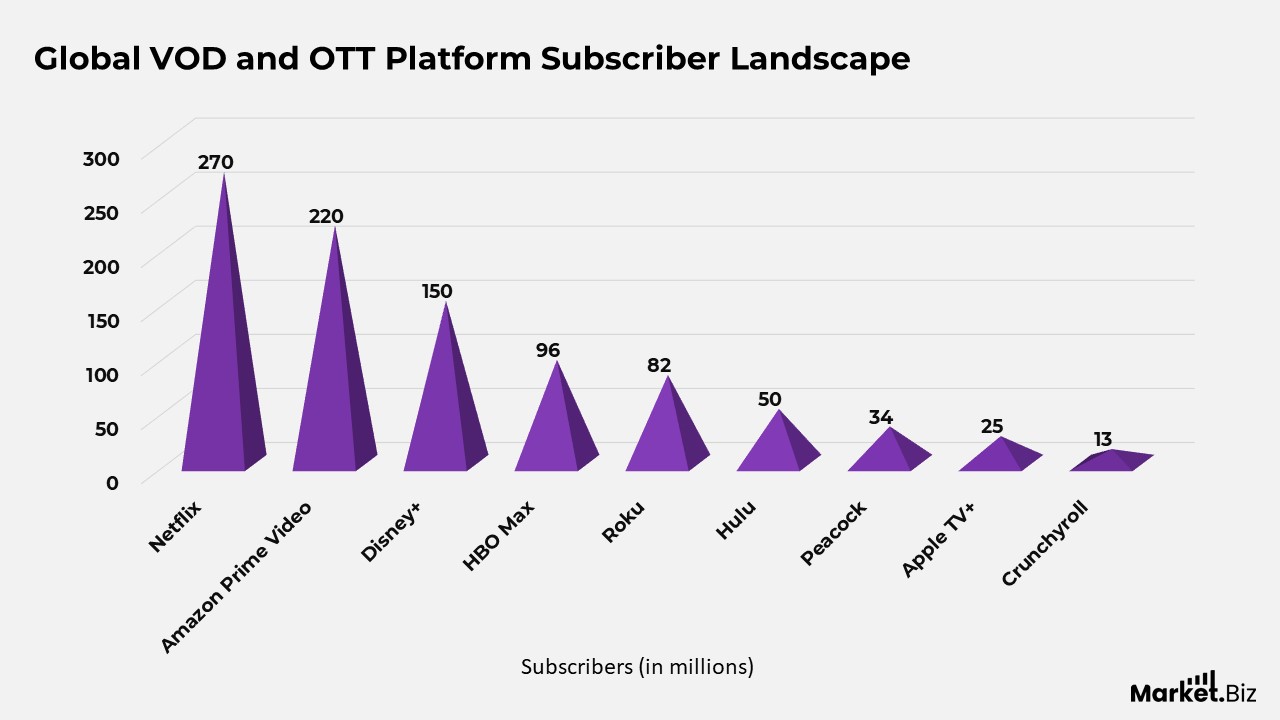
Global VOD and OTT Platform Subscriber Landscape
- Netflix leads the global VOD and OTT market with 269.6 million subscribers, reflecting its extensive content portfolio and strong international penetration.
- Amazon Prime Video follows with 220 million subscribers, supported by bundled Prime memberships and broad regional availability.
- Disney+ records 150.2 million subscribers, driven by exclusive franchise content and strong family-oriented programming.
- HBO Max reaches 95.6 million subscribers, backed by premium originals and a well-established entertainment brand.
- Roku serves 81.6 million users, benefiting from its platform-based ecosystem and growth in ad-supported streaming.
- Hulu has 50.2 million subscribers, supported by its mix of on-demand content and live TV offerings.
- Peacock has 34 million subscribers, reflecting steady adoption through sports, news, and tiered subscription models.
- Apple TV+ reports 25 million subscribers, driven by high-quality original productions and ecosystem integration.
- Crunchyroll maintains 13 million subscribers, highlighting sustained global demand for anime-focused streaming services.
(Source: VdoCipher)
Streaming Device Preferences and Viewer Behavior Statistics
- Smart TVs dominate streaming device usage, with 74.5% of households relying on them as the primary screen for video consumption, driven by larger displays and integrated streaming platforms.
- Streaming sticks follow closely, used by 64% of households, reflecting their affordability and ease of upgrading traditional televisions.
- Gaming consoles have emerged as a significant streaming medium, with adoption reaching 43.5%, supported by their multifunctional entertainment capabilities.
- In Asia, mobile phones have overtaken desktops as the preferred streaming device, with 45% of users streaming via smartphones, highlighting a strong mobile-first consumption trend.
- Large-screen devices such as TVs account for 43% of streaming usage in Asia, while desktops lag significantly, with only 7% adoption.
- Millennials and Gen Z demonstrate high subscription flexibility, frequently cancelling and reactivating services based on the availability of specific content.
- Binge-watching behaviour is most prevalent among the 30 to 44 age group, with 70% engaging in extended viewing sessions, which influence both device choice and content format preferences.
- Ad-supported streaming models continue to gain momentum, as nearly 57% of consumers show interest due to their lower cost and flexible access options.
(Source: Comparitech, Exploding Topics, VdoCipher)
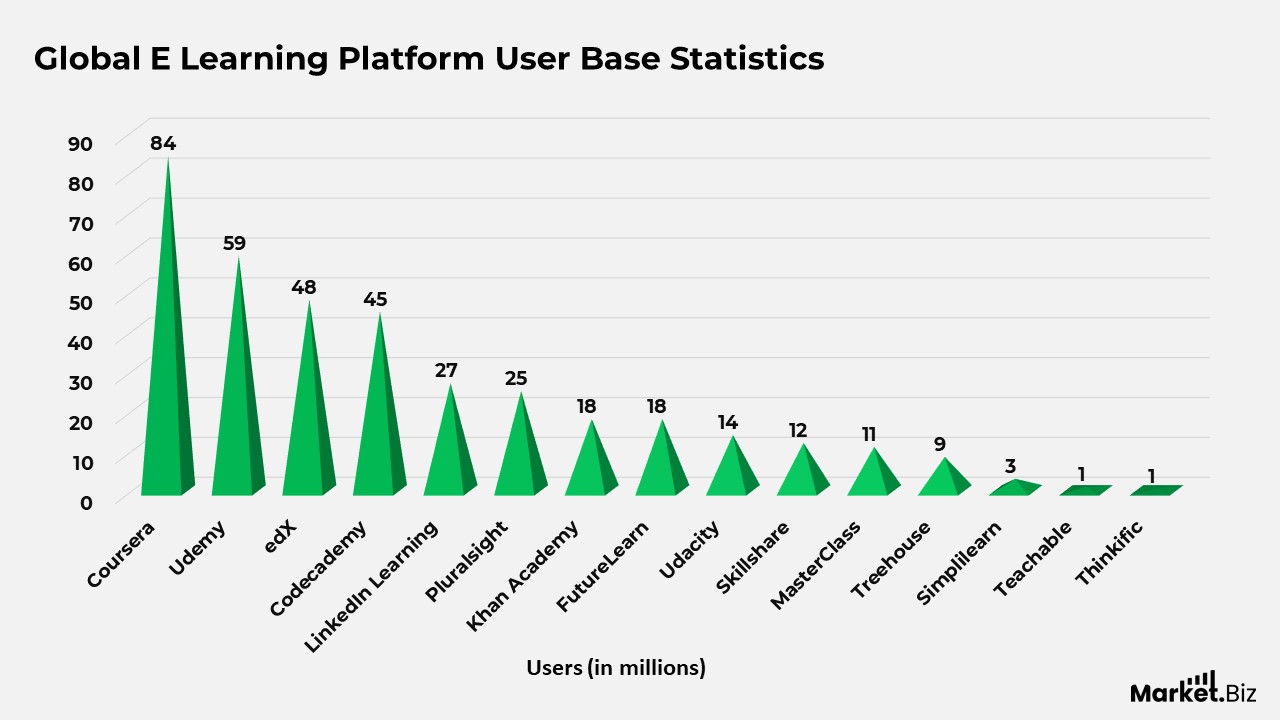
Global E Learning Platform User Base Statistics
- Coursera leads the global e learning landscape with 84 million users, driven by university partnerships and professional certification programs.
- Udemy follows with 59 million users, supported by its extensive marketplace of skill-based and vocational courses.
- edX records 48 million users, reflecting strong adoption of academic- and industry-aligned online learning programs.
- Codecademy has built a user base of 45 million, highlighting strong demand for coding- and programming-focused education.
- LinkedIn Learning reaches 27 million users, benefiting from its integration with professional networking and career development tools.
- Pluralsight accounts for 25 million users, supported by its focus on technology, software development, and IT skills training.
- Khan Academy serves 18 million users, emphasizing free foundational education and lifelong learning access.
- FutureLearn also records 18 million users, driven by short courses and degree programs in collaboration with global institutions.
- Udacity attracts 14 million users, reflecting interest in nano degree programs and advanced digital skills.
- Skillshare has 12 million users and offers creative, design, and entrepreneurship-focused learning content.
- MasterClass reports 11 million users, driven by premium content delivered by industry leaders and celebrities.
- Treehouse serves 8.5 million users and focuses primarily on coding and technology education for beginners.
- Simplilearn reaches 3 million users, supported by professional certification and corporate training programs.
- Teachable records 1 million users, reflecting its role as a platform for individual course creators and educators.
- Thinkific has 0.5 million users, primarily serving small businesses and independent instructors building custom courses.
(Source: Comparitech, Exploding Topics, VdoCipher)
E Learning Platform Content Preferences and Enrollment Trends
- Coursera shows strong demand for technology and business programs, with data science and computer science driving 56% of total enrollments. In comparison, 77% of users primarily use the platform to build career-focused skills.
- Udemy’s course demand is led by web development, IT certification preparation, and marketing, supported by a catalogue of over 200,000 courses, with business-related learning recording 70% growth during the pandemic.
- edX continues to see high engagement in computer science, business management, and engineering, with STEM-related enrollments increasing by 28% as the adoption of professional certificate programs rises.
- Khan Academy records strong engagement in mathematics, accounting for 55% of total views across K-12 and SAT preparation, while mobile learners account for 40% of platform traffic following a 60% surge in usage.
- LinkedIn Learning is dominated by business analytics and leadership development courses, with 80% of learners using the platform to support career advancement objectives.
- MasterClass attracts high interest in creative arts, business leadership, and culinary courses, while self-care and wellness content consumption increased by 80%.
- Skillshare sees high engagement in photography, graphic design, and writing, with user-generated creative hobby courses accounting for 40% of total enrollments.
- Pluralsight’s strongest demand comes from cloud computing, cybersecurity, and software development, with 55% of businesses using the platform to address technology skill gaps.
Moreover
- FutureLearn reports strong interest in healthcare, language, and digital skills programs, alongside a 30% increase in business and management enrollments driven by workforce upskilling needs.
- Treehouse remains focused on web development and programming, with short-form courses under 30 minutes experiencing a 45% increase in consumption.
- Teachable highlights content marketing, business branding, and freelancing as key learning areas, with 68% of content creation and consumption driven by solo entrepreneurs.
- Thinkific records strong enrollments in business skills, fitness, and health education, with fitness coaching courses increasing by 50% in the post-2020 period.
- Codecademy maintains strong demand for Python, web development, and data science, while interest in backend programming languages has grown by 30%.
- Simplilearn shows rising demand for data science, project management, and IT security, with certification programs accounting for 60% of new enrollments.
- OpenLearn attracts learners to language, health, and social science courses, with social science enrollments rising by 50% amid growing academic and lifelong learning interest.
- Udacity leads in advanced technology education, with machine learning, data science, and robotics among its top programs, and its nanodegree courses achieving retention rates of up to 80%.
(Source: BitDegree, Online Courseing, Thinkific, skillfrontier.io)
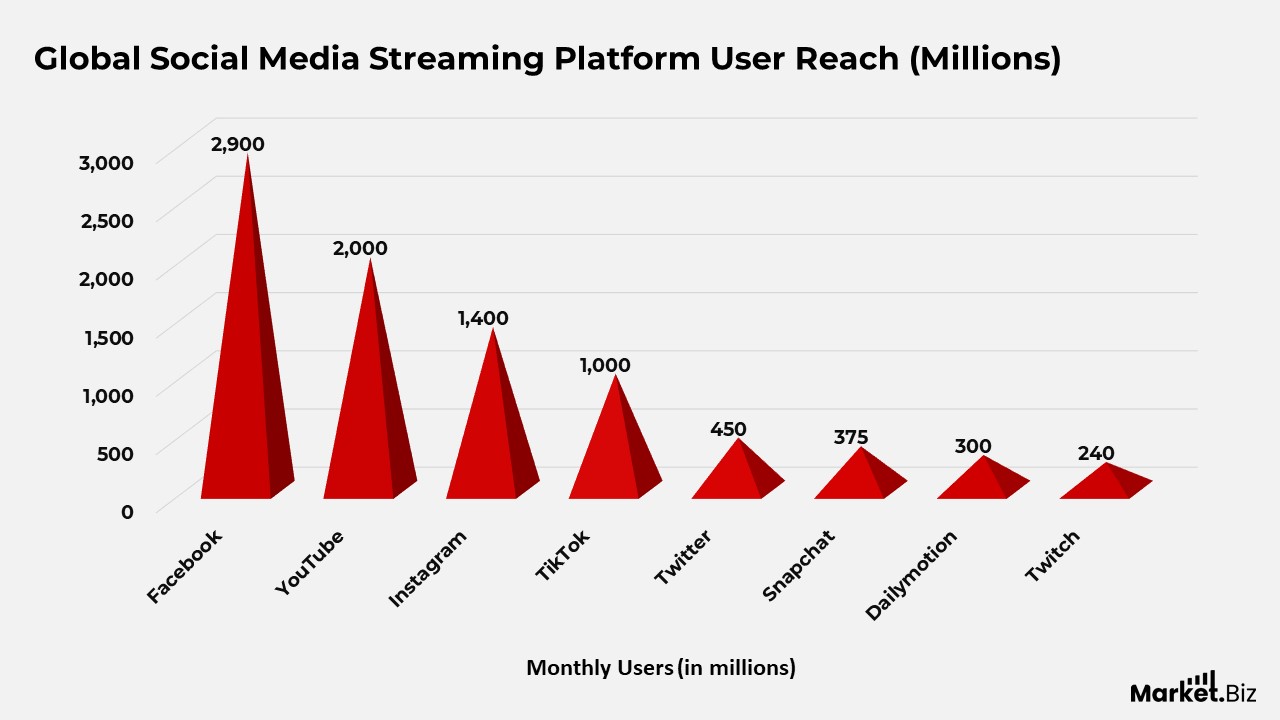
Global Social Media Streaming Platform User Reach
- Facebook has the largest monthly user base among social media platforms, with 2,900 million users, driven by its broad demographic reach and integrated video features.
- YouTube follows closely with 2,000 million monthly users, reflecting its dominance in long-form, short-form, and live video streaming.
- Instagram has 1,400 million monthly users, supported by strong engagement with Reels, Stories, and live streaming.
- TikTok attracts 1,000 million monthly users, driven by short-form video consumption and high creator engagement.
- Twitter reaches 450 million monthly users, leveraging real-time content sharing and live video discussions around news and events.
- Snapchat accounts for 375 million monthly users, supported by ephemeral video content and strong youth engagement.
- Dailymotion records 300 million monthly users, reflecting steady demand for curated and independent video content.
- Twitch reaches 240 million monthly users, driven primarily by live game streaming, esports, and creator-led communities.
(Source: Comparitech, Exploding Topics, VdoCipher)
Content Consumption Patterns Across Social Media Streaming Platforms
- YouTube continues to be driven by gaming, music, and educational content, generating over 1 billion hours of video watched daily, while YouTube Shorts have accelerated platform engagement by 30% since launch.
- Twitch remains heavily gaming-centric, with gaming streams accounting for 80% of live content. In comparison, non-gaming categories such as conversational streams show 20% annual growth and average concurrent viewership of 2.5 million.
- Facebook sees strong traction from live streams and on-platform video content, collectively generating 1 billion daily video views alongside a 30% rise in overall video consumption.
- Instagram engagement is increasingly shaped by Reels, which now account for over 20% of total time spent on the platform, reinforcing short-form video dominance.
- TikTok’s growth is fueled by short-form video consumption, with users averaging more than 850 minutes of monthly usage, driven by viral dance trends, memes, and educational clips.
- Snapchat’s ecosystem is led by Stories and visual messaging, with 75% of Gen Z users active daily, while Spotlight content has grown 40% in recent years.
- Twitter shows significantly higher engagement with multimedia formats, as video posts and audio-based Spaces generate up to 10x more interaction than text, particularly in sports, news, and entertainment.
- Dailymotion maintains a steady demand for news, entertainment, and sports videos, supported by a monthly audience of 300 million users across Europe and Asia.
(Source: Brian Vander Waal, The Tech Edvocate, UpJourney, Transizion, Upskillwise, Thinkific)
Global Video Advertising Spend and Engagement Trends
- Global expenditure on video advertising is projected to reach USD 191.3 billion in 2024, reflecting the continued shift of marketing budgets toward digital video channels.
- The United States is expected to lead video advertising revenues, generating over USD 84,610 million in ad revenue, supported by a mature digital advertising ecosystem.
- Viewer expectations are evolving: 43% of users prefer shorter ad breaks, and 33% want advertisements aligned with their chosen content categories.
- Video advertisements on YouTube attract significantly higher engagement, garnering 62% more viewer attention than traditional television advertising.
- Facebook remains a key video marketing platform, with more than 73% of marketers using Facebook video ads to promote products and services.
- Video content plays a central role in modern marketing, as 92% of marketers consider it an essential part of their overall strategy.
- In 2024, average video advertising spend per user is projected to exceed USD 34, highlighting improved monetization across digital video platforms.
(Source: VideoCrypt Software Pvt. Ltd.)
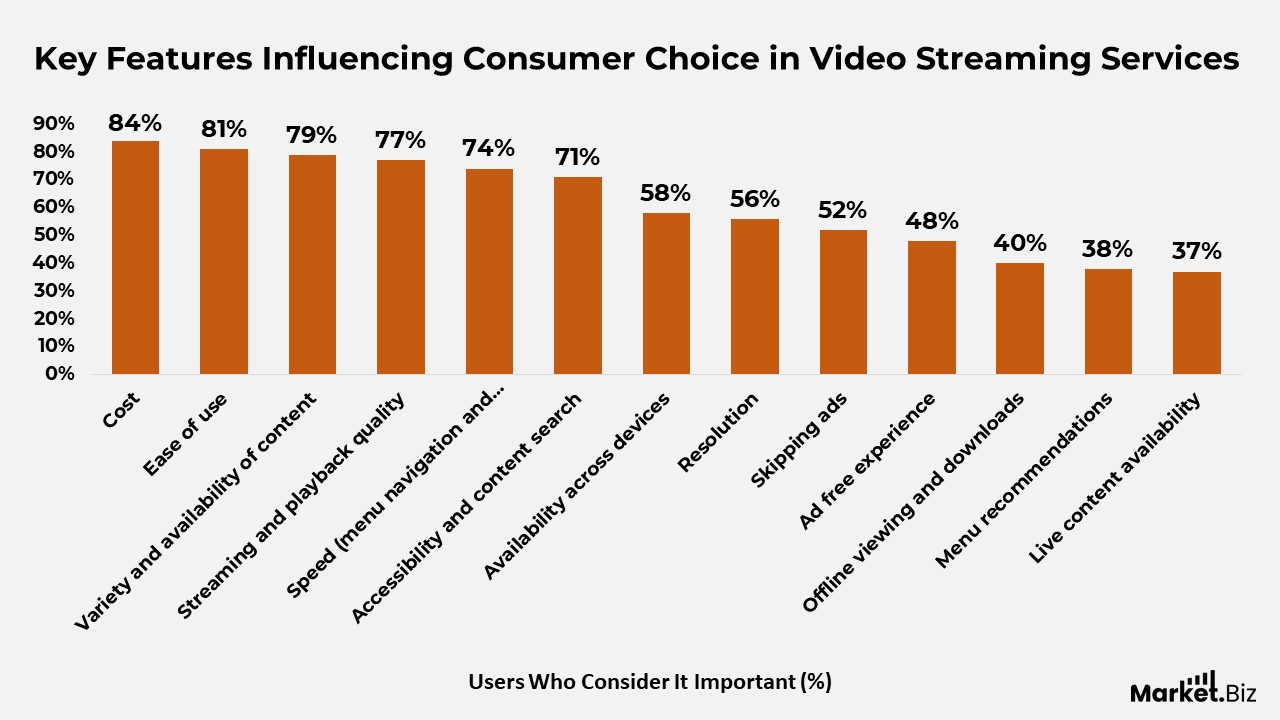
Key Features Influencing Consumer Choice in Video Streaming Services
- Cost remains the most critical consideration for users, with 84% of people rating affordability as an important factor when choosing a video streaming service.
- Ease of use strongly influences adoption, as 81% of users value simple navigation and intuitive platform design.
- Content breadth plays a major role in user satisfaction, with 79% emphasising the importance of a wide variety and consistent availability.
- Viewing experience quality continues to matter, as 77% of users prioritise smooth streaming and reliable playback.
- Platform responsiveness is a key expectation, with 74% of users highlighting fast menu navigation and quick content loading times.
- Discoverability features are increasingly important, as 71% of users want efficient search and easy access to the content they want.
- Cross-device availability influences viewing flexibility, with 58% of users considering access across multiple devices a meaningful feature.
- High resolution viewing remains a priority for 56% of users, reflecting demand for improved visual clarity.
- Ad control features matter to many viewers, with 52% valuing the ability to skip advertisements during playback.
- Fully ad-free experiences are preferred by 48% of users, though they rank below cost and usability considerations.
- Offline viewing capability is important to 40% of users, particularly for mobile and travel-based consumption.
- Personalized menu recommendations influence 38% of users, indicating moderate interest in algorithm-driven content discovery.
- Live content availability is a lower priority overall, yet remains relevant for 37% of users, especially for sports and real-time events.
(Source: Exploding Topics, Grabon)
Leading Global Streaming Platforms by User Base
- Netflix ranks as the largest streaming platform globally, with a user base of 260.28 million, supported by its extensive original content and global reach.
- Amazon Prime Video follows closely, serving approximately 200.0 million users, driven by bundled Prime subscriptions and wide regional availability.
- Disney+ holds a strong position with 150.2 million users, largely fueled by franchise-driven entertainment and family-focused programming.
- Max records around 95.1 million users, reflecting steady demand for premium series, films, and exclusive content.
- Paramount+ reaches 63.4 million users, supported by a growing mix of entertainment, sports, and original programming.
- Hulu maintains a user base of 48.5 million, benefiting from its combination of on-demand content and live TV offerings.
- Peacock serves approximately 28.0 million users, reflecting gradual adoption through tiered pricing and sports content.
- ESPN+ attracts 26.0 million users, driven primarily by live sports streaming and exclusive event coverage.
- Apple TV has 25.0 million users, supported by high-quality original productions and ecosystem integration.
- Starz maintains a niche but stable audience of 15.8 million users, focused on premium series and curated film content.
(Source: Forbesz, Grabon)
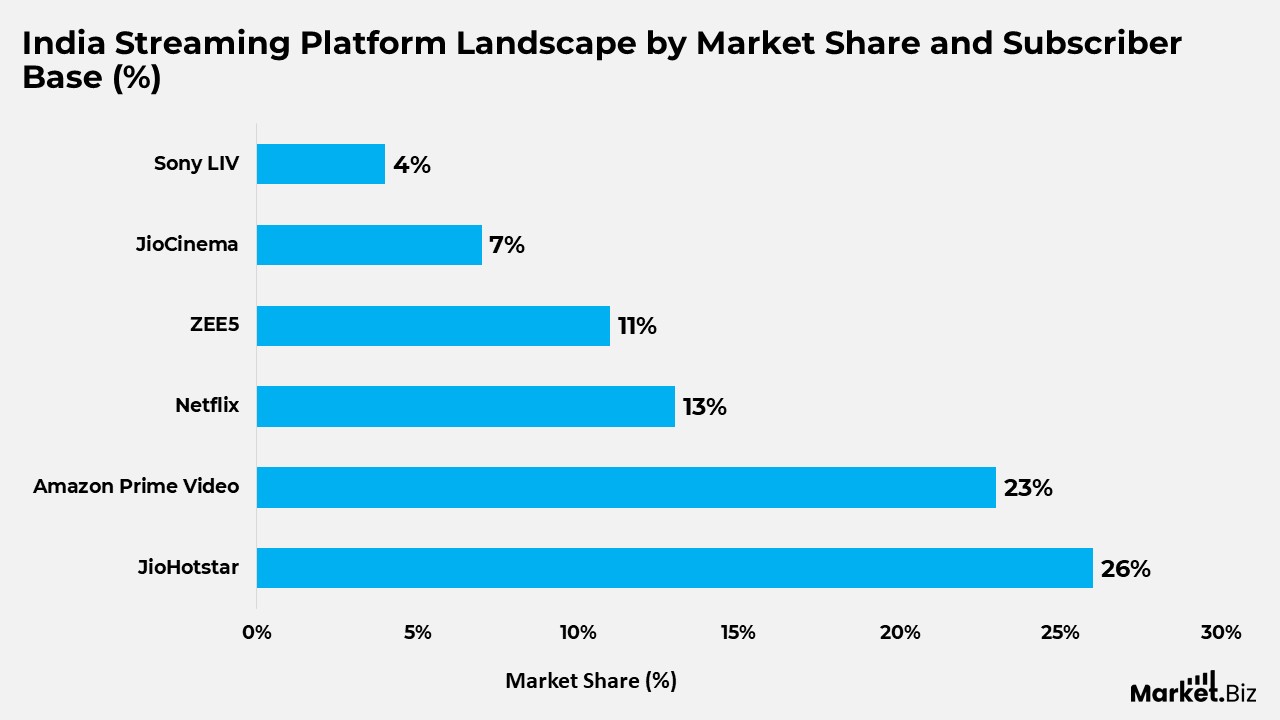
India Streaming Platform Landscape by Market Share and Subscriber Base
- JioHotstar leads the Indian streaming market with a 26% market share and an estimated 38 million subscribers, supported by a strong mix of entertainment and sports content.
- Amazon Prime Video holds the second-largest position, accounting for 23% of the market and around 20 million subscribers, driven by bundled Prime benefits and diverse content offerings.
- Netflix captures a 13% share of the Indian streaming market, with approximately 10 million subscribers, reflecting its premium positioning and original content strategy.
- ZEE5 accounts for 11% of the market, benefiting from its strong regional-language portfolio, although subscriber figures are not publicly disclosed.
- JioCinema accounts for 7% market share, supported by growing adoption through free and ad-supported streaming models, with subscriber data not specified.
- Sony LIV holds around 4% of the market, driven by sports broadcasting and original programming, while detailed subscriber numbers remain undisclosed.
(Source: Reuters, Grabon)
Conclusion
Video streaming statistics reflect a fundamental shift in how audiences consume digital content, supported by wider connectivity, multi-device access, and evolving viewing habits. The continuous rise in subscriber numbers, the growing preference for smart TVs and mobile devices, and higher engagement with short-form, live, and ad-supported formats indicate a well-established and expanding streaming environment.
Advertising trends and user engagement data further highlight improvements in monetisation efficiency and platform maturity. Overall, these insights confirm that video streaming has become a central component of the global media ecosystem, with data-driven analysis increasingly guiding content development, technology investments, and long-term growth strategies.
FAQ’s
Video streaming statistics represent quantitative measures that describe how digital video content is accessed, consumed, and distributed across different platforms, devices, and regions.
These statistics typically include metrics on user adoption, viewing behaviour, content consumption patterns, device usage, service penetration, and revenue-generation models.
They provide insights into viewing frequency, preferred content formats, platform selection, and usage duration, helping explain how and why audiences interact with streaming services.
Video streaming statistics support market assessment by indicating industry scale, growth trends, competitive positioning, and shifts in demand across regions and user segments.
Advancements in internet connectivity, device capabilities, compression technologies, and user interface design directly affect streaming quality, accessibility, and overall adoption levels.