
Introduction
Online Video Platform statistics provide a comprehensive, data-driven overview of how digital video has become a core component of global internet usage, content consumption, and business communication. These statistics track critical indicators such as audience reach, viewing frequency, engagement levels, content formats, and device preferences, illustrating the shift of video from a supporting medium to a dominant digital channel.
They also highlight evolving consumer behaviors, including the rapid growth of mobile viewing, short-form content, live streaming, and personalized video experiences. From a business perspective, the data demonstrates how online video platforms drive brand visibility, customer engagement, lead generation, and commercial outcomes across industries. Overall, Online Video Platform statistics serve as a reliable reference for assessing market maturity, user behavior trends, and long-term growth opportunities within the global digital video ecosystem.
Editor’s Choice
- Video has become a mainstream marketing tool, with approximately 89% of marketers actively incorporating it into their overall marketing strategies.
- Performance outcomes remain strong, with nearly 90% of marketers reporting positive returns on investment from video marketing efforts.
- Short-form content dominates engagement, with about 66% of consumers identifying short videos as the most engaging content format.
- Purchase behaviour is strongly influenced by video, with more than 82% of individuals acknowledging that watching a video affects their buying decisions.
- Websites featuring video content retain visitors longer, with users spending nearly 88% more time compared to sites without video.
- Consumer demand for branded video continues to grow, with nearly 89% of users expressing interest in seeing more branded video content.
- Video accounts for a substantial share of global internet traffic, representing roughly 82.5%.
General Online Video Consumption Statistics
- Online video consumption remains massive, with over 100 million people watching digital video content every day, underscoring video’s role as a primary content medium.
- Video streaming penetration has expanded rapidly, with more than 3 billion global users accessing streamed or downloaded video content at least once per month.
- Video engagement reached near-universal levels, with 92% of internet users consuming online video content in 2023.
- Internet video traffic increased 24% year over year in 2023, driven largely by mobile and social platforms.
- Video now accounts for approximately 65% of total internet traffic, underscoring its dominance over text-based and static media formats.
- Live action remains the most commonly produced video format across digital platforms.
- Video binge behaviour is rising, with 9% of millennials watching 10-20 hours of online video weekly.
- Weekly video consumption continues to increase, with users spending an average of 18 hours per week watching videos online.
- Video viewing accounts for roughly one-third of all online activity, reinforcing its central role in digital engagement.
- Performance quality strongly affects engagement, as 80% of viewers abandon videos that experience buffering or playback delays.
- Information retention improves significantly with video, with users retaining up to 95% of the content when it is presented in this format.
- Personalized video content drives higher engagement, as users are 35% more likely to watch tailored video experiences.
- Video production quality directly influences brand trust: 87% of viewers say it affects their perception of a brand.
Marketing Video Statistics
- Video marketing has become essential, with 98% of marketers considering it a critical component of their overall strategy.
- Purchase influence remains strong, as 82% of consumers report making a buying decision after watching a marketing video.
- Trust building remains a key objective, with 52% of marketers using video to strengthen customer relationships.
- Live-action videos dominate marketing output, accounting for 48%, followed by animated (24%) and screen-recorded (22%) formats.
- Nearly 50% of marketing videos focus on testimonials, reflecting the value of customer-driven storytelling.
- Budget allocation to video remains substantial, with 60% of companies dedicating between 11% and 50% of their marketing spend to video.
- Investment in video marketing continues to rise, with companies increasing video budgets by approximately 25% annually.
- Training content remains a common use case, with 45% of marketers using video for employee education.
- Adoption gaps still exist, as 48% of marketers report not currently using video marketing.
- Customer testimonials remain highly effective, with 39% of marketers actively producing testimonial videos.
Moreover
- Future adoption remains strong, with 68% of marketers who are not currently using video planning planning to adopt it in 2024.
- Skills and budget constraints persist, with 43% citing lack of expertise and 40% citing budget limitations.
- Business adoption is widespread, with 91% of companies actively using video marketing.
- Return on investment satisfaction is high, as 92% of businesses report positive ROI from video campaigns.
- AI adoption is accelerating, with 75% of video marketers using AI tools to assist in video creation.
- In 2024, 85% of marketers plan to increase spending on video marketing.
- Video advertising adoption continues to grow, with 69% of marketers investing in video ads.
- Video marketing delivers higher-quality leads, generating 66% more qualified leads than non-video strategies.
- Approximately 35% of video marketing content is created entirely from scratch.
- Educational content remains important, with 52% of businesses creating videos to educate their audiences.
- Authenticity matters, as 60% of individuals consider user-generated video content the most trustworthy format.
Social Media Video Statistics
- Video content on social platforms is shared 12 times more often than text and image content combined.
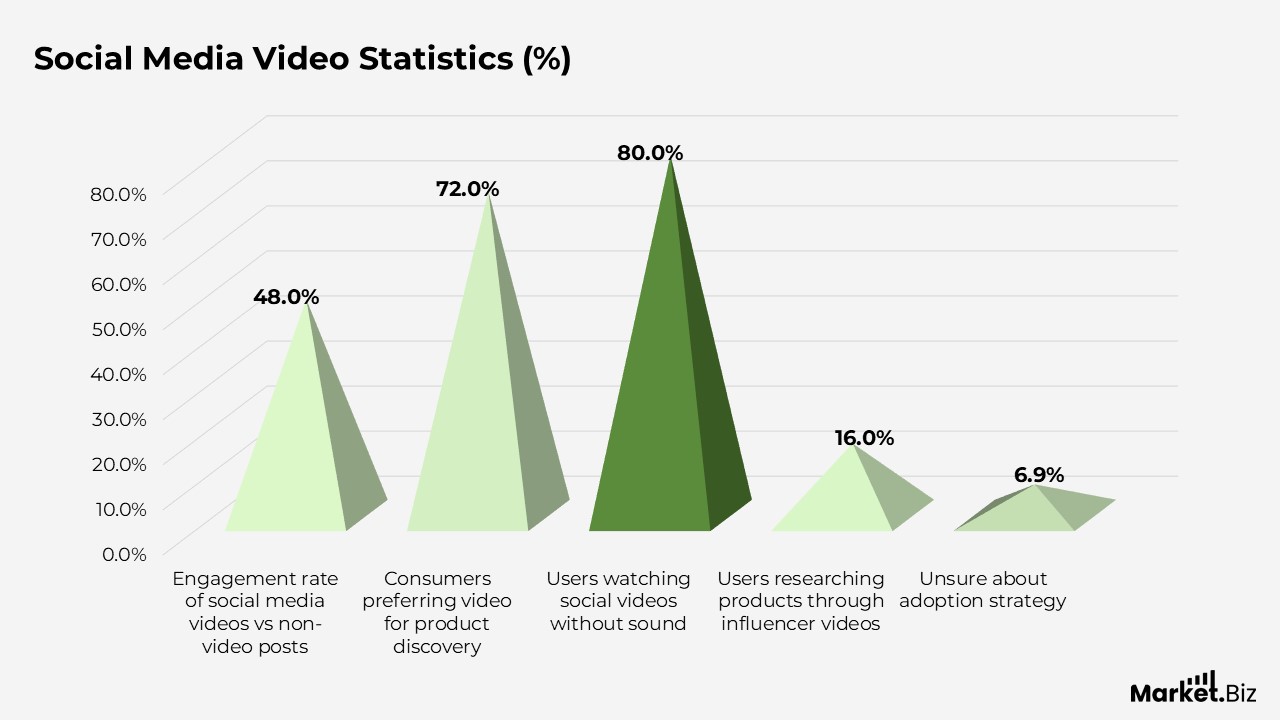
- Videos posted on social media receive 48% higher engagement than non-video posts.
- Product discovery increasingly favours video: 72% of consumers prefer it when learning about products.
- Sound-off viewing is common: 80% of users watch social videos without audio.
- Influencer content influences purchasing research, with 16% of users watching influencer videos to evaluate products.
YouTube Video Statistics
- YouTube records massive daily engagement, with over 1 billion hours of video watched every day.
- Mobile dominates viewing behaviour, with 70% of YouTube videos watched on smartphones.
- YouTube strongly influences purchasing behavior, with 70% of viewers purchasing a product after seeing it featured on the platform.
- YouTube remains the preferred video platform for 65% of users.
- Users are three times more likely to watch video tutorials on YouTube than to read text-based instructions.
- Over 90% of users discover new brands while watching YouTube videos.
TikTok Video Statistics
- TikTok maintains the highest engagement rates among social platforms, averaging 4.25% per post.
- User interaction is strong, with 92% of viewers taking action after watching TikTok content.
- TikTok advertising costs remain approximately 30% lower than those on competing platforms.
Live Streaming Video Statistics
- Live video demand continues to rise, with 45% of users expressing a desire for more live content on social platforms.
- Global interest in live branded video consumption stands at 52%.
- Only 36% of marketers currently use live streaming, indicating untapped potential.
- Just 14% of marketers consider live video their most important format.
- One third of online users consume more live streams than any other video type each week.
- Younger creators monetise live content more effectively, with 50% of streamers aged 18–34 generating income, compared to 10% among those aged 55 and above.
Mobile Video Statistics
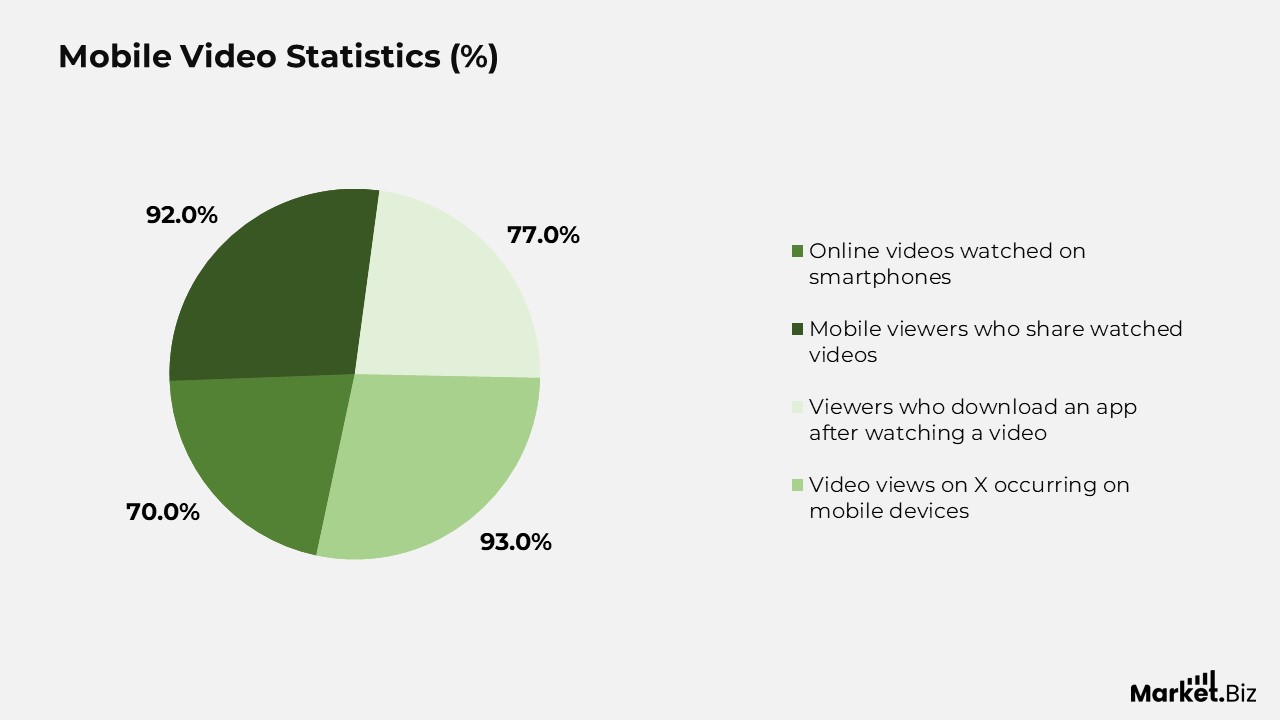
- Mobile remains the primary viewing device, with 70% of online videos watched on smartphones.
- Video sharing behaviour is strongest on mobile, with 92% of viewers sharing videos watched on mobile devices.
- App discovery through video is highly effective, as 77% of viewers download an app after watching a related video.
- Nearly 93% of video views on X occur on mobile devices.
Short Form and Long Form Video Statistics
- Videos under 90 seconds achieve a 50% viewer retention rate.
- Short-form video is preferred by 44% of users when watching explainer or product videos.
- 75% of users watch short-form video content on mobile devices.
- YouTube Shorts and long-form YouTube videos serve as major discovery channels, with 61% and 56% of users using them, respectively.
- Short-form platforms are dominated by younger users, with 76% aged 18–24.
- YouTube attracts diverse age groups, including 24% aged 19–25 and 17% aged 30–39.
- Over 53% of Gen Z users regularly watch long-form video content.
- 83% of marketers state that short videos should be under 60 seconds.
- When researching products, 44% of consumers prefer short or explainer videos over longer formats.
(Sources: Deloitte Digital Media Trends, Cisco Annual Internet Report, GlobalWebIndex, Sandvine Global Internet Phenomena Report, DataReportal, HubSpot, Content Marketing Institute, Gartner, Adobe Digital Trends, PwC, Meta, Google, Think with Google, Ericsson Mobility Report, eMarketer, We Are Social)
Most Commonly Used Video Types in Marketing Strategies
- Testimonial videos lead video marketing usage, with 39% of marketers relying on customer stories to build credibility and trust.
- Explainer videos are closely followed, with 38% of marketers using them to simplify products, services, or concepts for their audiences.
- Social media videos remain a core format, adopted by 34% of marketers to drive engagement across digital platforms.
- Presentation-style videos are equally popular, with 34% of marketers using them for structured brand or product communication.
- Product and demo videos are used by 32% of marketers to highlight features, use cases, and functionality.
- Sales-focused videos are used by 30% of marketers to support conversion-driven campaigns.
- Teaser videos also account for 30% and are commonly used to generate anticipation around launches or announcements.
- 30% of marketers produce video advertisements, reinforcing video’s role in paid digital campaigns.
- Customer service videos support post-purchase engagement, with 28% of marketers using them for support and guidance.
- Videographics appeal to visual learners and are adopted by 25% of marketers to present data-driven stories.
- Employee onboarding videos are used by 25% of organizations to standardize internal training processes.
- Customer onboarding videos account for 22% and help new users quickly understand products or services.
- 22% of marketers also use staff training videos to enhance workforce skills and consistency.
- App demo videos also account for 22%, reflecting growing demand for mobile- and software-focused walkthroughs.
(Sources: Deloitte Digital Media Trends, DemandSage, Statista)
Video Engagement Rates by Content Duration
- Very short videos deliver the highest engagement; those lasting less than 1 minute achieve a 50% engagement rate.
- Short-form content between 1 and 3 minutes maintains strong viewer interest, recording an engagement rate of 48%.
- Mid-length videos of 3 to 5 minutes continue to perform well, with 47% viewer engagement.
- Longer content spanning 5 to 30 minutes sees a noticeable drop in engagement, declining to 39%.
- Extended videos lasting 30 to 60 minutes experience a further reduction in engagement, with rates falling to 26%.
- Long-form videos exceeding 60 minutes record the lowest engagement levels, capturing just 17% viewer engagement.
(Sources: Deloitte Digital Media Trends, DemandSage, Statista)
Global Share of Internet Users Watching Online Video Content by Country
- Saudi Arabia leads global online video consumption, with 95% of internet users watching video.
- Turkey has the highest adoption rate, with 95% of its internet users regularly consuming online video.
- China follows closely, with 92% of internet users engaging with online video platforms.
- New Zealand records strong video penetration, with 91% of users watching online video content.
- Mexico and Australia show similar adoption patterns, with 88% of internet users consuming online video in each country.
- The Philippines demonstrates high engagement, with 87% of internet users watching video content online.
- Spain continues to show strong usage levels, with 86% of internet users engaging with online video.
- India, Brazil, and the United States report comparable adoption, each with approximately 85% of internet users watching online video content.
(Sources: Scope Weekly, Statista)
Conclusion
The online video platform statistics highlight the growing dominance of video as a core component of the global digital environment. Widespread adoption across countries, strong viewer engagement with short, mobile-friendly formats, and video’s expanding share of total internet traffic reflect a fundamental shift in how audiences consume content.
These trends demonstrate that video has moved beyond a supplementary medium to become a primary channel for information, entertainment, and interaction across digital platforms. From a commercial and strategic standpoint, the data confirms the increasing importance of online video platforms for businesses and marketers.
High levels of adoption, consistently positive performance outcomes, and rising investment across multiple video formats signal sustained confidence in video-led engagement strategies. Taken together, the statistics suggest that online video platforms will remain central to digital communication and content delivery, continuing to drive innovation, audience connection, and long-term growth in the digital ecosystem.
FAQ’s
Online video platform statistics show that video has become one of the most consumed digital content formats worldwide. High viewing rates, longer time spent on video-enabled websites, and strong engagement with short-form and mobile content highlight shifting user preferences toward visually rich, on-demand experiences.
Short-form videos consistently deliver the strongest engagement, especially those under 1 minute. Explainer videos, testimonials, social media videos, and live streams also perform well, depending on audience intent and platform usage.
Online video platforms play a critical role in digital marketing strategies. Most marketers actively use video, report positive ROI, and continue to increase video-related budgets due to its effectiveness in building brand awareness, driving engagement, and influencing purchase decisions.
Several regions report exceptionally high online video usage, with countries such as Saudi Arabia, Turkey, China, and New Zealand showing very high shares of internet users watching online video content, reflecting global adoption rather than region-specific growth.