
Introduction
Cyber Security vulnerability statistics offer a quantitative snapshot of security gaps across networks, software, cloud environments, and connected systems that attackers commonly exploit to breach defences, disrupt services, or access sensitive data. With the rapid growth of cloud computing, remote work models, IoT adoption, and digital transformation, the volume and complexity of vulnerabilities have expanded significantly, thereby elevating organizational risk.
These statistics track the prevalence, severity, and nature of vulnerabilities, including trends such as zero-day threats, configuration errors, and delayed patching, and measure response and remediation timelines.
By revealing industry-, regional-, and technology-specific differences, cybersecurity vulnerability statistics help organisations prioritise critical risks, optimise security investments, strengthen vulnerability management programs, and make informed decisions in an increasingly digital and interconnected threat landscape.
Editor’s Choice
- Nearly 47% of small businesses in the US experienced at least one cyberattack between 2021 and 2022, highlighting the heightened exposure of smaller organizations to digital threats.
- Security databases recorded approximately 23,964 distinct cybersecurity vulnerabilities in 2022, reflecting the expanding attack surface across software and systems.
- Zero-day exploits accounted for more than 4 in 10 cyberattacks in 2021, underscoring the growing use of previously unknown vulnerabilities by threat actors.
- About 69% of security professionals surveyed in 2021 reported that organisations lacked sufficient urgency in addressing and remediating known vulnerabilities.
- In 2021, nearly 50% of all websites had at least one exploitable security weakness, indicating widespread gaps in web application security.
- The most severe and impactful vulnerability incident of 2021 was linked to CVE-2021-44228, which exposed millions of systems worldwide to critical exploitation risks.
- Phishing resilience remained a challenge in the banking sector, with 25.4% of small bank employees in 2021 likely to fail a simulated phishing test, increasing organizational exposure to social engineering attacks.
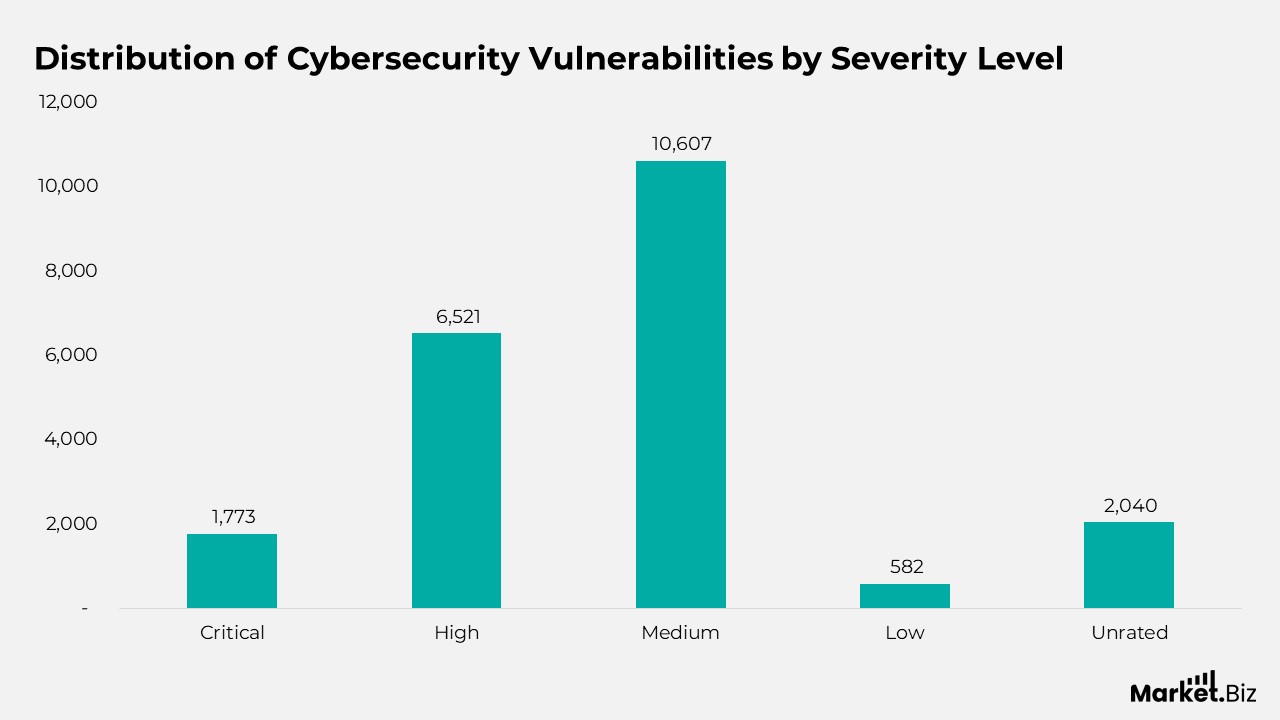
Distribution of Cybersecurity Vulnerabilities by Severity Level
- A total of 1,773 vulnerabilities were classified as critical, representing the most severe risks requiring immediate remediation.
- 6,521 vulnerabilities were rated as high severity, indicating significant exposure if left unpatched.
- The majority of identified issues fell into the medium-severity category, totalling 10,607 reported cases.
- Lower risk vulnerabilities accounted for 582 cases, reflecting limited but still relevant security concerns.
- An additional 2,040 vulnerabilities remained unrated, creating uncertainty in prioritization and response planning.
- Overall, more than 38% of all reported vulnerabilities were categorised as critical or high severity, underscoring the urgent need for rapid risk assessment and mitigation.
(Source: ZeroThreat)
Monthly Trend of Reported Cyber Security Vulnerability by Severity Statistics
- In January 2025, a total of 4,278 vulnerabilities were recorded, including 304 critical, 1,300 high, 2,024 medium, 80 low, and 570 unrated issues.
- In February 2025, 3,677 vulnerabilities were reported, with 270 classified as critical, 1,087 as high, 1,791 as medium, 119 as low, and 410 as unrated.
- During March 2025, vulnerability disclosures increased to 4,015, comprising 403 critical, 1,331 high, 1,966 medium, 111 low, and 204 unrated cases.
- In April 2025, the total count reached 4,036, with 341 critical vulnerabilities, 1,355 high-severity issues, 1,886 medium, 121 low, and 333 unrated entries.
- In May 2025, 3,984 vulnerabilities were reported overall, including 366 critical, 1,013 high, 1,987 medium, 117 low, and 501 unrated, reflecting continued pressure on vulnerability management teams.
(Source: ZeroThreat)
Industry-Wise Cybersecurity Vulnerability Exposure
- Software development emerged as the most exposed sector in 2025, recording 6,432 vulnerabilities and accounting for 22.4% of the total, largely driven by rapid release cycles, open-source dependencies, and cloud-native development practices.
- Networking and telecommunications followed with 4,876 reported vulnerabilities, representing 17.0%, reflecting persistent risks across network infrastructure and communication protocols.
- Consumer electronics accounted for 3,201 vulnerabilities, or 11.1% of total cases, as connected devices and firmware complexity continued to expand.
- The healthcare sector reported 2,894 vulnerabilities, or 10.1% of the total, with a notable 14.6% increase from 2024, raising concerns about patient data protection and medical device security.
- Industrial control systems recorded 2,108 vulnerabilities, accounting for 7.3%, highlighting ongoing risks to critical infrastructure and operational technology environments.
- Financial services experienced 1,987 vulnerabilities, making up 6.9%, driven by complex digital platforms and high-value attack incentives.
- Government systems accounted for 1,652 vulnerabilities, or 5.8%, reflecting challenges in securing legacy infrastructure alongside modern digital services.
- The automotive sector logged 1,432 vulnerabilities, representing 5.0%, as software-defined vehicles and connected systems increased exposure.
- Educational institutions reported 1,243 vulnerabilities, or 4.3%, largely due to limited security resources and the widespread use of third-party platforms.
- Retail and e-commerce platforms recorded 1,119 vulnerabilities, accounting for 3.9%, driven by payment systems, customer data exposure, and high transaction volumes.
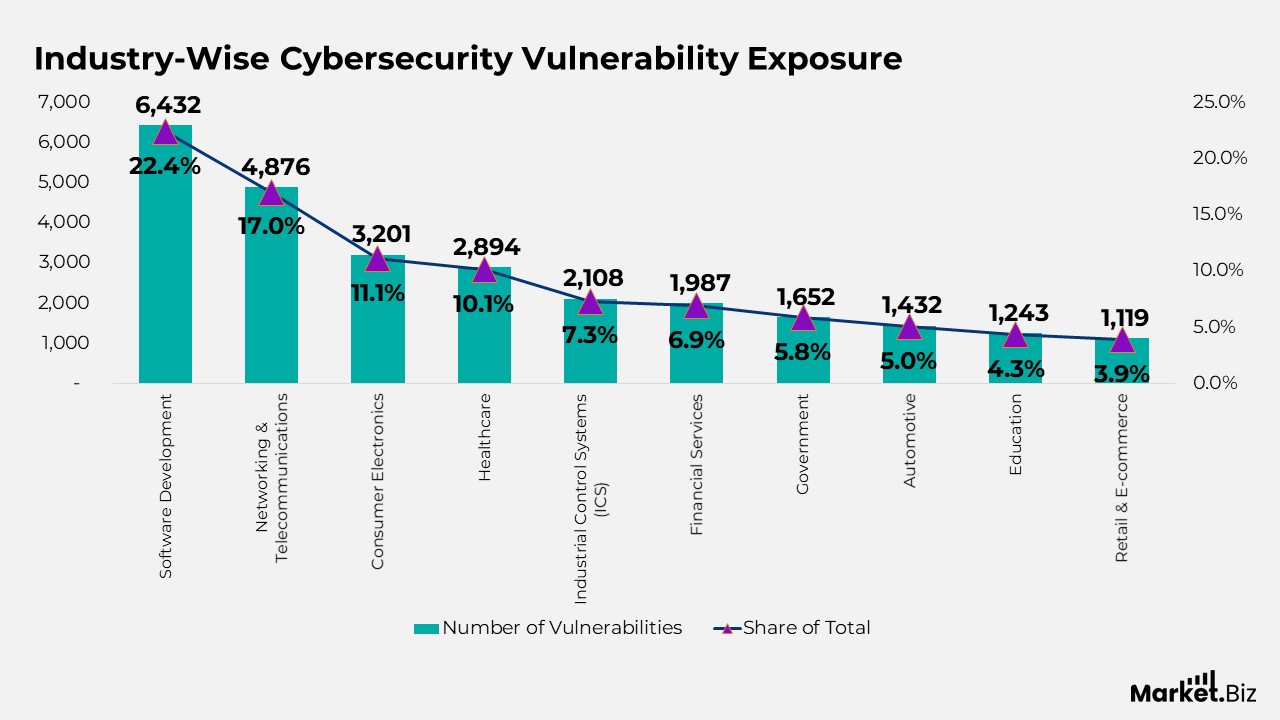
(Source: ZeroThreat)
Open-Source Software Libraries Most Exposed to Vulnerabilities
- Supply chain attacks targeting open-source software increased by 22% in 2025, driven by malicious npm packages and compromised PyPI modules embedded in development pipelines.
- OpenSSL emerged as the most vulnerable OSS library with 214 reported issues and a high criticality index due to its central role in encryption and security.
- jQuery recorded 189 vulnerabilities with medium criticality, reflecting continued reliance on older versions across web applications.
- Apache Struts reported 178 vulnerabilities and maintained a high criticality level, continuing its history of severe exploit exposure.
- FFmpeg logged 167 vulnerabilities at medium criticality, largely due to complex media processing code.
- The Linux kernel accounted for 156 vulnerabilities and was rated high in criticality, highlighting risks within core operating system components.
- TensorFlow reported 143 medium- to high-criticality vulnerabilities as AI frameworks see rapid enterprise adoption.
- WordPress plugins registered 139 vulnerabilities at medium criticality, driven by fragmented plugin ecosystems and inconsistent maintenance.
- Python packages (PyPI) recorded 132 vulnerabilities, while Node.js modules reported 128, both rated medium due to extensive use of third-party dependencies.
- The Android SDK logged 121 vulnerabilities with a high criticality index, underscoring risks in mobile application development environments.
(Source: ZeroThreat)
Countries Contributing the Highest Share of Vulnerable Code
- The United States ranked highest, contributing 9,321 vulnerabilities and accounting for 32.4% of the global total.
- China followed with 4,209 vulnerabilities, representing 14.6%, reflecting large-scale software development activity.
- Germany recorded 2,104 vulnerabilities (7.3%), while India reported 1,987 (6.9%) and Japan 1,762 (6.1%).
- South Korea contributed 1,432 vulnerabilities (5.0%), highlighting the growing volume of software production and exposure.
- Canada accounted for 1,223 vulnerabilities (4.3%), followed by the United Kingdom with 1,112 (3.9%).
- Russia logged 987 vulnerabilities (3.4%), while other countries collectively logged 1,796 vulnerabilities (6.1%), reinforcing the global and distributed nature of cybersecurity risk.
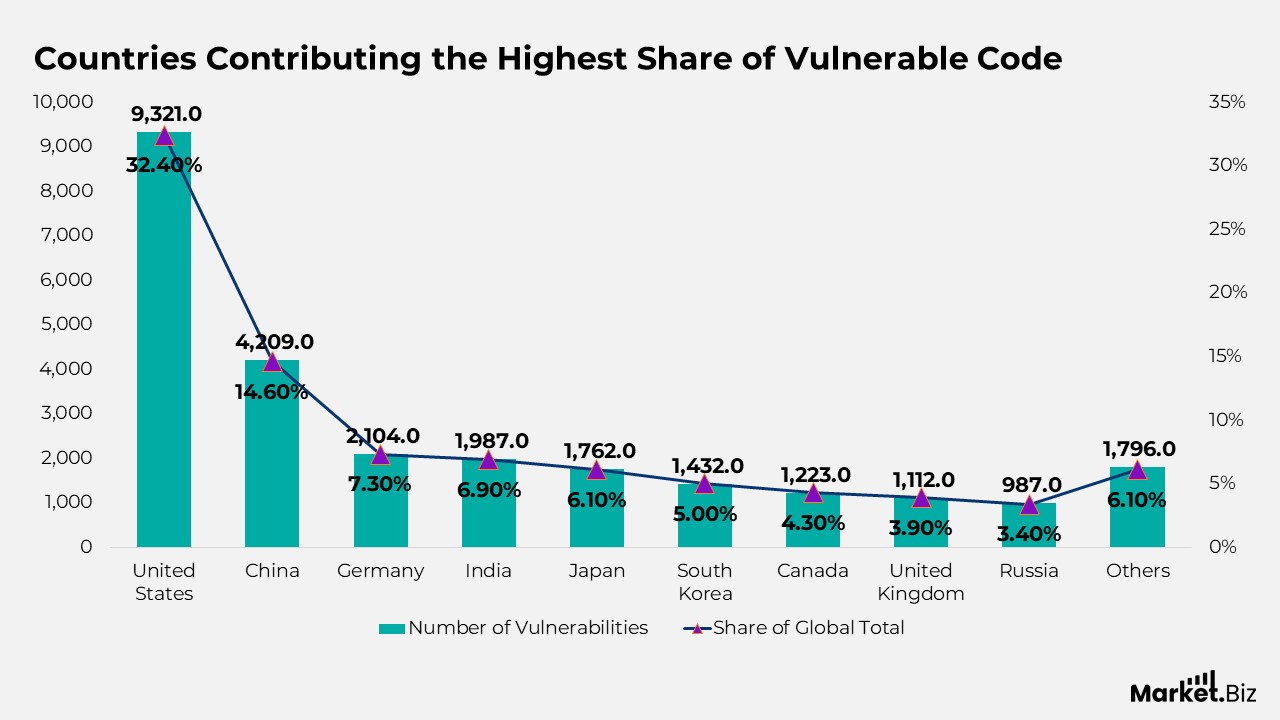
(Source: ZeroThreat)
Vulnerability Detection Gaps and Severity Trends Across Organizations
- A 2020 World Economic Forum report identified a vulnerability detection rate of just 0.05% in the US, revealing a major shortfall in proactive threat discovery.
- Small businesses remain disproportionately targeted: 43% of cyberattacks target SMEs, while only 14% are sufficiently prepared to defend against them.
- Organisations with fewer than 100 employees typically report fewer critical or high-severity vulnerabilities, largely because their IT environments are simpler and less complex.
- Large enterprises with more than 10,000 employees face the highest concentration of critical vulnerabilities, reflecting increased infrastructure complexity and wider attack surfaces.
- On average, 4.6% of web application vulnerabilities are rated critical and 4.4% high severity, indicating persistent exposure in internet-facing systems.
- Applications handling payment card data show elevated risk, with 8% of vulnerabilities classified as critical due to their direct financial impact.
- Across the full technology stack, more than 33% of identified vulnerabilities fall into critical or high-severity categories, highlighting systemic risk from infrastructure applications.
Moreover
- SQL Injection (CWE-89) remains the most common critical web application flaw, continuing its long-standing dominance since 2022.
- High- and critical-severity vulnerabilities in applications and APIs take an average of 74.3 days to remediate, while device and network issues take an average of 54.8 days, indicating slower response times for application-layer risks.
- A record 40,009 CVEs were published in 2024, underscoring the growing complexity of modern software and hardware ecosystems.
- By the end of 2024, the CISA Known Exploited Vulnerabilities catalogue listed 1,238 entries, including 185 newly added during the year.
- 768 vulnerabilities were reported as exploited in the wild for the first time in 2024, representing 2% of all disclosed vulnerabilities and a 20% increase from 2023.
- Research indicates that 80% of organizations fail to remediate newly identified vulnerabilities within 18 months of initial discovery.
- Vulnerabilities tend to persist longer in aging software, where patch frequency declines and long-term maintenance is often deprioritized.
- Approximately 70% of applications still contain at least one known vulnerability even after five years in production.
- In 2022, 19% of scanned software contained high or critical vulnerabilities, reflecting ongoing challenges in managing legacy codebases.
(Source: ZeroThreat)
Critical Application Security and Threat Exposure Insights
- About 76% of applications contain at least one known vulnerability, highlighting widespread gaps in secure development and testing practices.
- Nearly 1 in 5 organizations still do not perform regular security testing on their software, leaving systems exposed to avoidable risks.
- Roughly 80% of public exploits become available before their associated CVEs are officially published, giving attackers a significant early advantage.
- An estimated 80% of cyberattacks continue to exploit vulnerabilities that are three years old or older, demonstrating the long lifespan of unpatched flaws.
- Around 84% of organizations have high-risk vulnerabilities exposed on their network perimeter, making initial compromise easier for attackers.
- Modern threat actors increasingly rely on unknown weaknesses, with 69% of contemporary malware designed to exploit zero-day vulnerabilities, outpacing traditional defensive controls.
(Source: ZeroThreat)
Organizational Gaps, Security Readiness, and Major Vulnerability Events
- In 2021, around 69% of security professionals reported a lack of urgency within organisations when it came to remediating known vulnerabilities, slowing overall risk-reduction efforts.
- About 63% of teams experienced the same vulnerabilities resurfacing in subsequent software releases, largely attributed to shortages in skilled development talent.
- Nearly 96% of security teams indicated delays in fixing critical vulnerabilities due to weak collaboration with development teams.
- From the developer perspective, 80% stated that insufficient coordination with security teams negatively affected overall code quality and security outcomes.
- Between Q4 2021 and early 2022, approximately 82% of UK businesses had up-to-date anti-malware protection in place, showing strong baseline defence adoption.
- Despite this, only 38% had formal vulnerability patch management policies, 34% used security monitoring tools, 17% conducted cybersecurity vulnerability audits, and just 13% leveraged threat intelligence, revealing gaps in advanced security practices.
- In 2022, about 20% of surveyed organizations reported having no Zero Trust strategy, while 30% stated they had already implemented a functional Zero Trust model.
- Web security exposure remained widespread, as 50% of websites in 2021 were found to contain at least one exploitable vulnerability.
- Malicious web application requests surged by 88% in 2021, more than doubling from the previous year and signalling escalating attack activity.
- The most severe vulnerability incident of 2021 was CVE-2021-44228, which impacted the Apache Log4j open-source logging library on 10 December 2021, triggering global emergency patching efforts.
(Source: ZeroThreat, VpnAlert. Com)
Cyber Security Vulnerability Patterns by Attack Type and Exploitation Method Statistics
- Global DDoS activity was projected to surge in 2023, with attacks expected to reach approximately 15.4 million, nearly doubling from 7.9 million recorded in 2018, highlighting the escalating threat of disruption.
- Supply chain attacks in 2021 were primarily data-driven, with about 58% aimed at accessing sensitive customer information, intellectual property, or proprietary data.
- In addition, 16% of supply chain attacks focused on gaining access to individuals, while 8% targeted financial assets, underscoring the varied motivations of attackers.
- More than 4 in 10 cyberattacks in 2021 exploited zero-day vulnerabilities, reflecting a growing reliance on previously unknown weaknesses.
- Zero-day malware activity increased by 3%, reaching 67.2% in Q3 2021, while the total number of zero-day attacks climbed to 83, marking a 55% rise compared to 2020.
- Server security misconfigurations emerged as the most common vulnerability type in 2021, accounting for 38% of all identified cybersecurity weaknesses.
- Other frequently exploited vulnerabilities included cross-site scripting (13%), broken access control (11%), sensitive data exposure (10%), and authentication and session flaws (8%).
- In the healthcare sector, network server breaches accounted for 56.6% of data breaches in 2022, far outweighing other vectors.
- Email-based attacks accounted for 22.9% of healthcare breaches, while electronic medical record systems contributed 11.7%, highlighting multiple points of exposure.
- Human-related factors played a critical role in 82% of data breaches in 2021, underscoring the impact of user behaviour, social engineering, and procedural gaps on the overall security posture.
(Source: ZeroThreat, VpnAlert. Com)
Conclusion
Cybersecurity vulnerability statistics reveal a steadily expanding risk landscape, marked by a rising number of weaknesses across software, cloud environments, networks, and connected systems. The data indicates that vulnerabilities are becoming both more numerous and more severe, with a large portion falling into critical and high-risk categories that require rapid response.
Increased exposure within open-source ecosystems, cloud-native applications, and sectors such as healthcare, finance, and industrial systems highlights how deeply security gaps are woven into today’s digital foundations.
These statistics also point to persistent challenges in vulnerability management, including slow remediation cycles, inconsistent security practices across industries, and the growing exploitation of zero-day and supply-chain flaws.
Together, these insights underscore the importance of continuous vulnerability monitoring, proactive risk prioritization, and closer coordination among development teams, security professionals, and regulators. Ultimately, cybersecurity vulnerability statistics make it clear that effective risk reduction depends not only on advanced defensive technologies but also on strong governance, timely patching, and sustained organizational commitment to security.
FAQ’s
Cybersecurity vulnerability statistics are data points that measure the volume, categories, severity, and evolving patterns of security weaknesses across applications, networks, cloud platforms, and connected devices, enabling organisations to assess their overall cyber risk posture.
These statistics provide insight into where security gaps exist, helping organisations prioritise remediation, strengthen patching programs, optimise security spending, and reduce the likelihood of breaches and cyber incidents.
The most commonly reported vulnerabilities include application and software defects, configuration errors, outdated or unsupported components, weaknesses in open-source dependencies, authentication flaws, and zero-day vulnerabilities.
Severity classifications such as critical, high, medium, and low guide security teams in determining urgency, ensuring that the most dangerous vulnerabilities are addressed first. At the same time, lower-risk issues are managed through planned updates.
Open-source software plays a major role in vulnerability statistics due to its widespread adoption, shared dependencies, and frequent updates, underscoring the importance of supply chain visibility and dependency management for vulnerability mitigation.