
Introduction
Data Center Server Statistics provide a clear view into how modern digital infrastructure supports cloud computing, enterprise IT operations, and data-driven business models worldwide. As organizations generate and process growing volumes of data, servers remain the core engines powering applications, storage, networking, and virtualization across hyperscale, colocation, and on-premises data centres.
These statistics capture trends in server deployment, performance density, energy efficiency, workload optimization, and hardware refresh cycles, reflecting how enterprises balance scalability, reliability, and cost control.
By examining Data Centre Server Statistics, technology leaders and analysts can better understand infrastructure demand patterns, the adoption of advanced architectures, such as AI-optimized and edge servers, and the evolving role of data centres in supporting digital transformation initiatives across industries.
Editor’s Choice
- Data centres collectively consume close to 1% of global electricity, underscoring their growing role in worldwide energy demand.
- The global data center footprint now exceeds 8 million facilities, spanning enterprise, colocation, hyperscale, and edge deployments.
- A typical large-scale data center operates within a power range of approximately 100 to 200 megawatts.
- Cooling systems account for nearly 60% of total energy consumption in most data centre environments.
- Hyperscale facilities account for only about 25% of overall data centre capacity yet consume more than 50% of total sector power.
- Global data volumes are expected to expand rapidly, reaching around 175 zettabytes by 2025.
- Cloud-based data centers recorded strong expansion, growing at an estimated compound annual rate of 16% between 2018 and 2023.
- The United States accounts for roughly 38% of the world’s data centre workloads, underscoring its infrastructure dominance.
- The operational lifespan of most data centres typically spans 10 to 15 years before major upgrades or replacements are necessary.
- Energy efficiency across data center operations has improved by nearly 40% over the past 10 years through better hardware, cooling, and power management.
- The share of renewable energy used by data centers is expected to rise to approximately 65% by 2030. Driven by sustainability commitments and regulatory pressure.
Global Data Center Landscape and Infrastructure Statistics
- As of March 2024, the global data centre footprint stood at approximately 11,800 facilities.
- By March 2025, the United States led the world with 5,426 data centres. Followed by Germany with 529 and the United Kingdom with 523.
- China hosted 449 data centres, while France, Australia, and the Netherlands each operated more than 290.
- Emerging European markets such as Poland, Spain, and Switzerland each supported over 120 operational data centers.
- Asia-Pacific markets, including Japan, Singapore, Indonesia, South Korea, and New Zealand, continued to expand steadily.
- Global data centre electricity consumption reached 7.4 gigawatts in 2023, up sharply from 4.9 gigawatts in 2022.
- In the US, data center power demand rose from about 19 GW in 2023 to nearly 21 GW in 2024 and is projected to approach 35 GW by 2030.
- Cloud computing energy usage is increasing annually at a rate ranging from 10% to 30%.
- Electricity consumed by data centers globally is sufficient to power over 6,482,400 average US households.
- Data centers contribute between 1% and 5% of global greenhouse gas emissions.
- Global data center carbon emissions are expected to reach around 2.5 billion metric tons by 2030.
- Hyperscale data centers currently represent the largest facility type, accounting for over 35% of total market share.
Moreover
- Hyperscale projects under construction cover more than 921,000 square meters and nearly 2,000 MW of installed power.
- Northern Virginia, Beijing, London, Singapore, Tokyo, and Frankfurt rank among the world’s largest data center markets by total power capacity.
- The global colocation data centre market continues to expand at a steady compound annual growth rate of over 6%.
- Cloud service provider-operated data centers are expected to register the fastest growth through 2030.
- The edge data centre market is rapidly expanding, growing from $7.2 billion in 2021 to $19.1 billion in 2026.
- The media and entertainment industries account for 35% of global data centre consumption.
- Hyperscale operators such as Amazon, Microsoft, Google, Meta, Alibaba, and Tencent dominate large-scale deployments.
- The average data center size worldwide is approximately 100,000 square meters.
- China hosts the world’s largest single data centre, spanning more than 10.7 million square feet.
- The largest data centre campus in the world is located in Iowa, representing a $5 billion infrastructure investment.
- Leading providers such as Equinix, Digital Realty, and NTT collectively control over 30% of global data centre capacity.
- IBM Cloud operates around 60 data centres across 19 countries in North America, Europe, South America, and Asia-Pacific.
- Solution offerings dominate the data centre market, accounting for more than 77.9% of total spending.
(Sources: Visual Capitalist, Statista, Cushman Wakefield, Nvidia News, ResearchGate, Digital Realty, Carbon Collective, Channel News Asia, Data Center Dynamics, CBRE, Oilprice.com, TechJury, Yahoo, IBM, Astute Analytica, Edu Dwar, Data Center Frontier)
Data Center Energy, Infrastructure, and Network Evolution Statistics
- In September 2024, Microsoft announced a long-term plan to source 100% of its electricity from the reopened Three Mile Island nuclear power plant for 20 years to support AI-driven data centre operations.
- Tahoe Reno 1, operated by Switch, is the world’s largest colocation data centre, spanning 1.3 million square feet and supporting up to 130 MW of power capacity.
- Switch’s Citadel Campus in Las Vegas covers 7,750,015 square feet. Ranking as the third-largest data center globally and the largest facility located outside China.
- Data centers currently account for approximately 4% of global energy consumption and contribute about 1% of worldwide greenhouse gas emissions.
- Cloud-based data centres alone consume nearly 3% of global energy.
- Global data center construction activity peaked in 2023, with 3,077.8 megawatts of new capacity under development, reflecting a 46% year-over-year increase.
- Average server rack density across most facilities remains below 8 kW, and the majority of data centers are not yet equipped to handle rack densities exceeding 30 kW.
- High-speed networking continues to accelerate, with 200/400 Gb ports projected to increase their share of network energy consumption from 6% to 26%.
- In contrast, sub-50 Gb ports are expected to decline sharply. Accounting for less than 2% of the total network energy share.
(Sources: Reuters, Switch, Ranked.com, Engie, Exploding Topics, CBRE, Uptime Intelligence, Lawrence Berkeley National Laboratory)
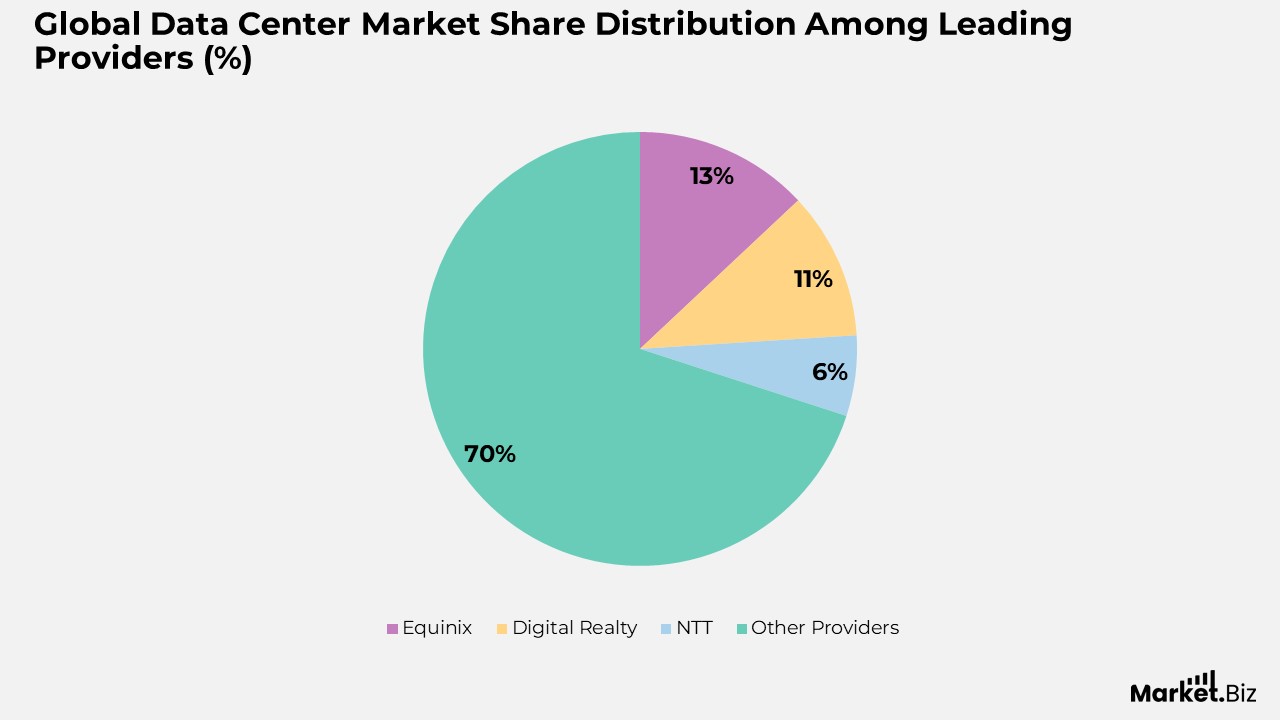
Global Data Center Market Share Distribution Among Leading Providers
- Equinix holds the largest position in the global data centre market, accounting for approximately 13% of the market.
- Digital Realty ranks as the second-largest provider, accounting for around 11% of the global data centre landscape.
- NTT follows with about 6% market share, supported by its strong presence in Asia and its enterprise-focused facilities.
- A significant 70% of the global data center market remains fragmented, distributed across numerous regional, local, and specialized providers.
- This fragmented structure highlights the competitive nature of the market, where no single operator dominates a majority share.
- The strong presence of smaller and regional players reflects rising demand for localized data centers, edge facilities, and industry-specific infrastructure solutions.
(Sources: Brightlio, Statista)
AI-Driven Data Center Investment and Capacity Expansion Trends
- Global investment dedicated specifically to AI-focused data centers reached approximately $57 billion in 2024, reflecting accelerating demand for AI infrastructure.
- Cumulative spending on AI-related data center upgrades is projected to approach $1 trillion, largely driven by hyperscalers such as Amazon, Microsoft, Google, and Meta.
- By 2030, total AI data centre investment could reach nearly $5.2 trillion, requiring approximately 156 GW of dedicated AI computing capacity worldwide.
- The US government has committed $500 billion through the Stargate initiative to strengthen domestic AI infrastructure and reinforce AI’s strategic economic role.
- In July 2025, Meta announced projected capital spending between $64 billion and $72 billion to support multi-gigawatt AI supercluster deployments.
- Power requirements for advanced AI training facilities can exceed 1 gigawatt. Equivalent to the annual electricity consumption of roughly 800,000 US households.
- Advances in semiconductor technology are driving rack densities higher, with 5-nanometer GPUs enabling up to 130 kW per rack and 2-nanometer chips reaching up to 250 kW.
Moreover
- Around 20% of global data center capacity is already dedicated to AI workloads.
- Spending on AI-focused data center servers and operating expenses is projected to reach $76 billion by 2028.
- AI workloads are pushing rack power requirements from under 10 kW in 2023 to 50-100 kW. Accelerating the shift from air-based to liquid-cooling systems.
- Next-generation GPUs continue to drive rack density growth, with leading-edge deployments targeting up to 250 kW per rack.
- AI-related infrastructure is expected to account for $75.3 billion in data centre spending by 2028, roughly 35% of overall market demand.
- Revenue generated from generative AI workloads in data centers is forecast to grow at a compound annual rate of 58% between 2023 and 2028.
- Microsoft invested approximately $40 billion in AI data center capacity during 2024 and plans to increase spending to around $80 billion in fiscal 2025.
- In 2024, hyperscale operators collectively spent about $210 billion on AI data centre capital expenditures, with an additional $39 billion on operating costs.
Further
- Individual hyperscaler investments in 2024 included roughly $40 billion from Microsoft, $23 billion from Meta, $29 billion from Google, and $16 billion from Amazon.
- West Texas has announced 9.1 GW of cryptocurrency mining capacity across at least 17 projects. With 1.7 GW already operational and increasingly targeted for reuse in AI and high-performance computing.
- A federal $500 billion initiative known as Project Stargate aims to build domestic AI infrastructure. Beginning with a large-scale facility in Abilene, Texas.
- Meeting projected AI demand will require constructing at least 2× the data center capacity built since 2000, but within less than 25% of the time.
- Some projections indicate that up to 70% of total data center demand could be AI-driven by 2030, compared with under 50% in 2024.
- Hyperscaler capital expenditures are expected to remain elevated in 2025. With Meta potentially reaching $65 billion, Alphabet around $75 billion, and Amazon nearing $100 billion, largely for AI facilities.
- Generative AI workloads alone are expected to account for roughly 40% of total data center demand growth through 2030.
(Sources: Datacenter Dynamics, Business Insider, McKinsey & Company, Investopedia, What’s the Big Data, JLL Global Data Center Outlook, Ocolo, Wall Street Journal, Forbes, SDXCentral, Cushman & Wakefield, CBRE, Newmark US Data Center Market Outlook)
Global Data Center Distribution by Country and Region
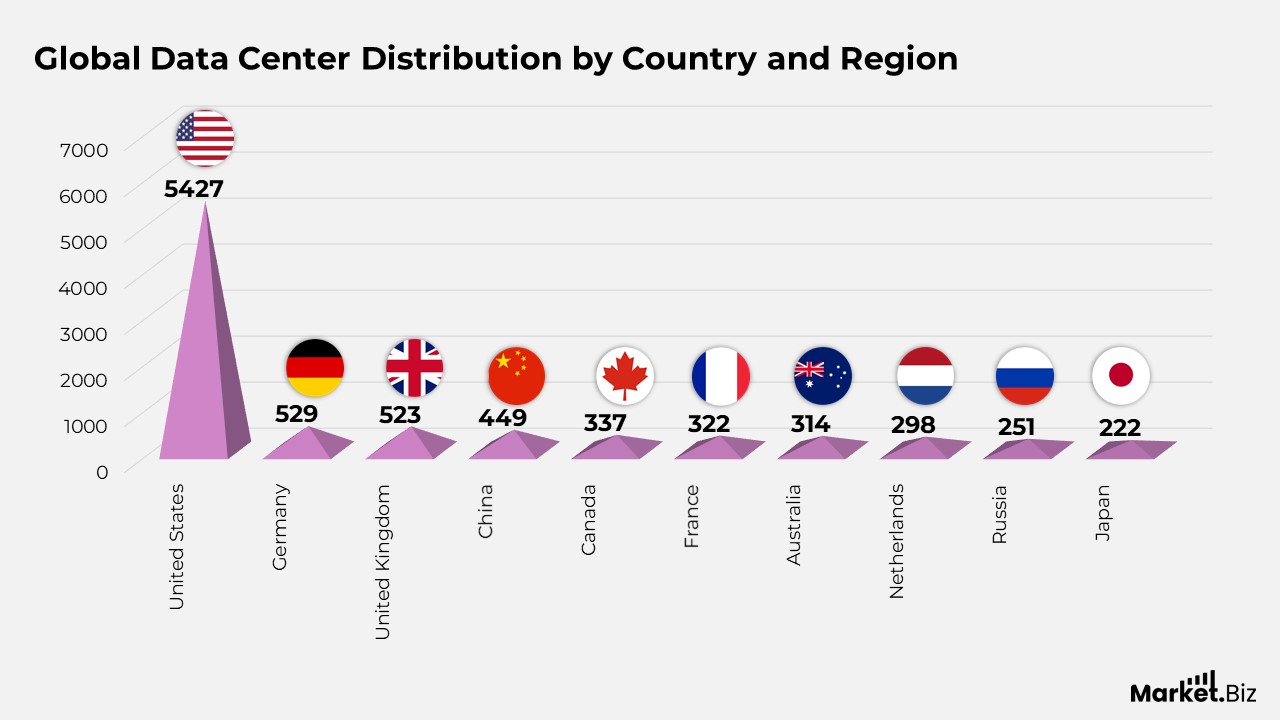
- As of November 2025, the United States ranked as the world’s largest data center hub with 5,427 operational facilities.
- Germany and the United Kingdom followed as Europe’s leading markets, hosting 529 and 523 data centers, respectively.
- China ranked fourth globally with 449 data centers, reflecting steady infrastructure expansion to support cloud and enterprise demand.
- Canada secured the fifth position worldwide with 337 data centers, reinforcing North America’s regional dominance.
- France, Australia, and the Netherlands each supported more than 290 data centres, underscoring the strong regional development of digital infrastructure.
- Russia and Japan rounded out the global top ten with 251 and 222 data centers, respectively.
Regional Distribution Overview
- North America hosted 5,767 data centres, accounting for approximately 48% of global facilities.
- The United States dominated the North American landscape with 5,427 data centres, while Canada contributed 337.
- Smaller markets such as the Cayman Islands have added a limited but notable presence, with 3 data centres.
European Data Center Landscape
- Europe operated approximately 3,346 data centres across more than 45 countries, underscoring a highly fragmented regional landscape.
- Germany, the United Kingdom, France, the Netherlands, and Russia collectively accounted for over 1,900 European data centers.
- Secondary European markets, including Italy, Poland, and Spain, each supported more than 140 data centers.
- Switzerland, Sweden, Belgium, and Austria formed a strong mid-tier cluster with counts ranging from 68 to 121 facilities.
- Nordic and Eastern European countries such as Finland, Norway, Ukraine, and Ireland continued to expand, each hosting between 47 and 58 data centers.
- Smaller European nations, including Malta, Iceland, Cyprus, and Macedonia, maintained niche footprints with 6 or fewer facilities each.
- Microstates and emerging markets such as Monaco, Liechtenstein, and Bosnia and Herzegovina hosted 2 data centres each, while Albania and Azerbaijan each operated 1 facility.
(Sources: Cargoson, Statista)
Data Center Energy Usage and Operational Efficiency
- Data centres collectively consume close to 1% of global electricity, reflecting their growing importance in the digital economy.
- A typical large-scale data centre operates at a power demand of approximately 100 to 200 megawatts.
- Cooling infrastructure accounts for the largest energy draw, accounting for nearly 60% of overall data centre power consumption.
- Hyperscale facilities account for roughly 25% of total data centre capacity but are responsible for more than 50% of sector-wide electricity usage.
- Continuous improvements in hardware design, cooling technologies, and power management have boosted data center energy efficiency by nearly 40% over the past 10 years.
(Sources: Cargoson, Statista)
Conclusion
Data center server statistics clearly underline the central role servers play in supporting cloud computing, enterprise workloads, AI applications, and the broader digital economy. Rising server densities, higher performance requirements, and the growing deployment of hyperscale and AI-optimized servers reflect how data centres are evolving to handle data-intensive, latency-sensitive workloads.
At the same time, efficiency improvements in server architecture, virtualization, and cooling technologies reflect the industry’s response to mounting energy and sustainability pressures as organizations continue to scale digital services.
Data centre servers are expected to remain a critical investment focus. Shaping capacity planning, power consumption, and infrastructure modernization strategies across global data center ecosystems.
FAQ’s
Data center server statistics highlight how servers support cloud platforms, enterprise applications, AI workloads, and large-scale data processing. They provide insights into server density, performance trends, power consumption, and efficiency improvements, helping organizations understand how infrastructure scales to meet growing digital demand.
These statistics help operators and enterprises assess server utilization, power requirements, and cooling needs. By analyzing server trends, decision-makers can plan capacity expansions, optimize energy use, and align infrastructure investments with sustainability and cost-efficiency goals.
Server trends increasingly reflect the rise of AI and cloud computing. With higher-density racks, specialized processors, and greater demand for scalable architectures. Data centre server statistics show a shift toward performance-optimised, energy-efficient servers designed to handle compute-intensive, data-heavy workloads.