
Introduction
Fencing Statistics: Grasping the fundamentals of fencing is vital for anyone initiating a fencing project. This entails choosing appropriate materials, such as wood for a classic look or vinyl for ease of maintenance, and taking into account design aspects like height and style.
Adhering to local regulations and securing necessary permits are essential steps to ensure compliance with zoning laws and property lines. Regular maintenance, which includes cleaning and repairs, is important for extending the lifespan of the fence. While financial considerations cover both material and labour costs.
Ultimately, seamlessly integrating the fence into the surrounding landscape enhances its visual attractiveness and practical functionality. The primary factors driving this growth include increasing residential and agricultural needs for security, privacy, and boundary definition. With the residential sector being the largest source of revenue. Cedar remains the most favoured wood option due to its durability, strength, and visual appeal.
Editor’s Choice
- The global fencing market is anticipated to achieve a revenue of USD 53.01 billion by the year 2033.
- The Global Fencing Market has witnessed remarkable growth over the years, achieving a CAGR of 5.5%.
- North America dominates the market with a considerable share of 34.0%. Followed closely by the Asia-Pacific (APAC) region, which represents 29.6% of the market.
- In 2019, China was the leading country in global aluminium production, generating an impressive 36,000 thousand tonnes.
- In 2010, the global production was recorded at 1,870 million metric tons. This increased to 2,030 million metric tons in 2011 and saw a slight rise to 2,070 million metric tons in 2012.
- The longest fences across the world exhibit considerable variation in their lengths. The Great Wall of China is the most extensive at 8,500 kilometres.
General Fencing Statistics
- The global fencing market is anticipated to achieve a revenue of USD 53.01 billion by the year 2033.
- The market for fencing on a global scale is primarily led by several major players. With Ameristar Fence Products Incorporated at the forefront, holding an 18% share of the market.
- North America is the leading region in this market, possessing a considerable share of 34%.
- The proportion of the global population residing in urban areas has experienced a notable rise from 1950 to 2050. Exhibiting diverse trends among various income groups of countries.
- The lengths of the longest border walls and fences worldwide differ greatly. With the Great Wall of China is recognized as the longest, stretching 8,500 kilometers.
- The analysis of internal fence types on both private and public properties indicates clear preferences and usage trends.
- On private properties, four-strand barbed wire fences are predominant, representing 338% of the total fences surveyed.
- The Department of Homeland Security oversees these initiatives through Customs and Border Protection (CBP). This involves substantial financial commitments, including the $1.375 billion designated for border infrastructure in the fiscal year 2018.
Fencing Market Statistics
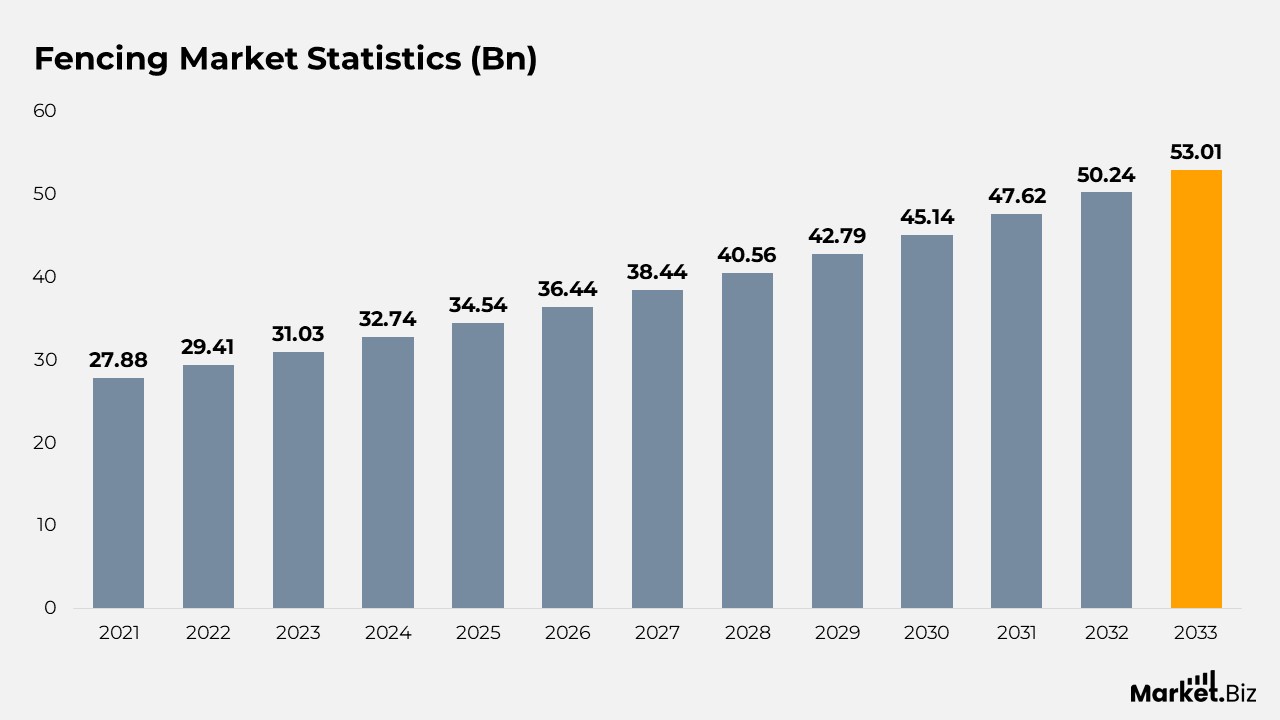
- The Global Fencing Market has witnessed remarkable growth over the years, achieving a CAGR of 5.5%.
- Revenue has consistently increased from USD 27.88 billion in 2021 to USD 29.41 billion in 2022.
- This positive trend persisted throughout 2023, reaching USD 31.03 billion, and is anticipated to continue growing. With revenue projected to reach USD 32.74 billion in 2024.
- The market is expected to expand significantly, reaching USD 34.54 billion in 2025, USD 36.44 billion in 2026, and USD 38.44 billion in 2027.
- By 2028, the market is forecasted to attain USD 40.56 billion. Further growth expected to reach USD 42.79 billion in 2029 and USD 45.14 billion in 2030.
- The forecasts suggest ongoing expansion, with revenue anticipated to increase to USD 47.62 billion in 2031, USD 50.24 billion in 2032, and ultimately reaching USD 53.01 billion by 2033.
Landscape of the Fencing Market
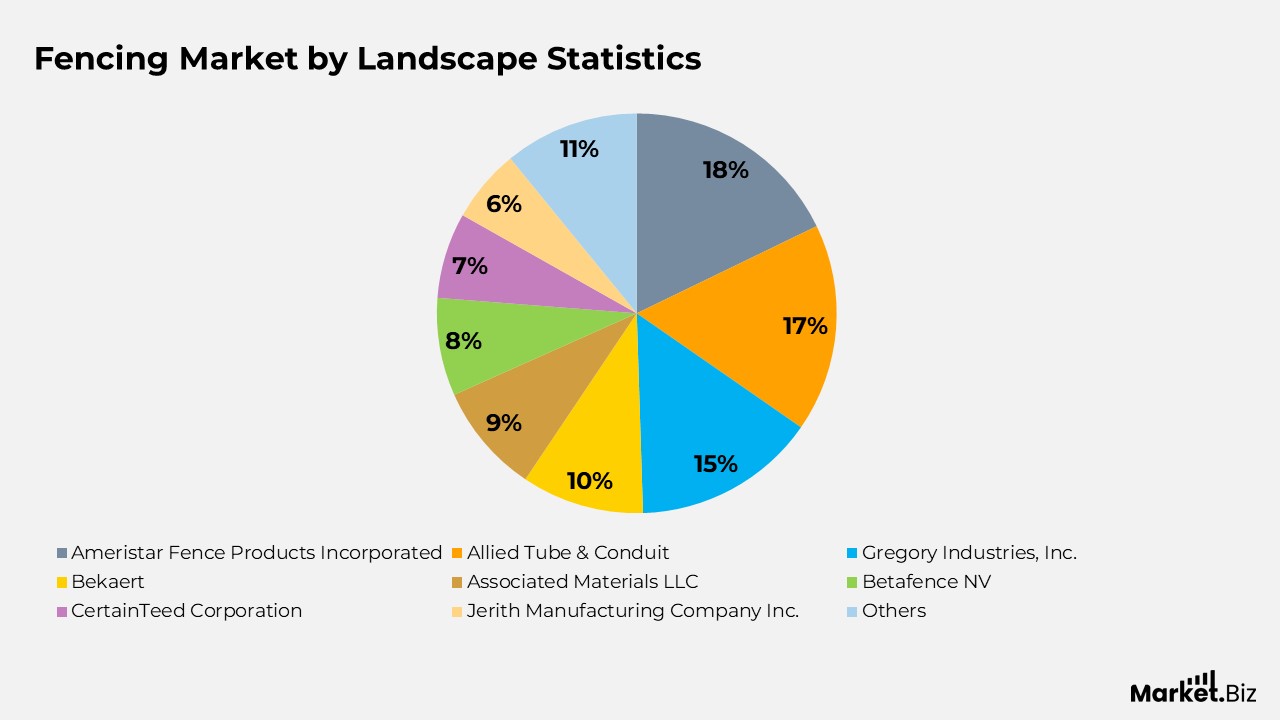
- The global fencing market is primarily led by several major companies. With Ameristar Fence Products Incorporated at the forefront, possessing an 18% market share.
- Allied Tube & Conduit closely follows with a 17% share.
- Gregory Industries, Inc. commands a notable segment of the market with 15%.
- Associated Materials LLC and Bekaert each control 9% and 10% of the market, respectively.
- Betafence NV secures 8% of the market, while Jerith Manufacturing Company Inc. and CertainTeed Corporation maintain shares of 6% and 7%, respectively.
- Other significant players together represent 11% of the market.
Fencing Market by Regions Statistics
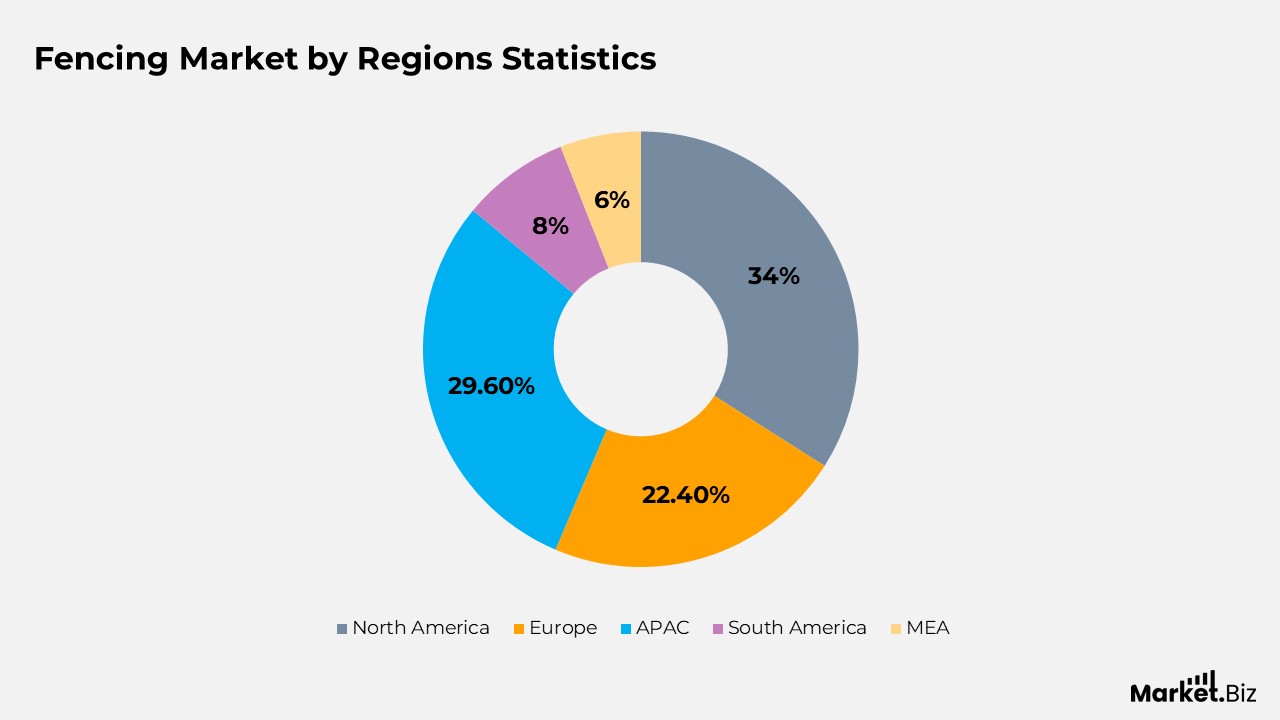
- North America dominates the market with a considerable share of 34.0%. Followed closely by the Asia-Pacific (APAC) region, which represents 29.6% of the market.
- Europe also has a notable presence, securing 22.4% of the market share.
- In contrast, South America, the Middle East, and Africa (MEA) account for smaller segments, with market shares of 8.0% and 6.0%, respectively.
Fencing Industry Growth Statistics
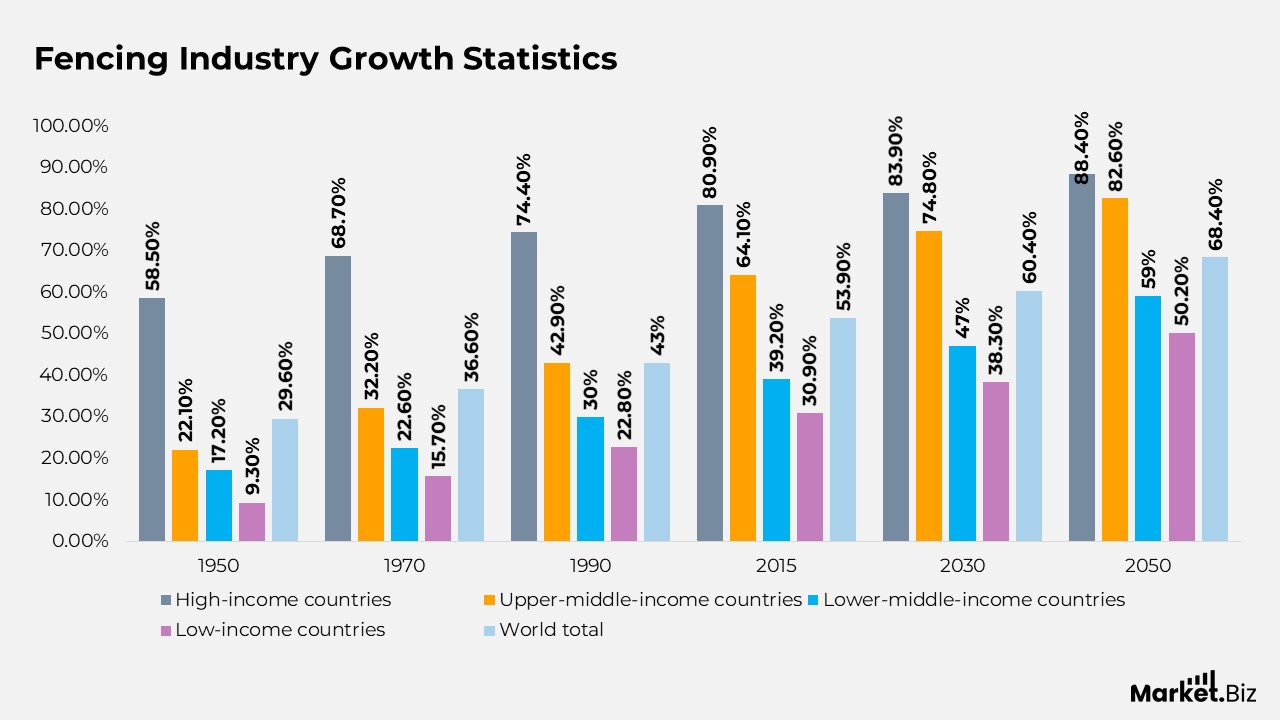
- In high-income nations, the rate of urbanisation increased from 58.50% in 1950 to 68.70% in 1970, reaching 74.40% by 1990 and further rising to 80.90% in 2015. It is anticipated to reach 83.90% in 2030 and 88.40% by 2050.
- Upper-middle-income nations experienced a rise in urban populations from 22.10% in 1950 to 32.20% in 1970, 42.90% in 1990, and a notable increase to 64.10% in 2015, with future estimates suggesting 74.80% by 2030 and 82.60% by 2050.
- Lower-middle-income nations saw growth from 17.20% in 1950 to 22.60% in 1970, 30% in 1990, and 39.20% in 2015, with projections indicating 47% by 2030 and 59% by 2050.
- Low-income nations recorded the lowest urbanisation rates, beginning at 9.30% in 1950 and rising to 15.70% in 1970, 22.80% in 1990, and 30.90% in 2015, with forecasts of 38.30% by 2030 and 50.20% by 2050.
- Globally, the urban population increased from 29.60% in 1950 to 36.60% in 1970, 43% in 1990, and 53.90% in 2015. With future projections of 60.40% by 2030 and 68.40% by 2050. Illustrating a consistent and significant trend towards urbanisation across all income categories.
Steel Fencing Statistics
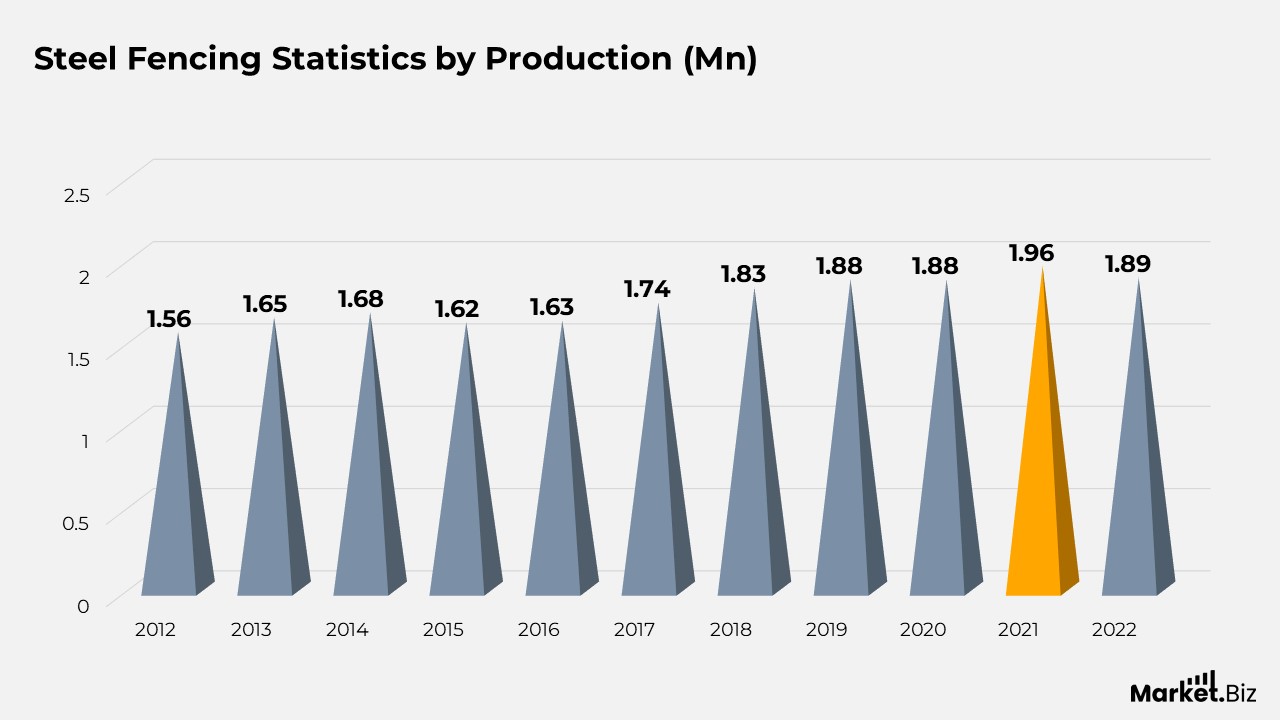
- In 2012, production was recorded at 1,563 million metric tons, which increased to 1,653 million metric tons in 2013 and further to 1,675 million metric tons in 2014.
- There was a minor decline in 2015, as production fell to 1,624 million mt, but it recovered to 1,633 million metric tons in 2016.
- The upward trajectory persisted in the following years, reaching 1,737 million mt in 2017, 1,828 million metric tons in 2018, and 1,877 million metric tons in 2019.
- In 2020, production saw a slight increase to 1,882 million metric tons and continued to rise to 1,962 million metric tons in 2021.
- Nevertheless, there was a slight reduction in 2022, with production amounting to 1,885 million metric tons.
Bricks Fencing Statistics
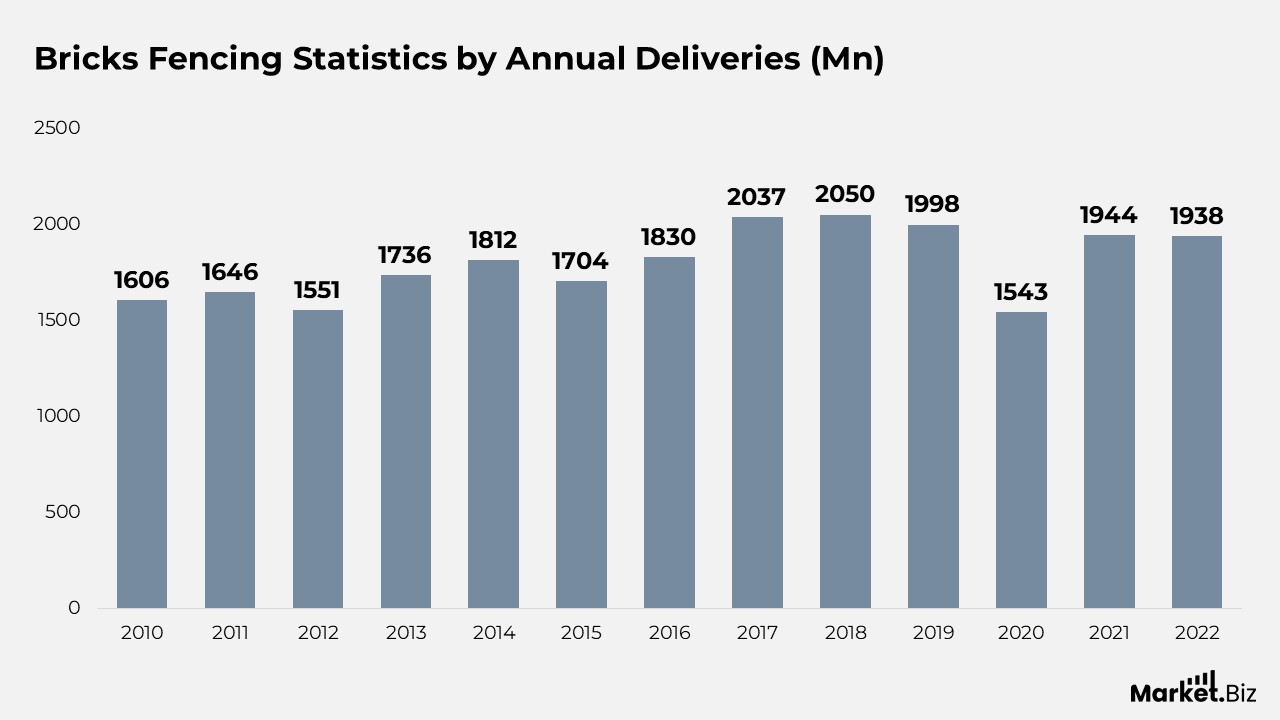
- In 2010, the number of deliveries was recorded at 1,606 million bricks. This saw a modest increase to 1,646 million bricks in 2011.
- The subsequent year experienced a decline to 1,551 million bricks. Yet deliveries rose once more to 1,736 million bricks in 2013.
- This positive trend persisted into 2014, culminating in a total of 1,812 million bricks.
- A minor decrease occurred in 2015, with deliveries amounting to 1,704 million bricks, followed by a rise to 1,830 million bricks in 2016.
- Deliveries escalated to 2,037 million bricks in 2017 and increased slightly to 2,050 million bricks in 2018.
- In 2019, there was a slight reduction in deliveries to 1,998 million bricks.
- The year 2020 experienced a notable decline to 1,543 million bricks, likely attributable to the effects of the COVID-19 pandemic.
- Nevertheless, deliveries recovered to 1,944 million bricks in 2021 and remained fairly consistent at 1,938 million bricks in 2022.
Cement Fencing Statistics
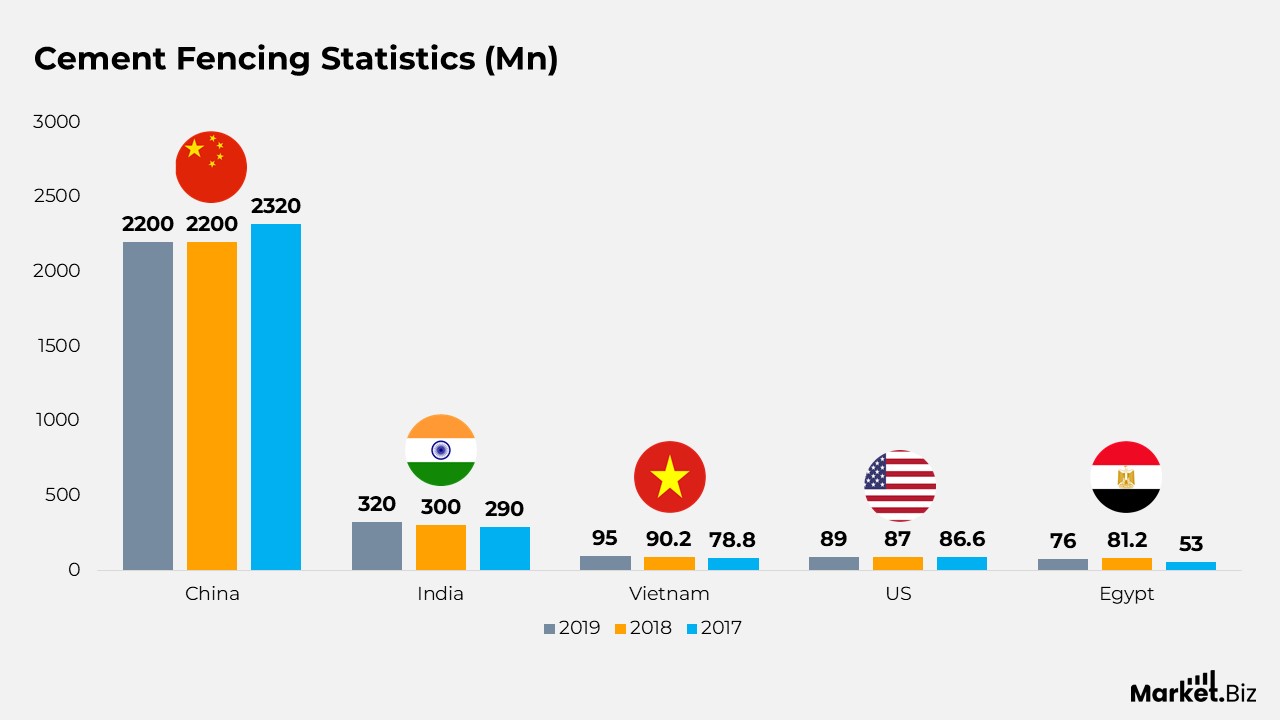
- China consistently maintained its position as the leader in global production. With output varying between 2,350 million metric tonnes in 2015 and 2,410 million metric tonnes in 2016, before reaching a stable level of 2,200 million metric tonnes by 2018 and 2019.
- India experienced a continuous rise in production. Increasing from 270 million metric tonnes in 2015 to 320 million metric tonnes in 2019.
- Vietnam’s production saw a significant increase, climbing from 61 million metric tonnes in 2015 to 95 million metric tonnes in 2019.
- The United States exhibited a consistent upward trend. Growing from 83.4 million metric tonnes in 2015 to 89 million metric tonnes in 2019.
- Egypt witnessed notable growth, with its production escalating from 55 million metric tonnes in 2015 to 81.2 million metric tonnes in 2018, before declining to 76 million metric tonnes in 2019.
- Indonesia’s production fluctuated slightly, reaching a peak of 75.2 million mt in 2018.
- Iran’s production remained fairly consistent, decreasing from 65 million mt in 2015 to 60 million metric tonnes in 2019.
- Russia’s production fell from 69 million metric tonnes in 2015 to 53.7 million metric tonnes in 2018, subsequently increasing to 57 million metric tonnes in 2019.
- Brazil demonstrated growth, rising from 55 million metric tonnes in 2015 to 72 million metric tonnes in 2019.
Aluminium Fencing Statistics
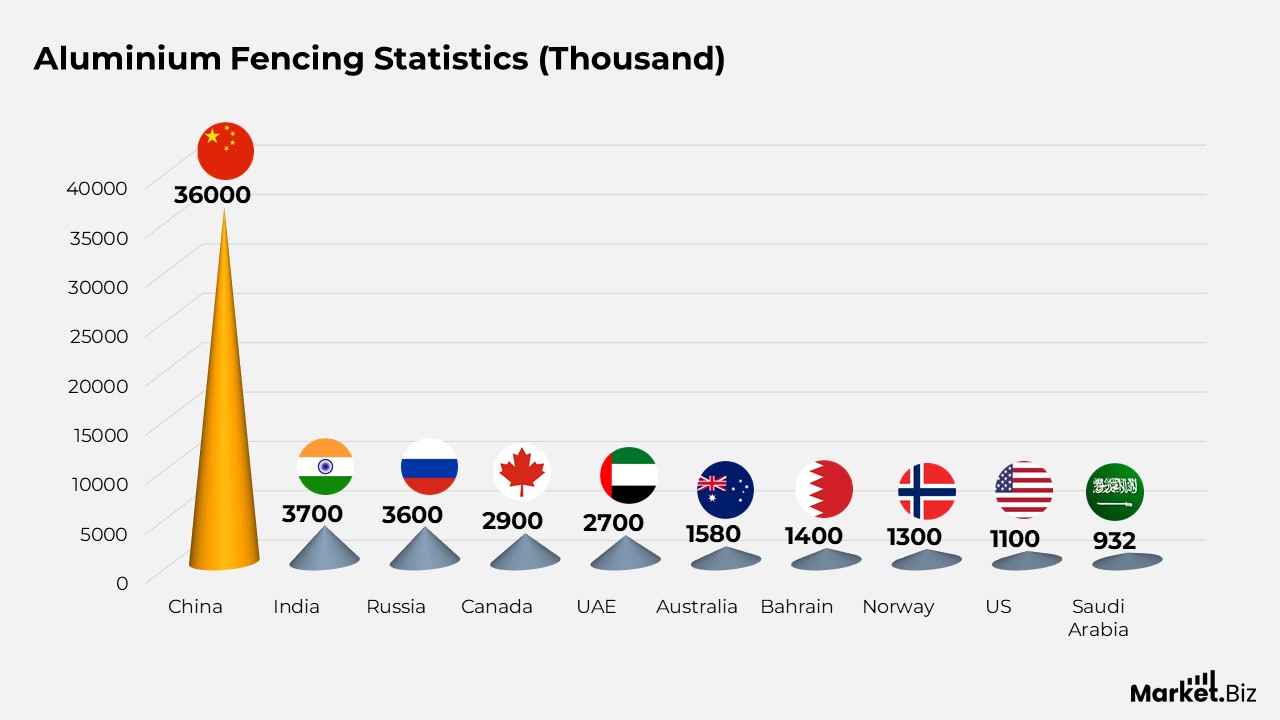
- In 2019, China was the leading country in global aluminium production, generating an impressive 36,000 thousand tonnes.
- India ranked as the second-largest producer, with a total of 3,700 thousand tonnes, closely followed by Russia, which produced 3,600 thousand tonnes.
- Canada also made a significant contribution, producing 2,900 thousand tonnes.
- The United Arab Emirates added 2,700 thousand tonnes to the global output.
- Other prominent producers included Bahrain with 1,400 thousand tonnes, Australia with 1,580 thousand tonnes, and Norway with 1,300 thousand tonnes.
- The United States contributed 1,100 thousand tonnes.
- Saudi Arabia produced 932 thousand tonnes.
Iron Fencing Statistics
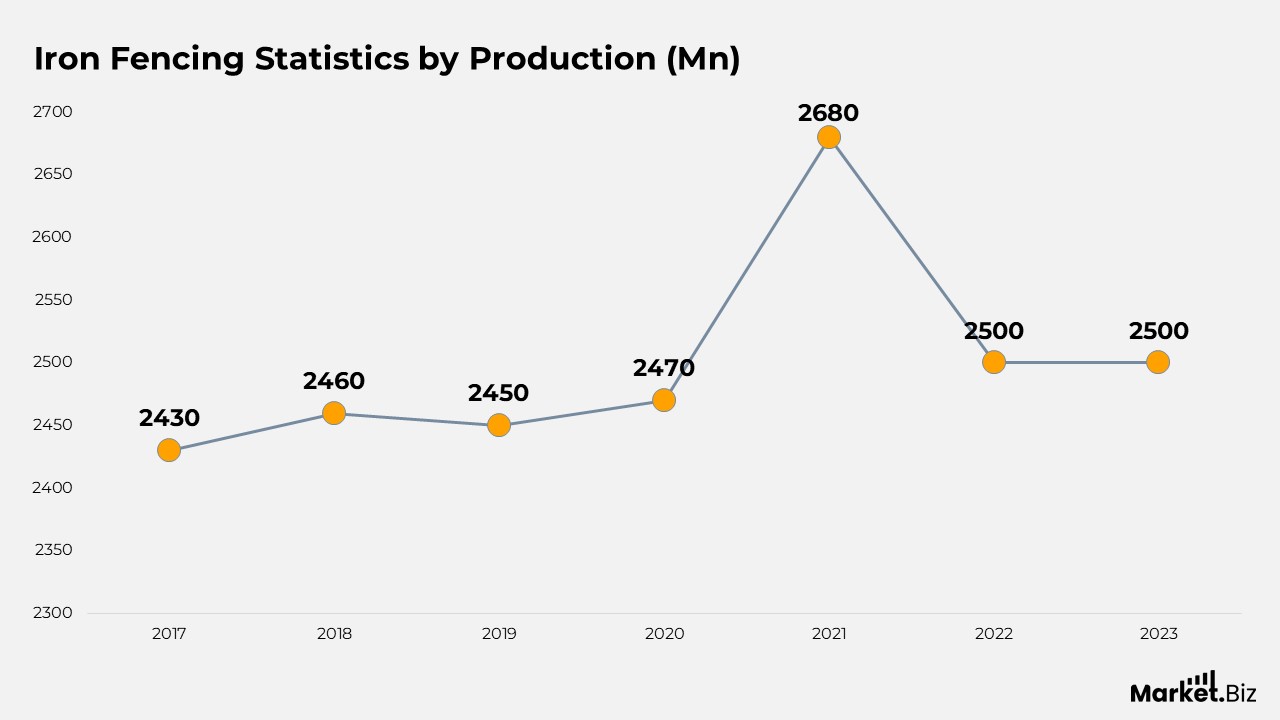
- In 2010, the global production was recorded at 1,870 million metric tons. Which increased to 2,030 million metric tons in 2011 and saw a slight rise to 2,070 million metric tons in 2012.
- The growth trend continued with 2,200 million metric tons in 2013 and 2,340 million metric tons in 2014.
- Although there was a minor decline to 2,320 million metric tons in 2015. Production rebounded to 2,350 million metric tons in 2016.
- This upward trajectory persisted, with production volumes reaching 2,430 million metric tons in 2017 and 2,460 million metric tons in 2018.
- In 2019, production experienced a slight decrease to 2,450 million metric tons but increased again to 2,470 million metric tons in 2020.
- The year 2021 witnessed a notable surge, with production peaking at 2,680 million metric tons.
- However, production levels stabilized at 2,500 million metric tons in both 2022 and 2023.
Longest Fencing Statistics
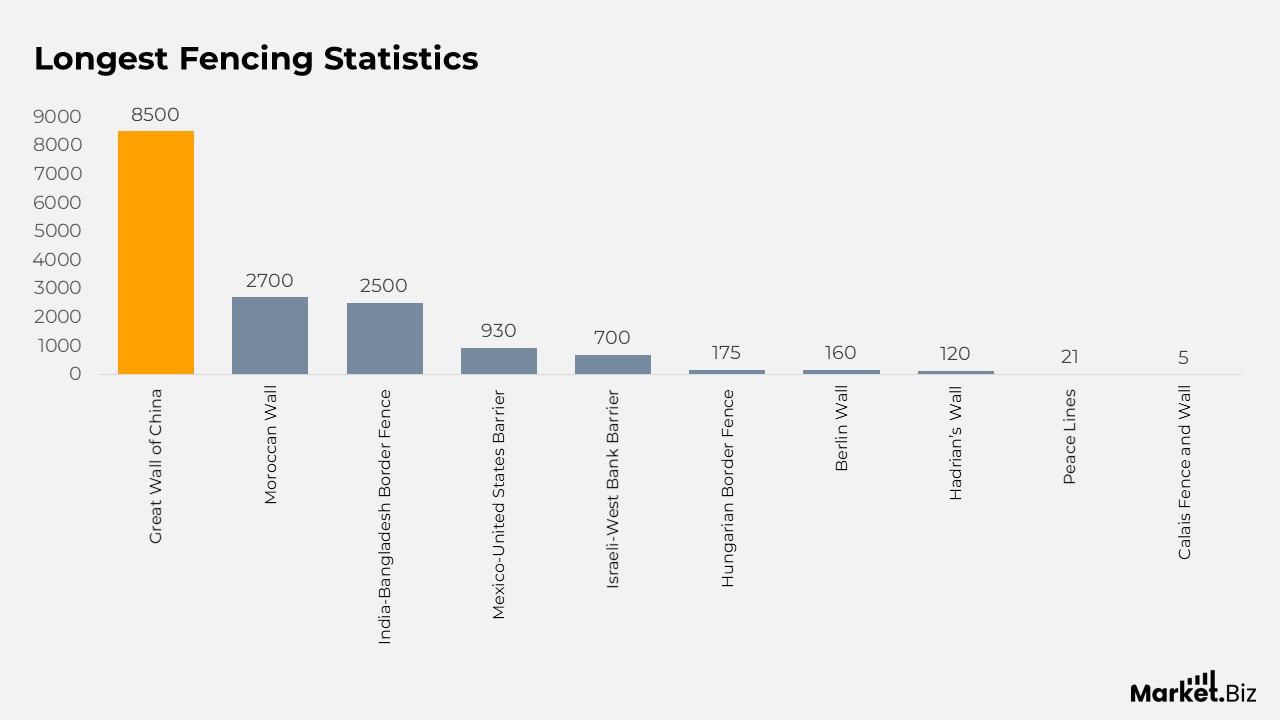
- The longest fences across the world exhibit considerable variation in their lengths, with the Great Wall of China being the most extensive at 8,500 kilometres.
- Following this is the Moroccan Wall, which extends for 2,700 kilometres.
- The India-Bangladesh Border Fence is also significant, covering 2,500 kilometres.
- The Mexico-United States Barrier stretches for 930 kilometres, while the Israeli-West Bank Barrier measures 700 kilometres in length.
- The Hungarian Border Fence is 175 kilometres long, and the Berlin Wall, although no longer in existence, historically reached 160 kilometres.
- Hadrian’s Wall, constructed by the Romans, spans 120 kilometres.
- In Northern Ireland, the Peace Lines have a length of 21 kilometres.
- The Calais Fence and Wall, designed to deter illegal immigration, is the shortest among these, measuring only 5 kilometres.
Fencing Recent Development
- In May 2021, Jackson’s Fencing introduced T-shaped steel posts that were specifically engineered for timber fence panels.
- In February 2023, TriWest Capital Partners secured a controlling stake in Phoenix Fence Corp., a prominent supplier of fencing and associated products in the industry.
- In February 2023, Crossplane Capital partnered with Sal Chavarria to obtain a controlling interest in Viking Fence.
- In September 2023, Fencing Supply Group purchased Atlantic Fence Supply, a fencing supplier based in the United States.
Fencing Future Prediction
- The wood fencing industry is anticipated to expand, with forecasts indicating a global market value of almost $10 billion by the year 2030.
- The worldwide market is predicted to increase, with estimates varying from a valuation of $9.9 billion by 2030 at a compound annual growth rate (CAGR) of 2.8% to a valuation of $12.58 billion by 2032.
Conclusion
Fencing Statistics: The growing worldwide demand for fencing, fuelled by heightened construction activities and security issues, has led to notable progress in fencing technologies and materials.
Regulations and policies regarding border walls and fences vary by region, illustrating different geopolitical circumstances. In the United States, substantial funding and legislative backing have enabled the building and upkeep of border barriers, prioritising security and immigration management.
In contrast, the European Union emphasises integrated border management. Making significant investments in surveillance and infrastructure, while not directly funding physical walls. This indicates a more comprehensive strategy for border security.
FAQs
Wooden fences generally have a lifespan of 15 to 20 years, depending on the wood type and the level of maintenance. Cedar and redwood are known for their durability, whereas pine and spruce may not last as long. To safeguard against moisture and UV damage, it is advisable to seal or stain your wooden fence every 2 to 3 years.
Wooden fences are the most commonly used fencing option, and this is for valid reasons. They are cost-effective, straightforward to install, and can be tailored to meet your individual requirements. Additionally, wooden fences enhance the natural aesthetic of any property.
To protect your investment, regular maintenance is essential, which includes periodic applications of preservatives and new layers of paint or stain. Furthermore, wooden fences are susceptible to damage from insects such as termites and woodworms, which can undermine their structural integrity over time.