Introduction
Smart TV statistics offer valuable insights into one of the fastest-growing segments of the global consumer electronics market, driven by expanding streaming platforms, improving internet access, and the steady shift away from traditional cable.
As Smart TVs become the central hub of home entertainment, they now integrate advanced features such as voice control, app ecosystems, AI-powered recommendations, and seamless smart-home connectivity.
Rising demand for high-resolution 4K and 8K displays, coupled with surging OTT consumption, continues to fuel adoption across mature and emerging markets. With manufacturers investing heavily in operating systems, display technologies, and AI-enabled functions, Smart TV usage trends and market data are increasingly important for brands, advertisers, and technology stakeholders seeking to understand consumer behavior, regional adoption patterns, and future growth prospects in the connected entertainment ecosystem.
Editor’s Choice
- 40% of viewers say they will stop watching CTV when ads become excessive, yet they’re willing to sit through up to 5.8 ads as long as the ads are relevant to them.
- Around 86% of consumers are comfortable with ads on CTV, particularly when the ads match their interests.
- CTV now reaches 2 out of 3 viewers in the United States, and daily usage has climbed by more than 100% since 2017.
- Viewers consumed the equivalent of 13.1 million days of media and enterprise video content, reflecting massive global engagement.
- Online video service subscriptions reached 1.1 billion worldwide, representing strong growth as more households adopt streaming.
- Entertainment content on Connected TVs recorded a 252% surge in views compared to 2019, showing rapid expansion in CTV usage.
- Live content viewing saw a 250% jump in watch time, indicating rising demand for real-time streaming experiences.
- Smart TV viewing time increased by 200% compared to 2019, highlighting a major shift toward screen-based streaming experiences.
- Around 69.8 million households used OTT services in April, up 5.2 million from the same month in 2019.
Connected TV Viewership Trends Beyond the United States
- Nearly two-thirds of the UK population now watches digital video content through connected TVs, reflecting strong nationwide adoption.
- In the US, connected TV usage skews toward older viewers, whereas in the UK, the 25–44 age group is the leading CTV audience segment.
- India is witnessing rapid growth in connected TV penetration, with 12–14 million monthly active CTV operators as smart TV adoption accelerates.
- Across Europe, more than 50% of promoters and nearly 100% of agencies identify CTV and addressable TV as major growth priorities for digital video in the next year.
(Source: Emarketer, iabeurope.eu, tinuiti )
General Smart TV Statistics
- By 2024, smart TVs are present in 79% of U.S. households, up from 66% in 2020.
- This rise aligns with the launch of major streaming platforms such as Apple TV+, Disney+, and Peacock.
- More viewers are shifting from cable to streaming because smart TVs offer built-in apps and convenience.
- Weekly smart-TV streaming in the U.S. increased from 47% in 2021 to 62% in 2024, a 15-point jump.
- Smart TVs have become more affordable, yet buyers are increasingly interested in larger screens such as 100-inch models.
- The rapid rise in smart-TV ownership reinforces the long-term growth potential of the streaming ecosystem.
- Streaming platforms like Netflix and Amazon now participate in upfronts to showcase premium programming.
- U.S. households continue to expand their base of smart-TV ownership.
- In early 2024, 58% of smart TVs streamed exclusively, up 3% from the previous quarter.
- Only 38% of viewers watched both streaming and traditional TV, down from 46% in early 2022.
Further
- The average smart TV contained 5.5 installed apps, the same as in late 2023, indicating slower app expansion.
- Streaming accounted for 57% of viewing time, slightly below 58% in the previous quarter.
- Traditional TV usage fell to 33%, dropping from 47% three years earlier.
- Live content, especially sports and award shows, still relies heavily on traditional platforms, with 72.3% of sports watched via cable, satellite, or OTA.
- U.S. connected-TV ad spend is expected to reach USD 29.3 billion in 2024, up 16.7% from 2023.
- Over 5 million Americans dropped pay-TV in 2023, exceeding the 4.6 million who left in 2022.
- Netflix will stream two NFL Christmas games annually for the next 3 years, reflecting the migration of sports to streaming.
- Amazon Prime Video is negotiating exclusive rights to select NBA games, reinforcing this shift.
- The U.S. smart-TV market reached 31.34 million units in 2023 and is on track to reach 34.10 million units by 2028, with a 1.70% CAGR.
Moreover
- Global smart-TV sales totaled about 80 million units in 2023.
- In the U.S., 49% of smart-TV owners fall between the ages of 35 and 54.
- In the UK, 77% of consumers own a smart TV, with strong adoption among those aged 35–44.
- In Q1 2023, global TV-streaming device shipments grew by 2%, aided by strong PS5 performance.
- Smart-TV usage dipped in February due to fewer high-demand content releases.
- In February 2023, cable and broadcast usage dropped by 5.7% and 9.2%, respectively.
- In January 2023, smart-TV viewing shares were Broadcast 24.9%, Cable 30.4%, Streaming 32.8%, and Others 11.9%.
- In February 2023, the distribution shifted to Broadcast 23.8%, Cable 30.2%, Streaming 34.3%, and Others 11.7%.
- Indian smart-TV shipments declined by 5% year over year in the first half of 2023.
(Source: Coolest Gadgets, Statista )
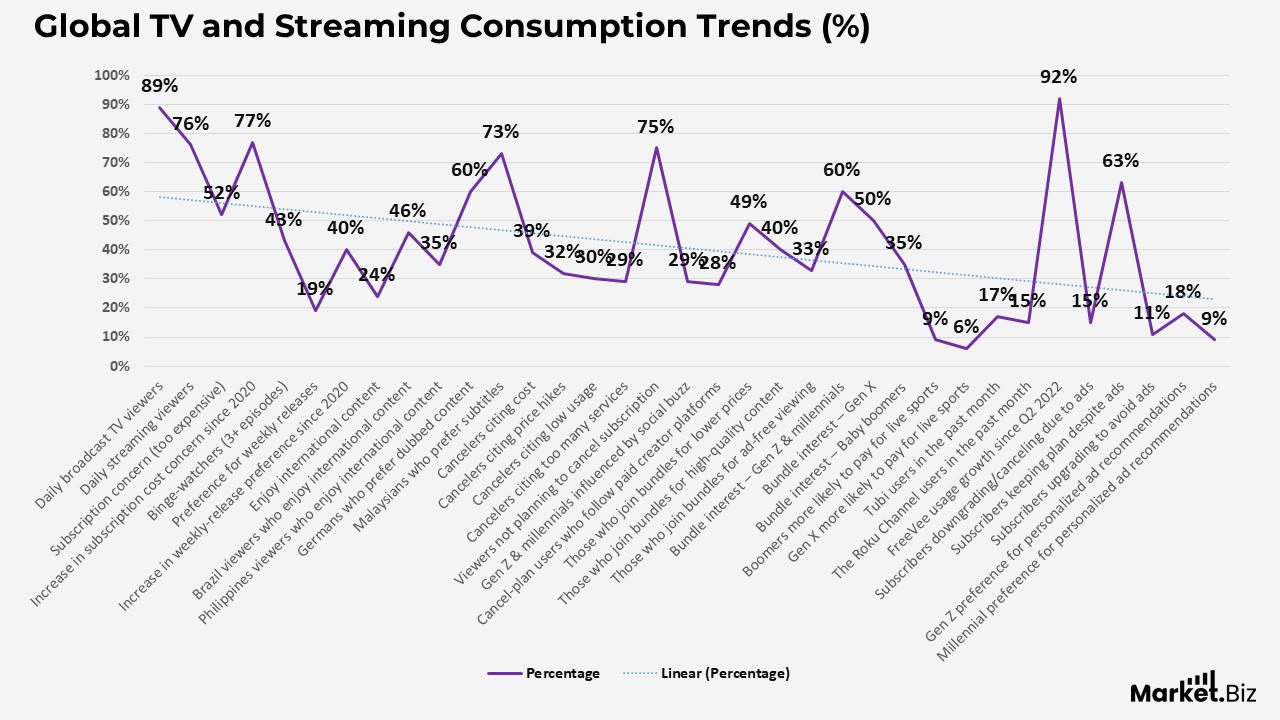
Global TV and Streaming Consumption Trends
- 89% of consumers globally watch broadcast TV every day.
- 76% of consumers stream online TV daily.
- Viewers spend about 1 hour 22 minutes each day on streaming and 1 hour 47 minutes on linear TV.
- 26% of consumers have paid for a streaming service in the past month.
- 52% of US viewers say subscriptions are becoming too expensive, a 77% jump since 2020.
- 43% of US viewers binge more than 3 episodes in a single sitting.
- 19% of US viewers prefer weekly releases for streaming shows.
- Preference for weekly releases in the US has grown by 40% since 2020.
- Americans lookout an average of 3 hours and 2 minutes of linear TV per day.
- South Africa, Saudi Arabia, and Egypt lead the world in streaming time, with 1 hour 52 minutes per day.
- Japan and South Korea record only 20 minutes and 44 minutes of daily streaming
- 24% of global viewers enjoy international content, especially in Brazil (46%) and the Philippines (35%).
- 60% of Germans prefer dubbed TV content, while 73% of Malaysians prefer subtitles.
Moreover
- 39% of consumers who canceled or plan to cancel cite cost as the primary reason, followed by price hikes (32%), low usage (30%), and too many services (29%).
- 75% of consumers have no plans to cancel their TV subscription.
- 29% of US Gen Z and millennial viewers enjoy watching shows that are widely discussed.
- 28% of consumers planning cancellations also follow paid creator platforms.
- 49% say lower prices would motivate them to join a streaming bundle, while 40% seek high-quality content and 33% want ad-free options.
- Interest in streaming bundles is highest among Gen Z and millennials at 60%.
- Gen X shows 50% interest, while baby boomers show 35%.
- Baby boomers are 9% more likely, and Gen X are 6% more likely than average to value live sports in bundle offerings.
- 17% of US viewers used Tubi in the past month.
- 15% of US viewers used The Roku Channel.
- FreeVee usage in the US has jumped by 92% since Q2 2022.
- 15% of streamers have downgraded or canceled subscriptions due to ads.
- 63% kept their subscription unchanged despite ads, while 11% upgraded to remove ads.
- Gen Z is 18% more likely, and millennials are 9% more likely, to favour personalised ad recommendations.
(Source: GWI, Statista)
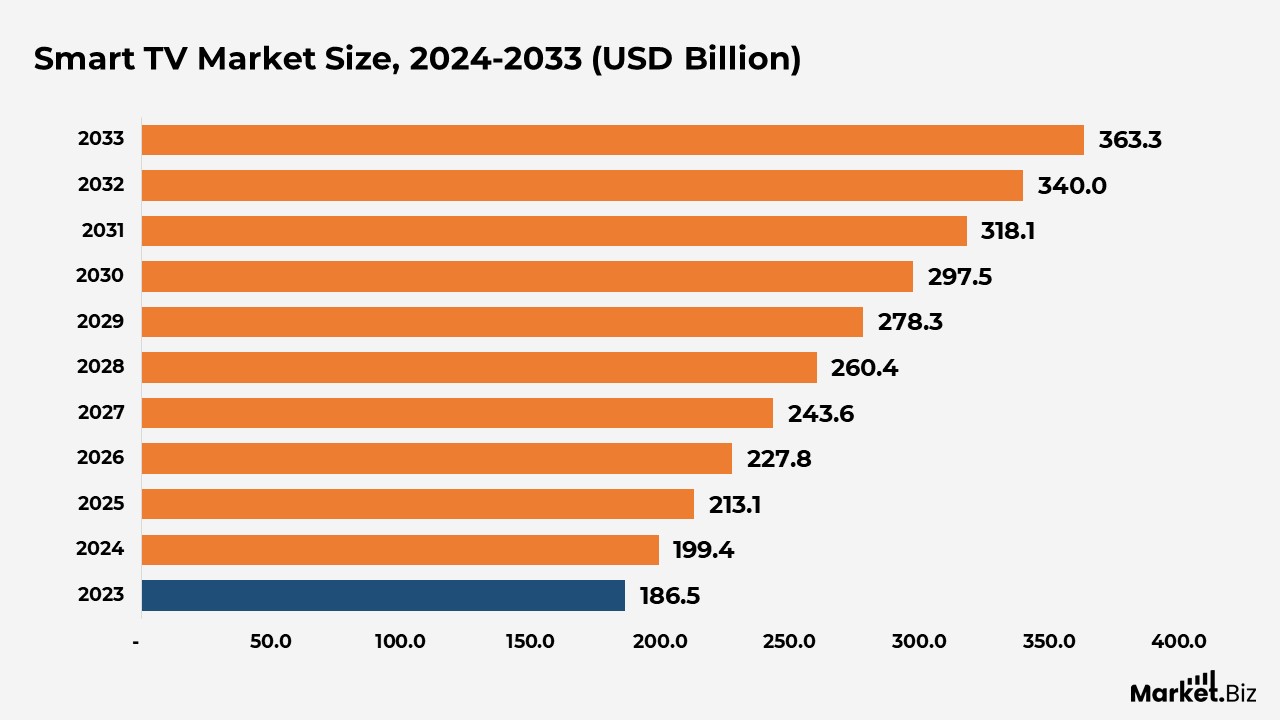
Smart TV Market Size Statistics
- According to Market.us, the smart TV market is projected to grow from $199.4 billion in 2024 to $363.3 billion by 2033, with a compound annual growth rate (CAGR) of 6.9% over the period.
- The growth of this market is driven by rising streaming adoption and enhanced display innovations, and the market continues to accelerate.
- By distribution channel, online platforms lead the Smart TV market with 58.4% share, supported by consumer preference for comparison shopping, attractive discounts, and the convenience of home delivery.
- Android OS dominates the Smart TV operating system segment, accounting for 43.2% of global market share in 2023.
- 4K UHD TVs remain the top resolution category, capturing a strong 48.3% share of the Smart TV market in 2023.
- The 46–55-inch screen segment holds the leading position, accounting for 35.6% of the total Smart TV market share in 2023.
- LED display technology remains the preferred choice worldwide, accounting for more than 54.3% of the Smart TV market in 2023.
- Asia Pacific represents the largest regional market, accounting for 42.8% of global Smart TV sales in 2023, driven by rising disposable incomes, rapid urbanization, and robust manufacturing ecosystems in China, South Korea, and Japan.
(Source: Market.us)
Time Spent on Streaming vs. Traditional TV
- Viewers now spend an average of 1 hour 22 minutes per day on streaming platforms.
- This is 10 minutes lower than the peak streaming time recorded in 2022.
- Audiences continue splitting their attention between streaming apps and broadcast channels.
- Traditional linear TV still has a strong hold, with viewers watching around 1 hour and 47 minutes each day.
(Source: GWI, Statista)
Streaming Subscription Behavior
- About 26% of consumers have paid for at least one streaming service in the past month.
- Even with rising prices, many viewers continue paying for access to premium content.
- However, 52% of U.S. TV watchers now believe streaming subscriptions are too costly.
- This sentiment has surged 77% since 2020, showing growing price sensitivity among consumers.
(Source: GWI, Statista)
Profile of Connected TV Audiences
- A large share of CTV viewers falls within the 18–34 age range, making younger adults a major audience segment.
- Around 4 in 10 U.S. older people now use CTV, while adoption among adults aged 25–54 jumps to more than 80%.
- Even boomers lean toward digital viewing, with 40% spending most of their time watching streaming services rather than cable.
(Source: Tinuiti)
Millennial and Gen Z Engagement with CTV
- Gen Z and Millennials together account for over 110 million CTV users, reflecting their strong influence on streaming habits.
- Among Gen Z Roku viewers, 1 in 4 discover new brands through streaming ads, and 35% report purchasing because of those ads.
- Millennial CTV adoption continues rising, with connected-TV users projected to reach 62.6 million in the U.S. by 2025.
(Source: Tinuiti)
CTV Advertising Investment Trends
- The CTV sector was projected to expand by 14.4% in 2023, outpacing the broader advertising market.
- Connected TVs captured 33% of streaming video ad budgets in Q2 2022, up from 28% the previous year, and accounted for 53% of spending on standard video ads during the same period.
- In 2019, Roku, Hulu, and YouTube collectively held 45.9% of the U.S. CTV ad market, but their combined share has since declined to roughly one-third.
- CTV advertising spend in the United States reached 21.16 billion in 2022, reflecting strong advertiser demand.
- About 76% of video buyers view CTV as a mandatory component of their media planning strategies.
- Forecasts suggest CTV ad spending is on track to surpass 26 billion in 2023, marking another milestone for the industry.
(Source: Tinuiti, Statista)
Recent Developments
- In September 2025, Roku partnered with Vestel to develop smart TVs powered by Roku’s operating system, expanding the brand’s reach into new consumer markets.
- In September 2025, Samsung partnered with Videotex International to manufacture Smart TVs running the Tizen operating system at its Greater Noida facility. The collaboration blends Samsung’s software with Videotex’s production expertise. Boosting Tizen OS TV output in India and enhancing home entertainment experiences with advanced Tizen features.
- In January 2024, Panasonic Entertainment & Communication collaborated with Amazon.com Services LLC to deliver TVs optimized for high-quality visuals and sound tailored to each household. This partnership enables a personalized home screen that integrates live TV, streaming apps, recommendations, and content discovery tools for a smoother, more intuitive viewing experience.
- In April 2023, the company introduced 21 new Sber Smart TV models, including QLED flagship versions with voice-control capabilities, developed through its partnership with Sberdevices (SaluteDevices LLC).
- In July 2025, Coocaa expanded its presence in India by launching the S4U Plus Smart TV series powered by Coolita 3.0. These models feature a 60Hz refresh rate for smoother visuals and reduced motion blur, making them well-suited for gaming, live sports, and fast-moving content.
- In November 2025, Samsung collaborated with leading global creators to bring their exclusive FAST channels directly to Samsung TVs, giving viewers a wider variety of free streaming content on the home’s largest screen.
- In December 2024, Glance partnered with Airtel Digital TV to introduce Glance TV, a platform that transforms idle screens into smart, interactive experiences through personalized content and real-time engagement features.
(Source: Press Releases)
Conclusion
Smart TV Statistics: Smart TVs have reshaped the entertainment landscape by merging streaming platforms, apps, and traditional television into one seamless viewing experience. Rising ownership rates, increased streaming time, and evolving viewer preferences highlight how central Smart TVs have become in modern households.
While traditional TV still plays an important role for live broadcasts, streaming continues to take the lead due to its convenience, diverse content options, and on-demand flexibility. With strong adoption across demographics, growing global sales, and consistently high engagement. Smart TVs will continue to drive the future of digital entertainment and redefine how audiences worldwide watch content.
FAQ’s
Smart TVs integrate internet connectivity with traditional television, creating a unified platform where viewers can access streaming services, apps, and live TV from one device.
Their rising popularity is driven by easier access to streaming content, lower prices, and the growing preference for on-demand viewing across age groups.
Smart TVs encourage a shift toward streaming by offering quick access to multiple platforms, increasing daily streaming time and reducing reliance on traditional cable and satellite TV.
Both formats serve different viewer needs—streaming offers convenience and flexibility, while linear TV remains important for live broadcasts, real-time events, and scheduled programming.
App usage depends on viewer preference, the availability of popular platforms, and the adoption of premium content services, leading users to settle on a core set of frequently used apps.