
Introduction
Instagram Marketing Statistics: Instagram’s marketing dominance can no longer be dismissed. With a jaw-dropping 2 billion monthly active users, and with 500 million people engaging with stories daily, while 61% look at Instagram to discover new products, businesses are spreading real ad dollars now, over 1 million businesses are running ads on Instagram, and ad spend is expected to grow to $276.7 billion on social platforms in just 2 years.
The shift to short-form content is strong. Reels are now responsible for 45% of the time spent engaging with content on Instagram, and video posts platform’s better than static images by 49%. With 90% of users following at least one business, and 70% of users engaging with Instagram stories daily, Instagram will continue to play a central role in consumer connection.
As video content and shopping functionality drive deeper and broader engagement, marketers who lean into Reels, shoppable posts, and authenticity can see real ROI and audience growth.
Editor’s Choice
- The cost-per-click (CPC) for Instagram ads is notably low, ranging from $0.00 to $0.25.
- Brands have increased their usage of reels by 12% from 2023 to 2024.
- 8.42% of all Instagram users possess over 50,000 followers.
- 76.37% of Instagram users have fewer than 10,000 followers.
- On Instagram, 65.39% of users have around 1k-10k followers.
- Sports brands made around 18 posts on an average weekly basis on Instagram.
- According to the data, the education sector is at the top in terms of engagement at 8.4%.
- According to a survey, 44% of Instagram users use the platform to promote products or services.
- Live videos on Instagram receive 6 times more comments and 8 times better reactions than regular videos.
General Instagram Marketing Statistics
- 84% of social media users have a genuine or verified profile on Instagram, the highest among all platforms.
- Only 0.2% of Instagram users utilize the platform independently, while the majority also engage with Facebook (80.3%), YouTube (76.9%), or TikTok (54.3%).
- Half of users interact with brands on Instagram at least once a day.
- The gender distribution among Instagram users is nearly balanced, with 50.6% identifying as male and 49.4% as female.
- Over 60% of users are aged 18 to 34.
- A significant 91% of Generation Z (ages 18-24) possess an Instagram profile.
- 32% of users are aged 35 or older, indicating a broad age appeal.
- India holds the highest number of users at 362.9 million, followed by the United States with 169.65 million.
- Instagram ad feed placements account for 53.7% of the platform’s total advertising revenue.
- Ads in Stories contribute 24.6% to the overall ad revenue.
- The cost-per-click (CPC) for Instagram ads is notably low, ranging from $0.00 to $0.25.
- 46% of companies incur a cost of $0 to $4 per 1000 impressions (CPM).
- The cost per engagement (CPE) varies between $0.03 and $0.08.
- Instagram ad campaigns typically achieve a conversion rate of 1-2%, with the most successful campaigns exceeding 3%.
- In terms of advertising objectives, brand awareness generates a 5-1% conversion rate, reach achieves a 3-0.8% conversion rate, and app installs achieve an 8-1.5% conversion rate.
- Brands have increased their usage of reels by 12% from 2023 to 2024.
- Instagram’s audience expanded by 25.3% year over year in early 2024.
- Instagram is ranked as the third most utilized social media platform worldwide, boasting approximately 2 billion monthly active users.
(Source: socialmediacurve, wp-content)
Instagram Marketing Trends
- Instagram has more than 2 billion active users each month.
- 62.7% of Instagram users engage with or research brands and products on the platform.
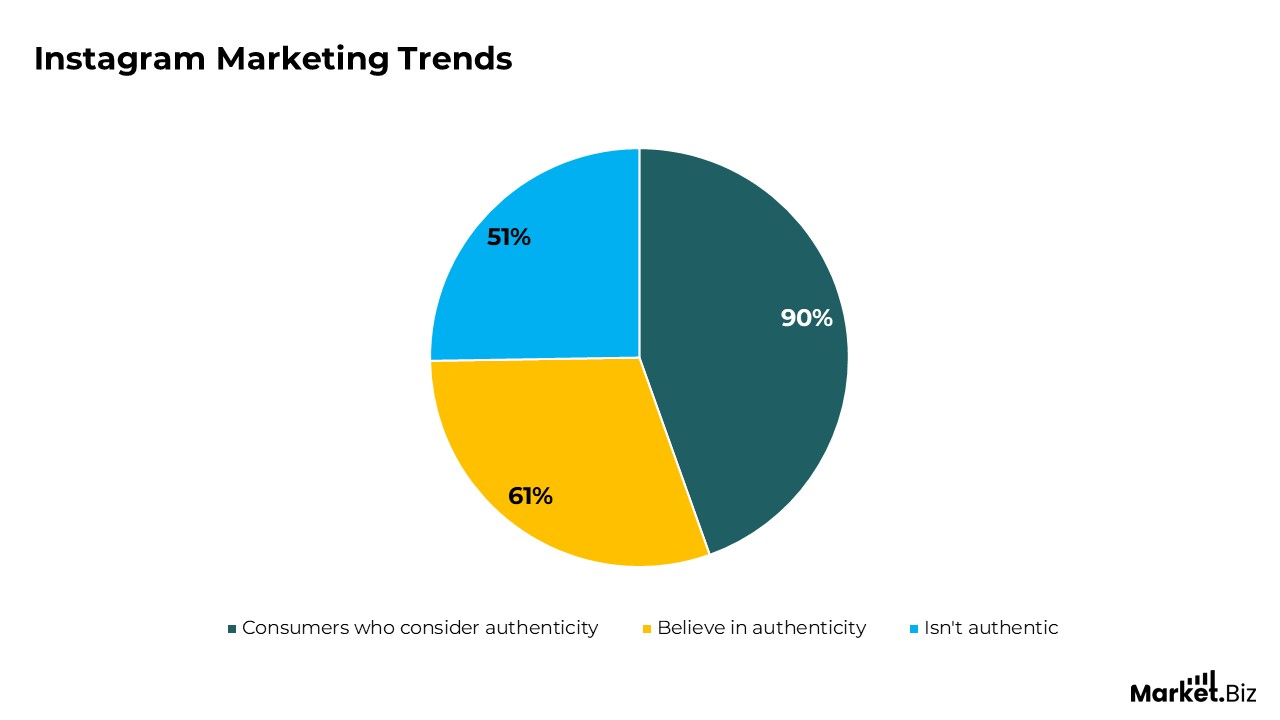
- A majority (51%) of Gen Z individuals globally prefer utilizing social media, including Instagram, for brand, product, or service research rather than search engines.
- There are more than 200 million business accounts on Instagram.
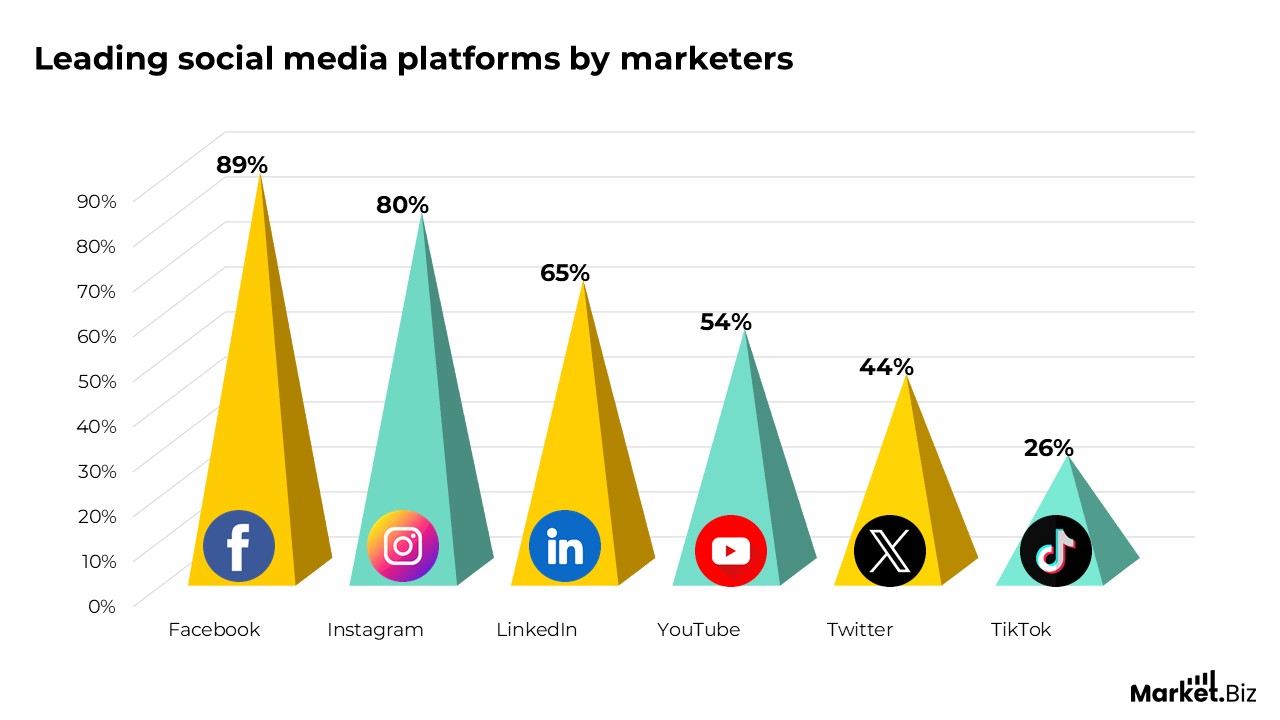
- 80% of marketers around the world are currently utilizing Instagram.
- 8.42% of all Instagram users possess over 50,000 followers.
- 76.37% of Instagram users have fewer than 10,000 followers.
- Adult users in the U.S. who access Instagram at least once a month spend an average of 33.1 minutes per day on the app.
- Instagram ranks as the second most utilized social media platform among marketers, following Facebook.
- More than 90% of Instagram users follow at least one business.
- Instagram users spend half their time watching reels, making it a leading content format.
- Video posts generate 49% more engagement compared to static images.
- 70% of Instagram users interact with Stories daily, providing brands with an engaging method to connect.
- Posts that include 11 or more hashtags experience up to 70% greater engagement.
- Over 1 million businesses utilize Instagram advertisements, achieving an average engagement rate of 1.08%.
(Source: framerusercontent)
Influencer Marketing Statistics
- Compared to 2023’s $ 1.9 billion, Instagram influencer marketing reached $2.2 billion in 2023.
- On Instagram, 65.39% of users have around 1k-10k followers.
- The increase in partnerships with smaller influencers has led more brands to allocate less than $50,000 to influencer marketing.
- In 2023, 65% of brands adhered to this budget, and by 2024, this figure rose to 68.3%.
- 32% of marketers believe that Instagram is the most user-friendly platform for influencer marketing.
- This shift is primarily attributed to a rise in brands investing less than $10,000 in influencer marketing.
- This trend may be associated with the increasing utilization of nano-influencers, which has enabled seasoned marketers to reduce their expenditures.
- It could also suggest that emerging brands are venturing into influencer marketing with constrained budgets.
- Brands are increasingly drawn to smaller influencers due to their higher engagement rates and lower expenses.
- Around 64% of marketers have a partnership with micro influencers, and among them 47% stated to have succeeded in these collaborations, according to the 2024 Social Media Marketing Report.
- Furthermore, the emergence of Influencer Marketing Agencies has enabled brands to manage influencers on a broader scale.
- Nevertheless, micro-influencers are not the sole category of small influencers that attract brand interest.
- According to Instagram Marketing Statistics 2024, a growing number of brands are opting for nano-influencers.
- Currently, 44% of brands favour collaborating with nano-influencers, whereas the proportion of brands selecting micro-influencers has declined from 30% to 25.7%.
- The State of Marketing Report 2024 further corroborates that 43% of brands are reallocating their budgets towards smaller influencers.
| Influencer Type | # of Followers |
|---|---|
| Micro-Influencer | Under 15,000 Followers |
| Regular Influencer | 15,000 to 50,000 Followers |
| Rising Influencer | 50,000 to 100,000 Followers |
| Mid-Influencer | 100,000 to 500,000 Followers |
| Macro Influencer | 500,000 to 1,000,000 Followers |
| Mega Influencer | Over 1,000,000 Followers |
Instagram Brand Statistics
- Sports brands made around 18 posts on average per week on Instagram.
- Media brands made an average of 12.2 posts per week on Instagram.
- Beauty brands made an average of 6.8 posts per week on Instagram.
- Fashion brands made around 6.1 posts on an average weekly basis on Instagram.
- Retail brands made around 5.7 posts on an average weekly basis on Instagram.
Top Brands on Instagram 2025
- Nike: 300 million
- Natgeo: 278 million
- FC Barcelona: 141 million
- Zara: 62.3 million
- Dior: 46.8 million
- Hm: 38.4 million
- Shein: 36 million
Instagram Engagement Statistics
- In 2024, the typical Instagram post gathered an average of 15.66 comments, 513.37 likes, and 19.79 saves.
- This means an increase in comments compared to the previous year, highlighting the rising trend of interactive content. Although saves declined slightly from 20.28 in 2023 to 19.79 in 2024, they remain an important indicator of valuable content.
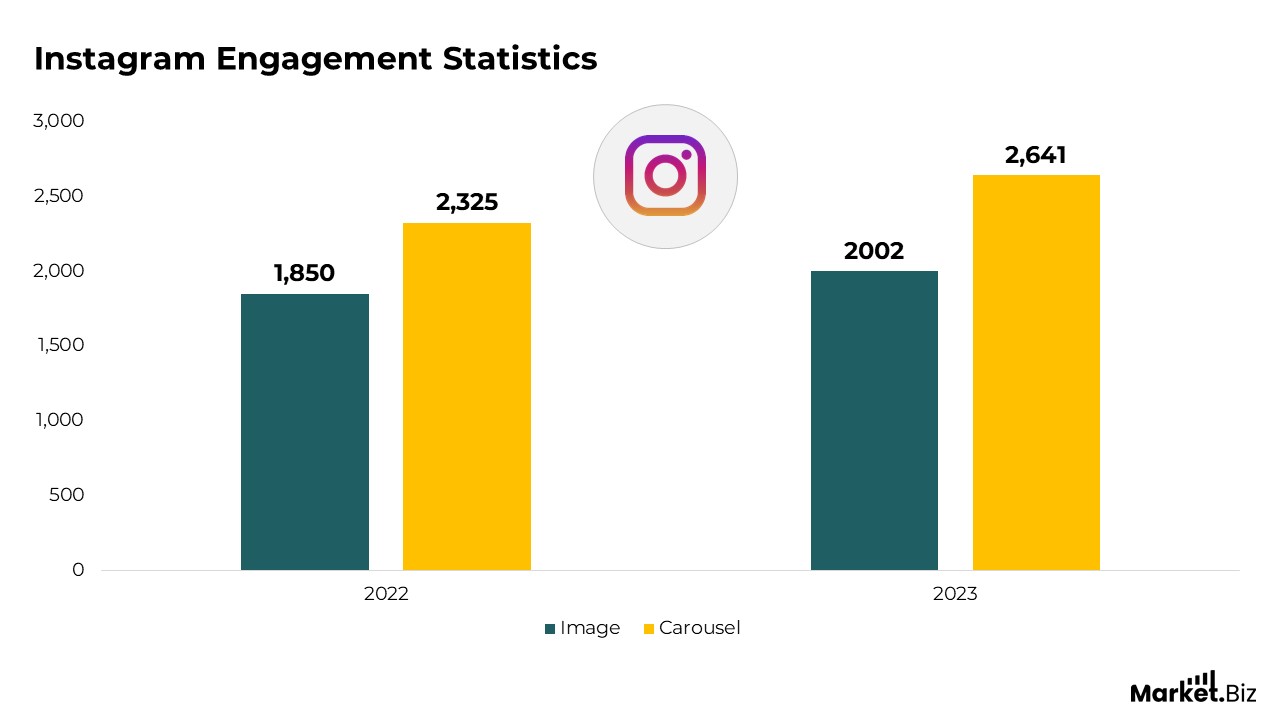
- Carousels, which involve multiple images or videos within a single post, achieved an average reach of 2,641 users, greatly surpassing single image posts that averaged 2,002 users.
- The overall engagement rate across all sectors on Instagram is 0.43%, while the higher education sector excels at 2.43%. This highlights the necessity for customized content strategies custom-made to specific industries.
- Instagram users have increased their video viewing time on the platform by 80%. If you have not yet combined video into your strategy, now is the opportune moment to do so.
- The most successful posts on Instagram utilize an average of 5.44 hashtags. This data indicates that hashtags continue to be a necessary tool for enhancing discoverability and broadening reach.
- Posts that include faces outperform those that do not by 38%. Whether through candid images, selfies, or customer testimonials, featuring faces creates a sense of connection and relatability, making these posts more engaging for the audience.
(Source: onlysocial, wp-content)
Engagement Rates by Industry
- According to the data, the education sector is at the top in terms of engagement at 8.4%.
- Followed by travel & healthcare sector at 7.9%.
- Next up is retail brands, which rank at 7.8% in terms of engagement.
Industry-Specific Reach Rates:
- In terms of reach rate, Instagram creators peak with 32.6%.
- Travel sector ranks at 2nd with a 21.4% reach rate.
- Next up is the ports sector with a 19.7% reach rate.
Collaborations & Mentions Impact
- On Instagram, posts that engaged with 4-5 collaborators can get 3.8x more visibility.
- Among brands, arts& entertainment leads with 23.4%.
- Travelling brands rank at 2nd at 20.2%.
- According to Instagram’s data, photos with faces perform 38% better as compared to photos without faces.
- Instagram videos perform 21.2% better as compared to photos.
- Around 2.35 billion people engaged with Instagram reels in a month.
Instagram Posting Strategy
- According to most studies, the best time to post something on Instagram is considered to be between 7 am to 9 am on weekdays.
- Posts with tagged locations perform 79% better in engagement as compared to posts without tagged locations.
- According to a survey, 20% of Instagram users post stories on their business account at least once a week.
- According to a survey, 44% of Instagram users use the platform to promote products or services.
- 1 out of 3 of the most viewed stories comes from businesses.
- Over 25 million businesses use the platform to find leads, reach potential customers, and engage them.
- According to a study, most US marketers (69%) are considering allocating their influencer budget to Instagram.
- Healthcare was the sector with the highest cooperation efficiency with Instagram influencers.
- In terms of following brands on social platforms, no one can beat Instagram currently.
Hashtags Statistics
- Amazingly, research from top firms indicates that there is no clear link between hashtags and increasing engagement on a post.
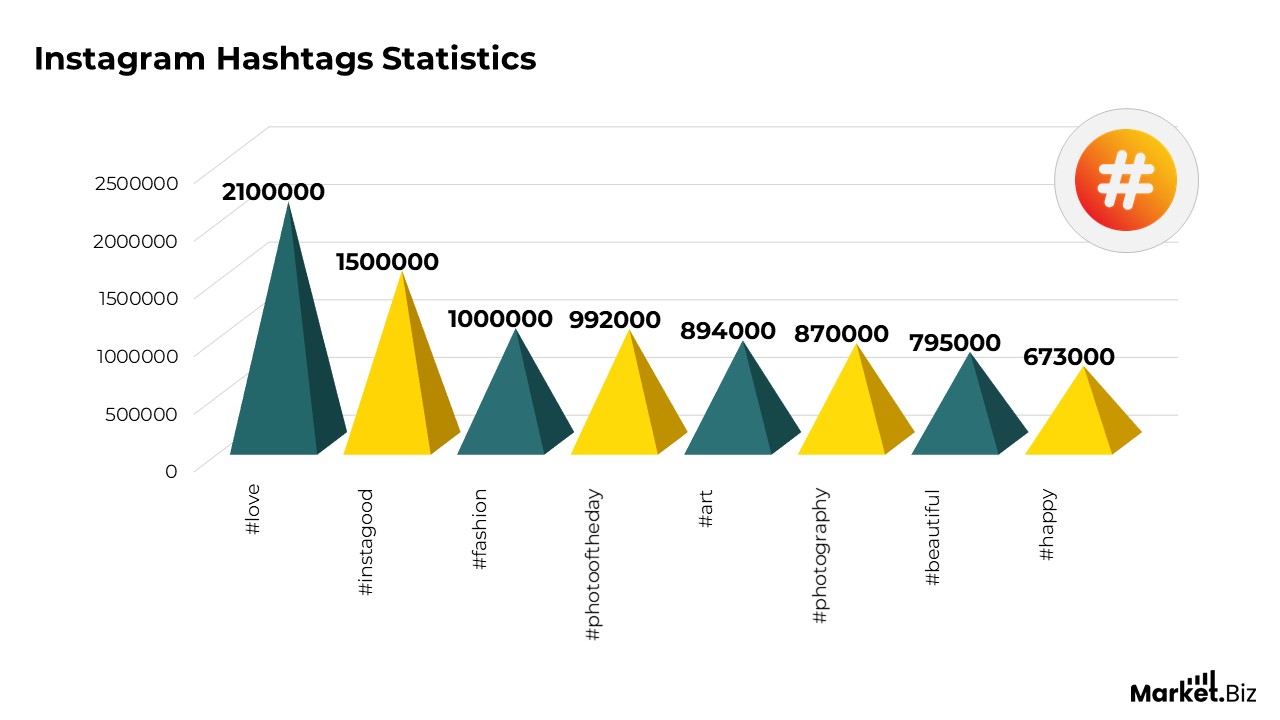
- Other popular hashtags include #love with 2.1 billion, #instagood with 1.5 billion, #art with 894 million, #happy with 673 million, #picoftheday with 720 million, #beautiful with 795 million, #follow with 695 million, #photography with 870 million, #photooftheday with 992 million.
- 70% of the hashtags available on Instagram are directly or indirectly connected to brand campaigns, according to the Instagram marketing statistics.
- Hashtags can also be useful: users reported that using 1 hashtag can increase engagement by 29%, and using 11 hashtags can increase engagement by 79%.
- On the other hand, using too many hashtags can also reduce engagement. According to reports, using over 6 hashtags can reduce engagement.
Instagram User Behaviour Statistics
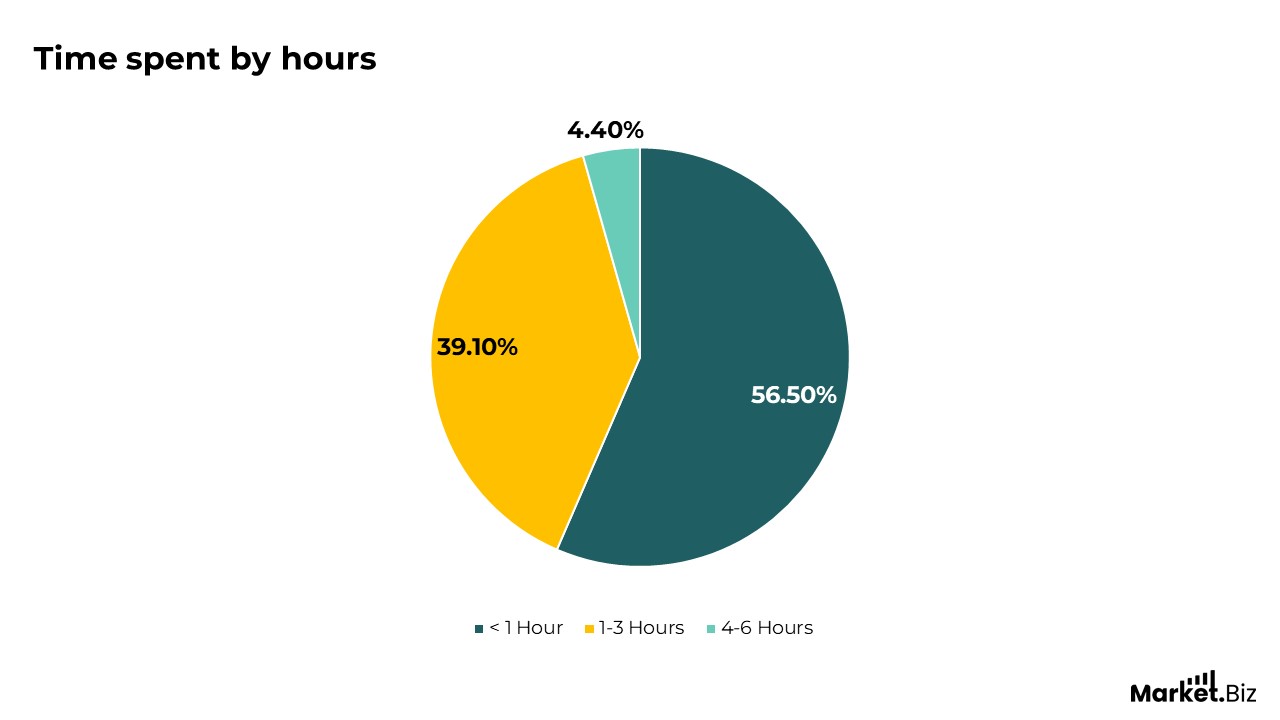
- Young teens spend almost 53 minutes on Instagram every day.
- The average time spent on social media is 2 hours and 27 minutes worldwide. Instagram offers a chance to the 1.4 billion users worldwide to connect regularly.
(Source: clearvoice, wp-content)
- On average, Instagram posts contain approximately 10.74 hashtags. Although hashtags originated on Twitter, they have become important on Instagram for brands to reach a wider audience. Nearly half of all posts feature fewer than six hashtags.
- More than 1,100 images are uploaded to Instagram every second, highlighting the platform’s high user activity.
- In 2020, Instagram achieved over 503 million downloads globally, ranking fourth among the most downloaded applications.
- In the United States, it was the third-most-favoured app, with 62 million downloads, trailing only TikTok.
(Source: clearvoice, wp-content)
- In the United States, around 43% of teens prefer WhatsApp, 35% prefer Snapchat, and 22% prefer Instagram, making Instagram the 3rd-most-liked social media platform among teens.
- TikTok is also very preferred among teens and is expected to surpass Snapchat.
- 57% of millennials discover trending fashion trends through Instagram, reported by Instagram Marketing Statistics.
- Moreover, 82% of millennials purchase a product instantly if they like it upon first seeing it.
- Millennials are very straightforward about their values, with 83% wanting to buy from brands that respect and reflect them. This indicates the importance of brand value for brands.
Average Time Spent on Instagram
- Most Instagram Android users worldwide spend an average of 32.4 minutes every day and almost 16 hours and 13 minutes per month on the platform.
(Source: backlinko)
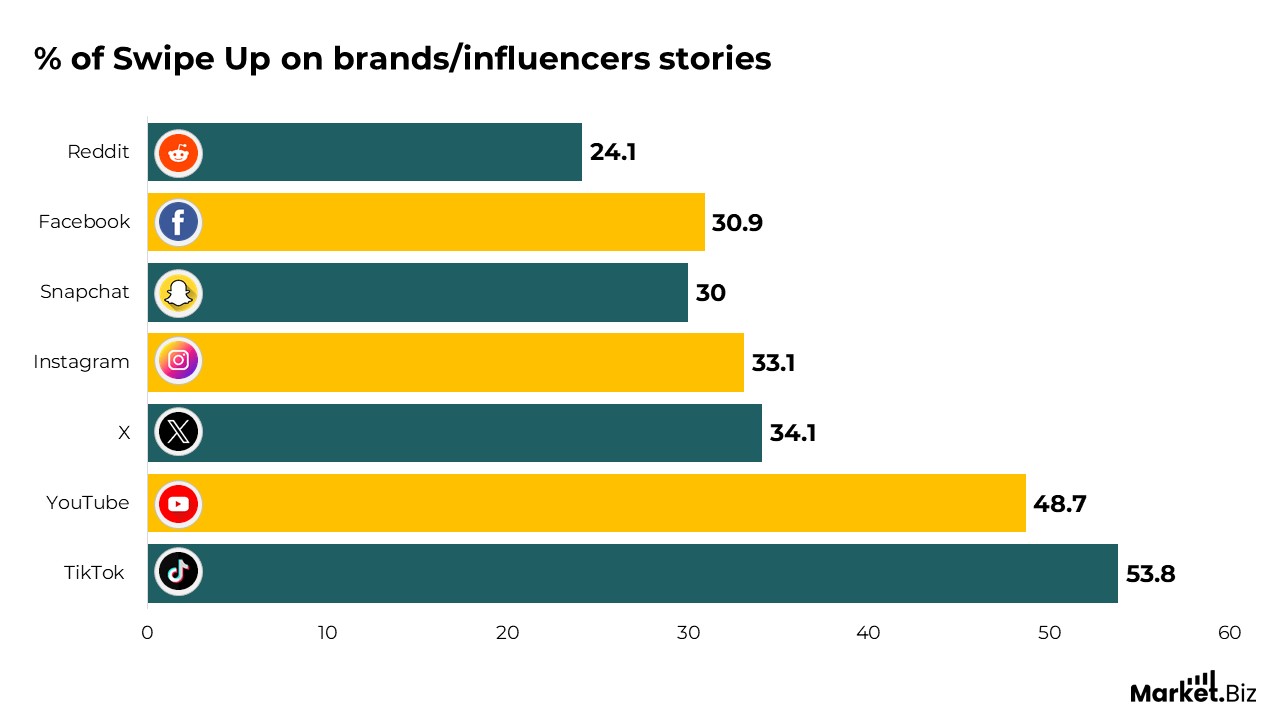
- In the United States, the average time spent on Instagram per day is 33.1 minutes among users aged over 18.
- Though the numbers are strong enough, Instagram is behind TikTok, YouTube, and X.
- According to studies, in the United States, users aged between 18-24 spend the most time on Instagram, almost 53 minutes a day.
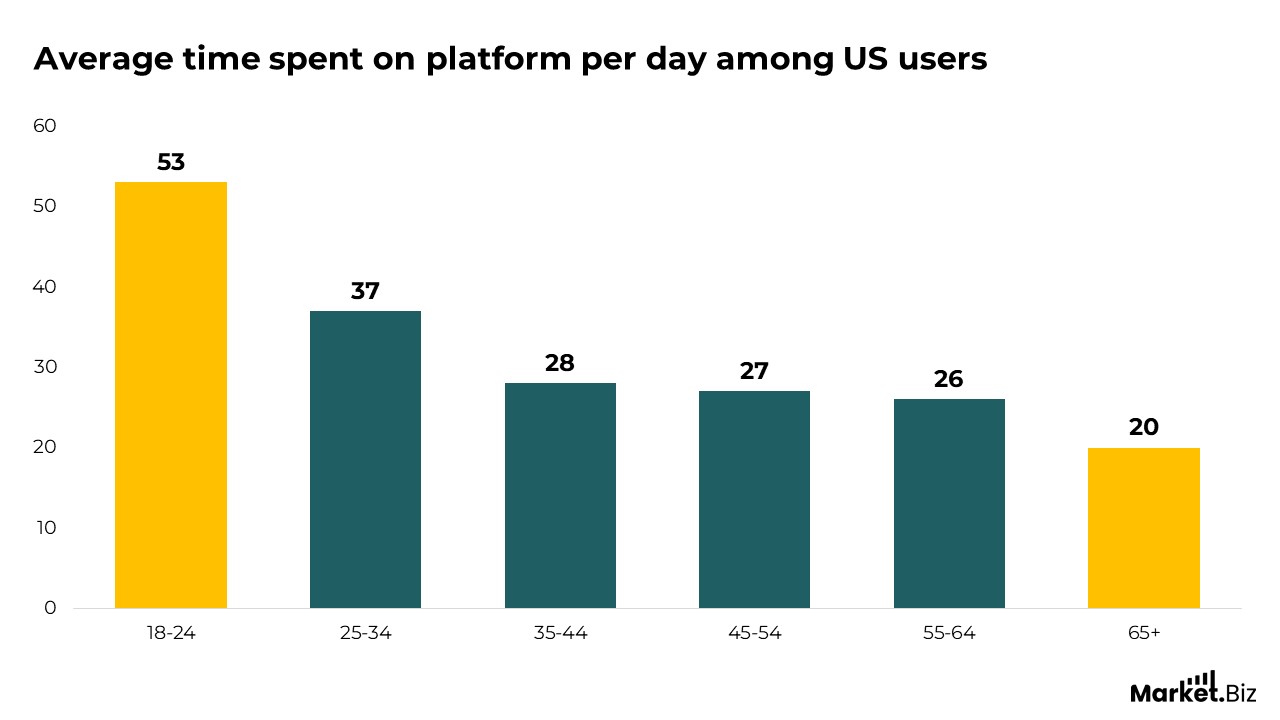
(Source: backlinko)
Best Times to Post on Instagram
- On Mondays, the best time is between 11 am and 2 pm.
- On Tuesday, the best time is between 10 am and 1 pm.
- On Wednesday, the best time is considered to be between 10 am and 1 pm.
- On Thursday, the best time is considered to be between 9 am and 11 am.
- On Friday, the best time is considered as between 10 am to 11 am.
- On Saturday, the best time is considered to be between 10 am and 11 am.
- On Sunday, the best time is considered as between 10 am to 11 am.
Instagram Video Marketing Statistics
- Live videos on Instagram receive 6 times more comments and 8 times better reactions than regular videos.
- Livestream shopping sessions on Instagram generate 9 times the revenue as static product posts.
- According to 63% of users, they prefer brands that use live video to showcase or promote.
- In terms of purchase, shoppable videos have a 52% higher purchase rate than static product posts. It can create the opportunity to turn viewers into buyers.
- 83% of Instagram users want to see more shopping-related content to increase the number of sales.
Conclusion
Overall, Instagram marketing is growing exponentially and quickly becoming an essential tool for businesses of all sizes and types worldwide. It has over 2 billion monthly active users, which creates a huge opportunity for you to tap into unlimited potential to fill your funnel and convert new leads. Over 70% of users say they discover new products on Instagram, meaning the platform can boost your brand’s visibility.
As users become more engaged with all of Instagram’s content formats, like stories, reels, and influencer marketing, businesses will lead to heightened customer engagement, interaction, and sales. As behaviour continues to shift towards video and mobile content, Instagram will remain a premier destination for marketers. Brands that leverage Instagram wisely and invest their time and budget towards good Instagram piloting will likely see great success for the long run.
FAQs
Instagram is visual, easy to use, and helps brands connect with people through stories, reels, and posts that grab attention quickly.
Instagram offers strong visual tools, shopping features, and high engagement, making it easier for brands to reach and connect with their audience.
People often like, comment, share, or save posts on Instagram. Many also message businesses directly or explore products through tags and stories.
Photos, short videos, behind-the-scenes clips, and user-generated content tend to perform well and keep followers interested
Yes, regular posting, authentic content, and direct communication through comments and DM’s help brands build loyalty and trust.