
Introduction
Instagram Engagement Statistics: According to the most recent statistics on Instagram engagement, the average engagement rate for all categories of posts made by business accounts stands at 0.56%. This figure evaluates the total likes and comments a post garners and contrasts it with the follower count of the account at the time of posting.
In simpler terms, this average engagement rate indicates that for every 10,000 followers an Instagram business account possesses, approximately 56 of them engage by either commenting on a post, liking it, or doing both. The majority of Instagram marketing professionals concur that a favorable engagement rate falls between 1% and 5%; however, as the follower count increases, achieving this rate becomes more challenging.
In 2025, the environment has changed considerably, with new formats, content styles, and tiers of creators shaping the definition of success. Micro and Nano influencers are surpassing celebrities in terms of interaction metrics, while Reels continue to excel beyond static posts.
Editor’s Choice
- For 80% of businesses, the engagement rate on Instagram is regarded as the most vital metric on this social media platform.
- Influencers with more than 100,000 followers experience the lowest engagement rate on Instagram, which stands at just 1.7%.
- Engagement rates peak for users with fewer than 10,000 followers, who enjoy an average engagement rate of 0.74% on Instagram.
- The typical engagement rate for photo posts on Instagram is 0.50%.
- For brands operating in the sports and non-profit sectors, the average engagement rate on Instagram is 2.40%.
- On average, sports teams publish 18 posts weekly on Instagram.
- Media brands, on average, create 12.2 posts each week on Instagram.
- 18% of adults in the U.S. expressed a preference for Instagram Live when it comes to livestream shopping.
- Instagram Reels advertisements have the potential to reach more than 675 million individuals.
General Instagram Engagement Statistics
- For 80% of businesses, the engagement rate on Instagram is regarded as the most vital metric on this social media platform.
- The overall average engagement rate on Instagram stands at 4.7%, although the average engagement rate per post varies across different industries.
- Instagram’s engagement rate benchmark is categorized into four distinct levels. Posts with an engagement rate below 1% are classified as having low engagement.
- Posts that achieve an engagement rate between 1% and 3.5% are deemed to have an average or good engagement rate on Instagram.
- Subsequently, posts with an engagement rate ranging from 3.5% to 6% are recognized as having a high engagement rate, while posts exceeding a 6% engagement rate are categorized as having very high engagement.
- Typically, an average Instagram post includes at least one hashtag. However, utilizing more hashtags in a post tends to reduce the average engagement rate on Instagram.
- Video posts on Instagram generate twice the engagement compared to photo posts. Among users who share a video, 50% receive a minimum of four comments per video post.
- Despite the fact that excessive tagging can diminish engagement rates, 60% of all posts on Instagram include at least one hashtag.
- The engagement rate for Instagram stories is assessed using different metrics than those for standard posts: replies, reach, and reactions to captions.
- On a global scale, Greece boasts the highest average influencer engagement rate on Instagram, recorded at 5.17%.
- Conversely, Kazakhstan holds the lowest average engagement rate on Instagram worldwide, at merely 0.41%.
Instagram Influencer Engagement Statistics
- A recent study has quantified the decline in engagement among Instagram influencers with large followings. The average engagement rate for non-sponsored posts fell from 4.5% in 2016 to 1.9% in 2019.
- The highest engagement rate for tags is attributed to Gareth Bale, a footballer and influencer from Real Madrid, who garnered over 350,000 tags in 2019.
- Interestingly, the engagement rate for celebrities is actually below the average. For example, Kim Kardashian has an engagement rate of 1.28% on Instagram, despite having over 157 million followers.
- Influencers with more than 100,000 followers experience the lowest engagement rate on Instagram, which stands at just 1.7%.
- In contrast, influencers with 100,000 or fewer followers enjoy an average engagement rate of 2.4%.
- Accounts with fewer than 10,000 followers demonstrate a notably high engagement rate on Instagram, reaching 4%.
- Moreover, influencer accounts with 1,000 or fewer followers achieve an above-average engagement rate of 8% on Instagram.
- Overall, the average engagement rate for influencers on Instagram is 3%, although this figure varies across different follower categories.
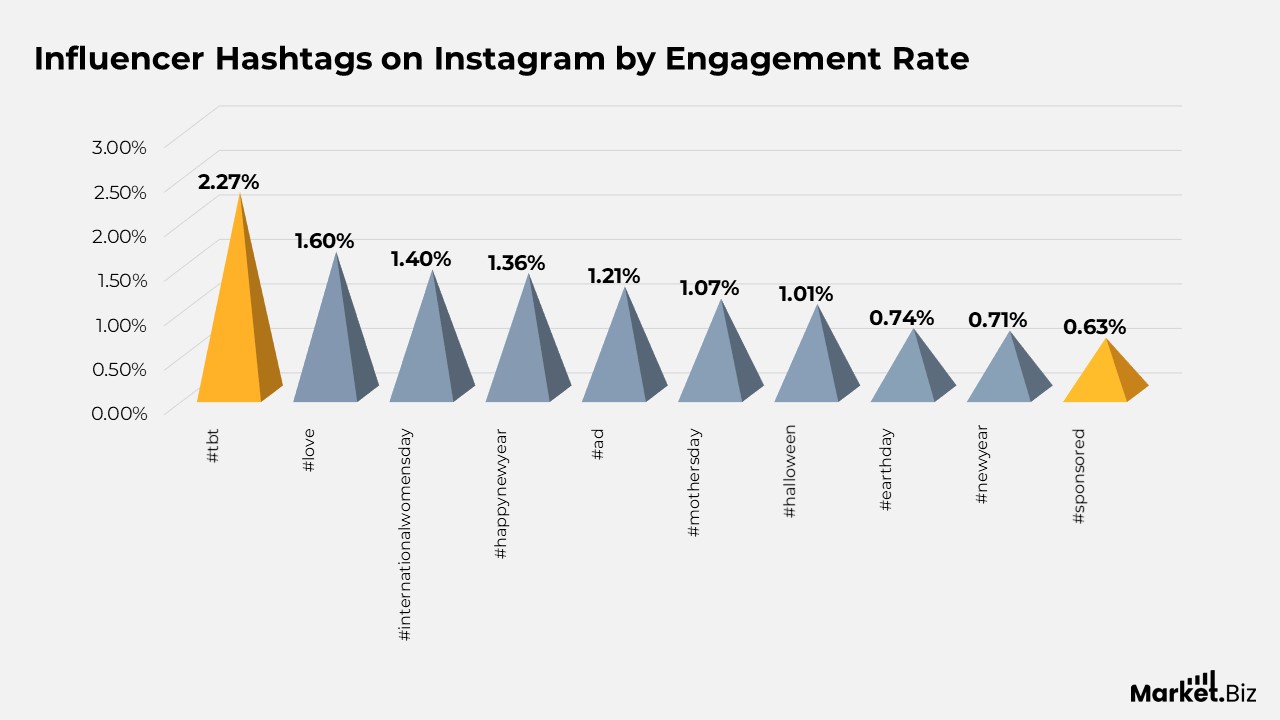
Influencer Hashtags on Instagram by Engagement Rate
- #tbt – 2.27%
- #love – 1.6%
- #internationalwomensday – 1.4%
- #happynewyear – 1.36%
- #ad – 1.21%
- #mothersday – 1.07%
- #halloween – 1.01%
- #earthday – 0.74%
- #newyear – 0.71%
- #sponsored – 0.63%
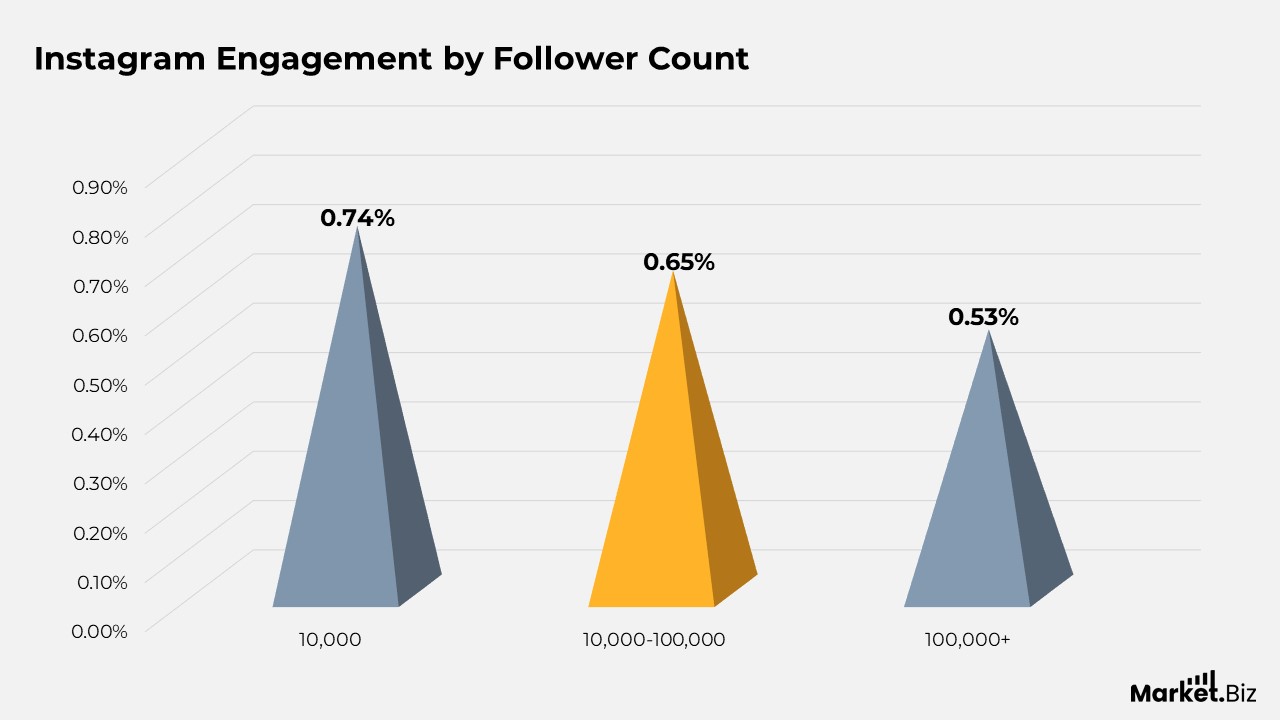
Instagram Engagement by Follower Count
- The overall trend suggests that an Instagram account’s engagement rate decreases as the number of followers increases.
- Engagement rates peak for users with fewer than 10,000 followers, who enjoy an average engagement rate of 0.74% on Instagram.
- This is succeeded by accounts that have between 10,000 and 100,000 followers, which experience an engagement rate of 0.65%.
- For users having more than 100,000 followers, this rate declines to 0.53%.
Instagram Engagement by Post Type
- The typical engagement rate for photo posts on Instagram is 0.50%.
- The typical engagement rate for video posts on Instagram is 0.55%.
- The overall average engagement rate for all types of posts on Instagram is 0.56%.
- Carousel posts demonstrate the greatest effectiveness in promoting user interaction. Up to 0.69% of Instagram users who view carousel posts actively engage with them.
- A study examining Instagram engagement statistics indicates that carousels using all 10 slides (the maximum allowed) generally achieve higher engagement rates.
- The quantity of slides incorporated in carousels also affects the average engagement rate for these Instagram posts.

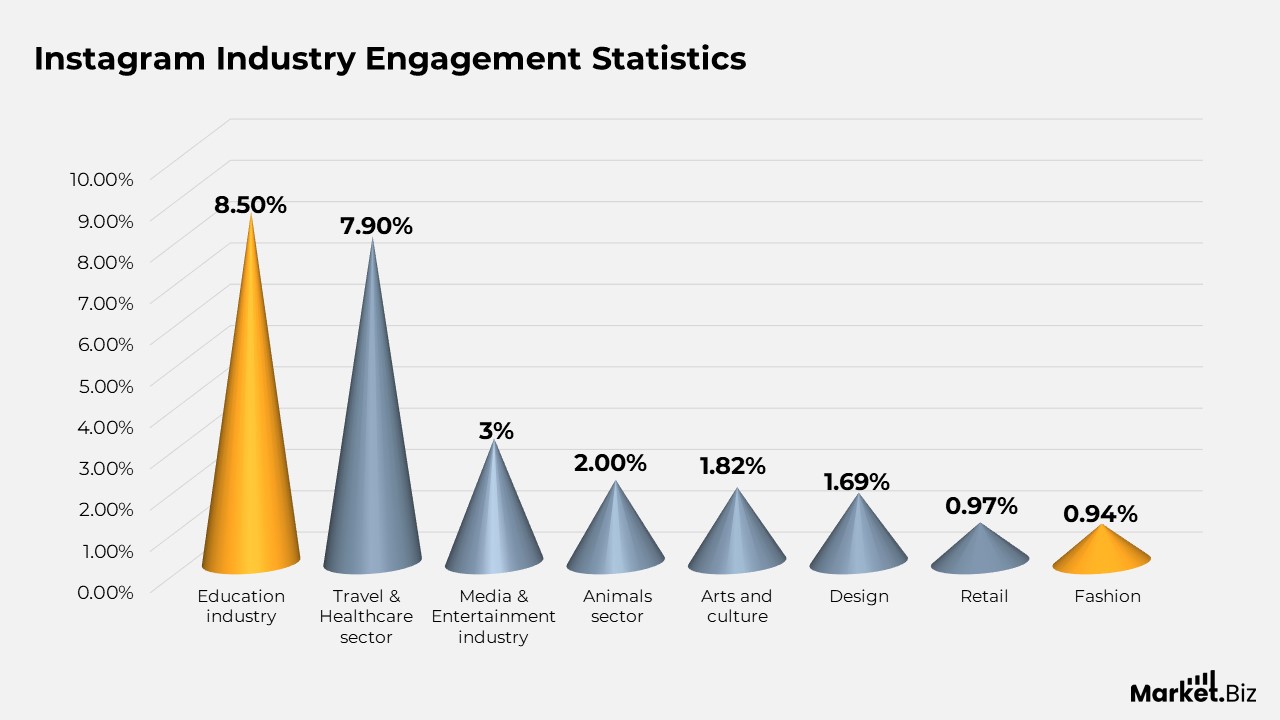
Instagram Industry Engagement Statistics
- The ideal time during the week to share posts on Instagram is Wednesday, as this day sees the highest engagement rate of 4.9%. On the other hand, Monday records the lowest engagement rate at 4.4%.
- In the retail sector on Instagram, the average engagement per post stands at 0.97%.
- Industries that achieve the highest engagement per post tend to post less frequently than their counterparts in other sectors.
- For brands operating in the sports and non-profit sectors, the average engagement rate on Instagram is 2.40%.
- The fashion industry has an average engagement rate of 0.94% on Instagram, marking it as the second-lowest rate among all industries.
- Overall, the average engagement rate across industries on Instagram is 1.9%.
- In 2025, engagement levels on Instagram are significantly influenced by niche and industry, with the animals sector (2.00%), arts and culture (1.82%), and design (1.69%) leading in user interaction.
- During the first quarter of 2025, beauty brands on Instagram experienced a 28% decline in earned media value, indicating a drop in engagement across prominent accounts.
- Nevertheless, creators such as Meg Murphy, who specializes in special effects content, managed to surpass this trend with an impressive engagement rate of 22.8%.
- The education industry on Instagram saw an engagement rate of 8.5%.
- The Travel & Healthcare sector on Instagram saw an engagement rate of 7.9%.
- The Media & Entertainment industry on Instagram saw an engagement rate of 3%.
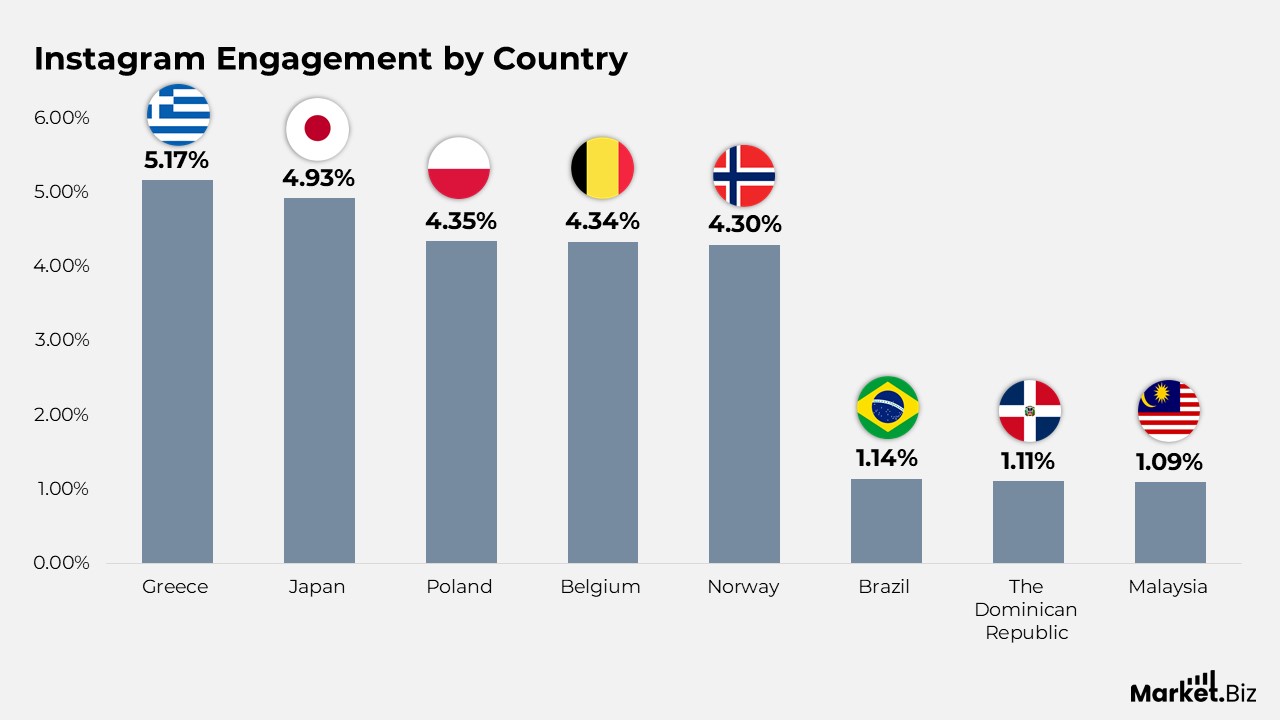
Instagram Engagement by Country
- Greece (5.17%) – In September 2019, Greece had 3,204,000 Instagram users, representing 28% of its total population.
- Japan (4.93%) – In September 2019, Japan recorded 26,794,000 Instagram users, which constituted 21% of its overall population.
- Poland (4.35%) – In September 2019, Poland had 6,757,000 Instagram users, accounting for 17% of its entire population.
- Belgium (4.34%) – In September 2019, Belgium had 3,396,000 Instagram users, which made up 29% of its total population.
- Norway (4.30%) – In September 2019, Norway had 2,200,000 Instagram users, representing 40% of its entire population.
- Brazil (1.14%) – In September 2019, Brazil had 71,840,000 Instagram users, which accounted for 33% of its total population.
- The Dominican Republic (1.11%) – In September 2019, the Dominican Republic had 2,836,000 Instagram users, representing 25% of its overall population.
- Malaysia (1.09%) – In September 2019, Malaysia had 10,980,000 Instagram users, which constituted 33% of its total population.
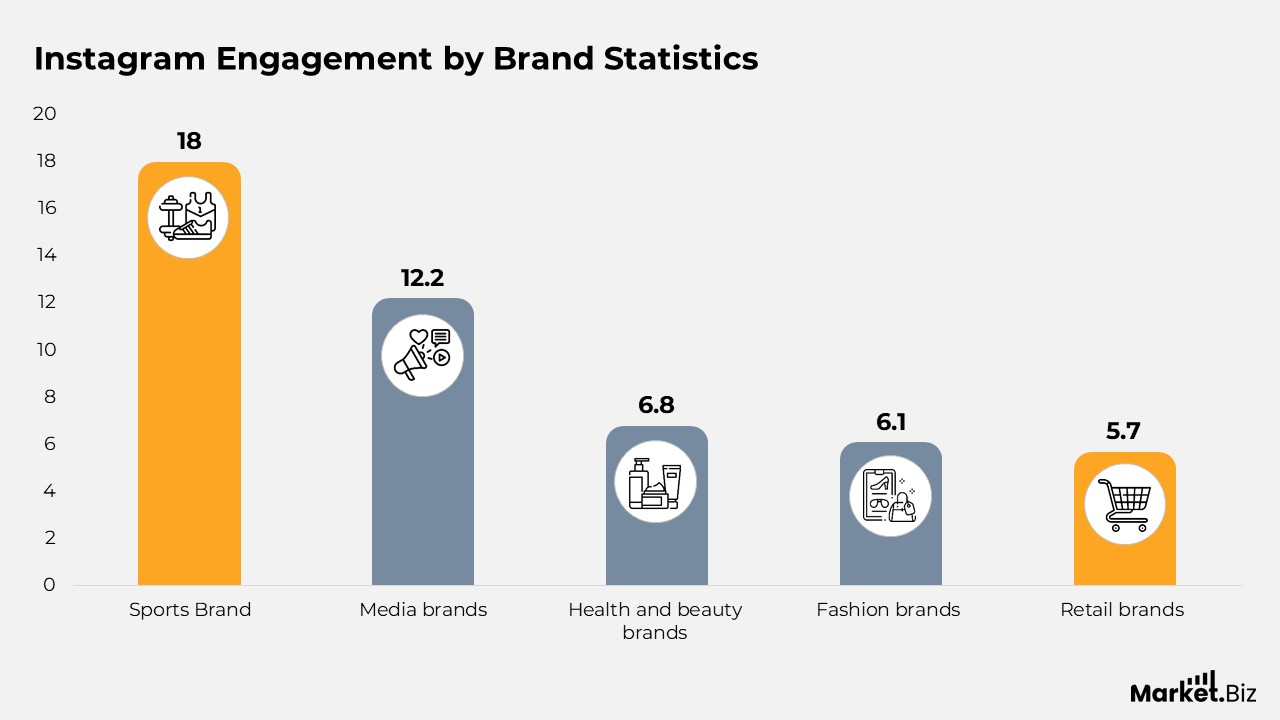
Instagram Engagement by Brand Statistics
- On average, sports teams publish 18 posts weekly on Instagram.
- Media brands, on average, create 12.2 posts each week on Instagram.
- Health and beauty brands typically post an average of 6.8 times per week on Instagram.
- Fashion brands average 6.1 posts weekly on Instagram.
- Retail brands generally make 5.7 posts on a weekly basis on Instagram.
Instagram Engagement by Live Statistics
- More than 100 million individuals view Instagram Live videos daily.
- Each day, 19 million posts are made on Instagram Live.
- Users aged 18-24 account for 82% of the audience watching Instagram Live events.
- 46% of individuals use Instagram for shopping through livestreams.
- 38% of marketers favour Instagram Live for hosting live video events and experiences.
- In the past month, 37% of Gen Z social media users have engaged with livestreams on Instagram.
- 22% of Internet users rely on social media platforms such as Instagram and Facebook to view livestreams.
- 18% of adults in the U.S. expressed a preference for Instagram Live when it comes to livestream shopping.
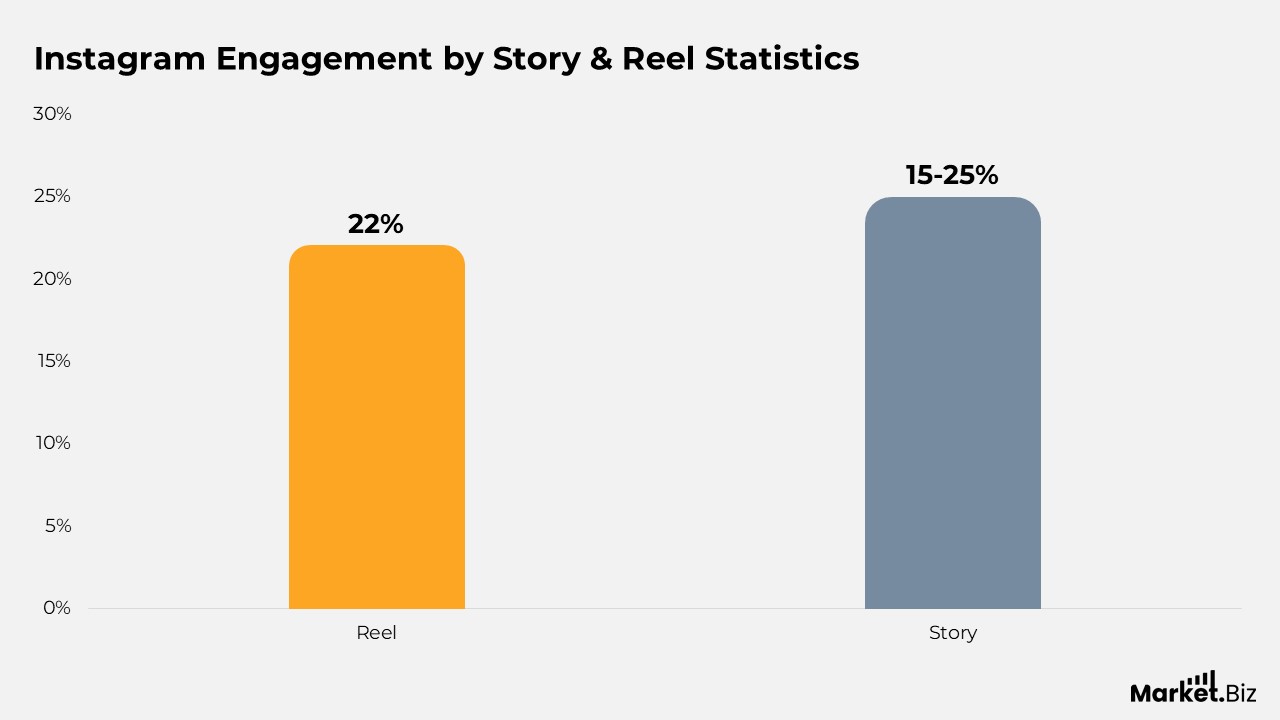
Instagram Engagement by Story & Reel Statistics
- Instagram Reels advertisements have the potential to reach more than 675 million individuals.
- With over 100 million people engaging with live videos each day and 140 billion views of Reels daily, video content is developing greater audience interaction compared to static images.
- Among all types of video content, Reels receive 22% more engagement than traditional video posts.
- Approximately one-third of the most popular stories originate from business accounts, highlighting the significance of stories in brand marketing.
- Nearly 15-25% of viewers of branded stories swipe up to access links, showcasing substantial engagement potential.
- Generally, the most active 25% of brands post Stories approximately every other day, totalling around 17 posts monthly. In contrast, the least active 25% of brands share just over one Story each week.
Instagram Collaboration Impact on Engagement
- Posts featuring 4 to 5 collaborators engage 3.8 times a larger audience.
- Brands in Arts & Entertainment dominate in mentions, accounting for 23.4%.
- Travel brands are not far behind, with a share of 20.2%.
- Images that include faces achieve nearly 38% higher performance than those that do not.
- Instagram Videos receive 21.2% greater engagement than images.
- Each month, 2.35 billion users engage with Instagram Reels.
Conclusion
Measuring engagement rates on Instagram can be challenging, as averages fluctuate based on various factors such as the number of followers, the geographical location of the audience, and the specific industry. Nevertheless, a reasonable benchmark to strive for is likely between 2-5%. Achieving an engagement rate within this range typically indicates above-average performance.
FAQs
Engagement rate refers to a metric that assesses the degree of interaction a piece of content garners from its audience on social media platforms such as Instagram. It is determined as a percentage by dividing the total number of likes and comments on a post by the overall number of followers, followed by multiplying the result by 100. Determining the engagement rate on Instagram is relatively straightforward.
To compute engagement, one generally divides the total number of engagements (likes, comments, shares, etc.) by the total number of followers or reach, and subsequently multiplies by 100 to obtain a percentage. This calculation offers insight into how actively your audience engages with your content. While various platforms may have slightly different metrics to take into account, the fundamental calculation remains consistent.
No, Instagram does not permit users to see who has viewed their profile. This is a privacy feature that Instagram has established, and it applies to all account types, including personal, business, and creator profiles, as noted by a social media management platform, Project Social. Although Instagram provides engagement metrics for stories and posts, it does not include a feature to monitor profile visitors.
As reported by Statista, the average Instagram account possesses 150 followers. The primary motivation for individuals to create an account on Instagram is to connect with friends and family, as well as to follow their favorite celebrities, sports teams, and interests.