
Introduction
Mobile Advertising Statistics: It is amazing how rapidly mobile advertisements have transitioned from mere “banner ads on applications” to a billion-dollar industry consuming a significant portion of marketing budgets. If you scroll through a feed for just 5 seconds, you will encounter at least three advertisements attempting to sell something that seems to understand you remarkably well.
The reality is that no one openly expected mobile ads to become this effective. Brands are investing heavily, and frankly, this is understandable; everyone is fixated on their smartphones. In 2020, global mobile ad expenditure reached approximately $276 billion, indicating a substantial shift from traditional media to mobile-centric strategies. In 2023, mobile ad spending had increased to an estimated $362 billion, illustrating the rapid transition to smartphone reliance.
This significant increase was propelled by a combination of short-form video content, social commerce, and app-driven user engagement.
Editor’s Choice
- In 2022, consumers spent $327 billion on mobile marketing, with projections indicating that this figure will reach $400 billion in 2024.
- By 2028, mobile is forecasted to contribute approximately $255.8 billion to the overall social media advertising market.
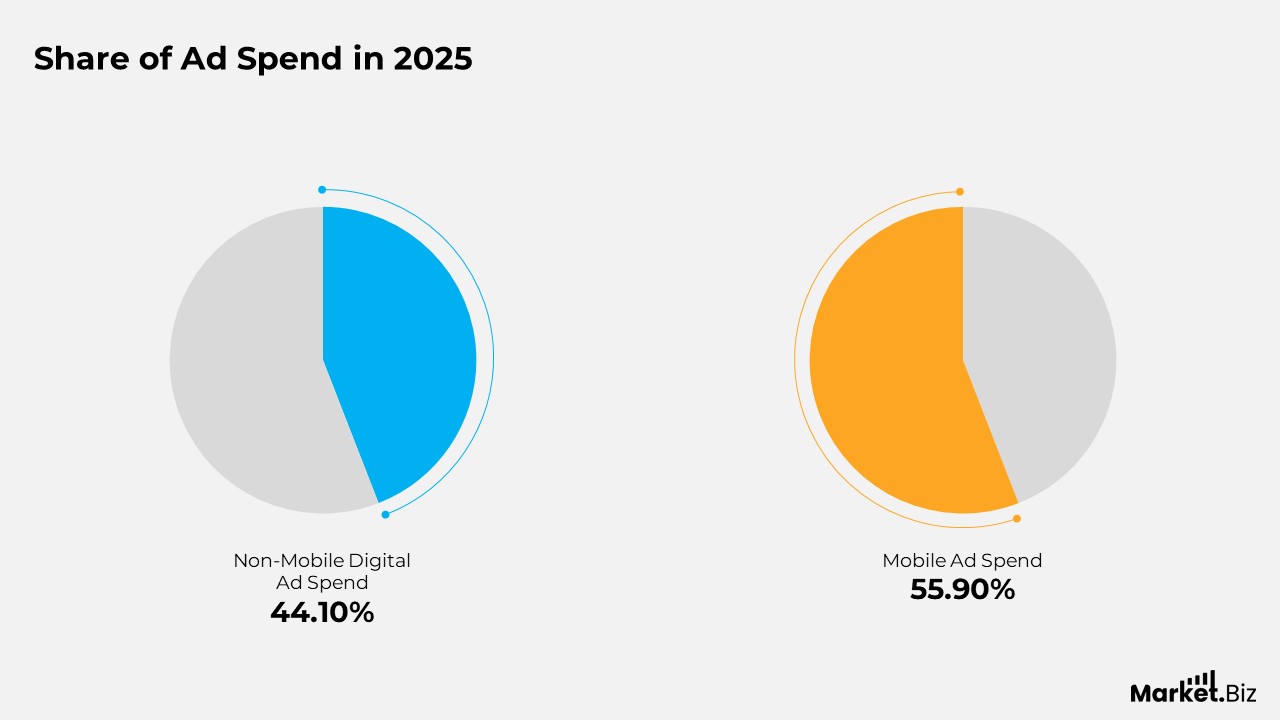
- From 2021 to 2025, the U.S. mobile advertising market is expected to grow by $83.1 billion, reflecting an overall increase of 57.3% and an average annual growth rate of 12%.
- Daily smartphone usage varies from 1 hour and 54 minutes to 5 hours and 20 minutes, depending on the market.
- 38% of marketing videos are produced using smartphone applications.
- Globally, mobile devices show the highest bounce rate at 52.11%, in contrast to desktop and tablet users.
- South Africa Mobile Advertising Market Sales Revenue $13.472 Billion
- Mobile users represent 75% of the overall traffic and contribute to 63% of sales on eCommerce platforms.
- Global social media advertising expenditure is anticipated to reach $433.28 billion by the year 2030.
General Mobile Advertising Statistics
- In 2022, consumers spent $327 billion on mobile marketing, with projections indicating that this figure will reach $400 billion in 2024.
- Mobile sales constitute 55.25% of total online sales, surpassing those made via desktop.
- In 2022, mobile accounted for 48% of business-to-business marketing in the United States, and it is anticipated to exceed 50% in 2024.
- By 2028, mobile is forecasted to contribute approximately $255.8 billion to the overall social media advertising market.
- Mobile devices generate 54% of all website traffic. If your website is not optimized for mobile users, you may be overlooking significant potential leads, even if you focus on desktop optimization.
- Marketers in the U.S. dedicate 19% of their advertising budget to mobile marketing.
- Approximately 61% of consumers are more inclined to purchase from websites that are mobile-optimized.
- As reported by Keywords Everywhere, search queries related to mobile advertising are highly sought after, indicating that marketers are eager to incorporate it into their strategies.
- A staggering 92% of individuals who conduct searches on their smartphones proceed to make a purchase linked to that search.
More Stats
- In 2025, SMS marketing in the United States is anticipated to reach a valuation of $12.6 billion, growing at an annual rate of 20.3%.
- Global digital advertising expenditure is projected to attain $870.85 billion by 2027.
- Global spending on social media advertising is expected to reach $433.28 billion by 2030.
- 31% of U.S. consumers report making purchases from online ads they encounter every few months.
- The U.S. mobile advertising market is predicted to exceed $200 billion for the first time in 2024, reaching $202.59 billion.
- In 2024, search advertising is expected to dominate mobile ad spending with $81.5 billion, followed by video advertising at $58.92 billion and banner advertising at $50.96 billion.
- From 2021 to 2025, the U.S. mobile advertising market is expected to grow by $83.1 billion, reflecting an overall increase of 57.3% and an average annual growth rate of 12%.
Mobile Usage Statistics
- In 2014, the total number of mobile users was 1 billion. Today, that figure has risen to nearly 5 billion and is projected to reach 6 billion by 2027.
- In the third quarter of 2023, individuals spend an average of 3 hours and 50 minutes online daily using their smartphones.
- Daily smartphone usage varies from 1 hour and 54 minutes to 5 hours and 20 minutes, depending on the market.
- In 2024, approximately 4.88 billion people are anticipated to own a smartphone, reflecting an increase of 635 million new users within the past year.
- Since 2020, the global number of smartphone users has more than doubled, with an addition of 2.61 billion new owners.
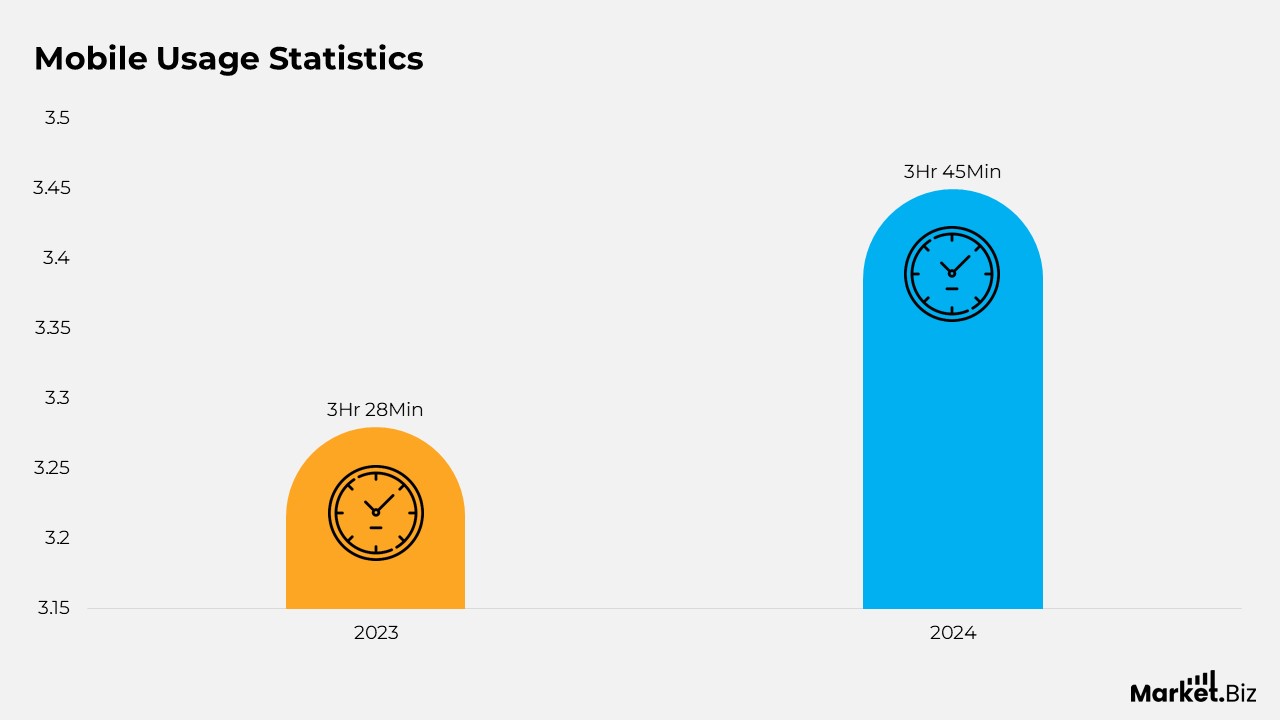
- In 2024, American adults (aged 18 and older) spent around 3 hours and 45 minutes each day on their smartphones, which is nearly an hour more than in 2019.
- Users are dedicating more time to mobile applications compared to web browsers. In the fourth quarter of 2023, the average time spent on mobile apps was 3 hours and 28 minutes, while web browsing accounted for only 51 minutes.
Advertising Spending Statistics
- The increase in mobile advertising expenditure can be attributed to a growing number of individuals using smartphones and interacting more with mobile content.
- By the year 2028, it is projected that 70% of total advertising expenditure will be allocated to mobile platforms.
- Paid mobile advertisements on YouTube are 84% more likely to yield effective results when compared to conventional television advertisements.
- Global expenditure on mobile advertising is anticipated to reach $402 billion in 2024, reflecting an 11% rise from the previous year. This surge is primarily fueled by income generated from short-form videos and video-sharing applications.
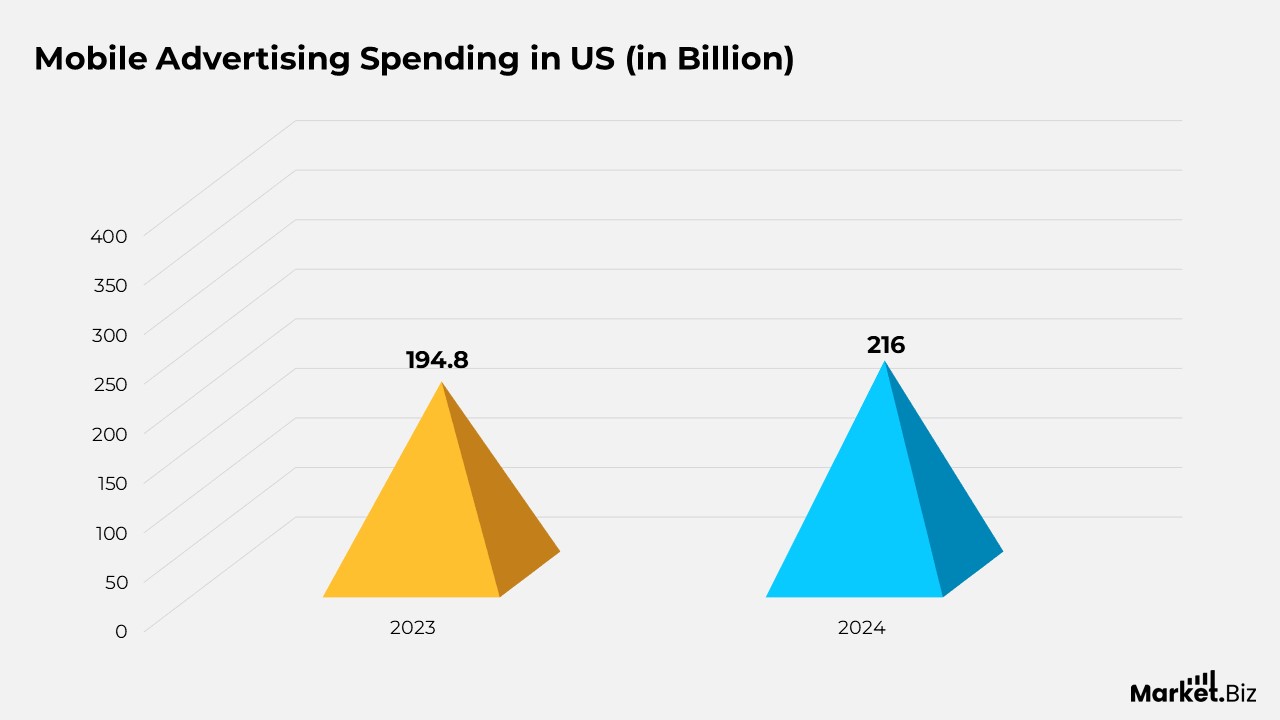
- In the United States, mobile advertising spending is forecasted to exceed $216 billion in 2024, an increase from $194.8 billion in 2023. Although this represents an 11.1% growth, it is somewhat slower than the 14.5% growth rate observed in 2023.
- The United States is at the forefront of global mobile advertising spending, with an annual expenditure surpassing $200 billion. China ranks as the second-largest market, investing nearly $150 billion each year in mobile advertisements.
Mobile Video Statistics
- YouTube continues to be a leading platform, with more than 500 hours of video uploaded every minute, and 70% of its content being viewed on mobile devices.
- Mobile devices are the preferred choice for viewing social media videos, with 92% of these videos being shared, highlighting their potential for virality.
- Facebook and Instagram also play significant roles in this space. Facebook records over 8 billion video views each day, while Instagram has seen an increase in video consumption, particularly with the introduction of reels.
- The popularity of shoppable video ads is on the rise, especially on platforms like Instagram, Pinterest, TikTok, and YouTube, where interactive videos can greatly enhance conversion rates.
- Mobile video advertising is becoming increasingly effective, with YouTube and TikTok being preferred by marketers due to their robust audience targeting and engagement capabilities.
- A significant portion of social media video consumption occurs without sound, as 92% of users watch videos on mute. This underscores the importance of captions for both accessibility and engagement.
- Short videos, particularly those lasting under 90 seconds, effectively capture viewers’ attention, making them a successful strategy for content creators.
- Approximately 75% of individuals prefer to watch videos in a horizontal format on mobile devices.
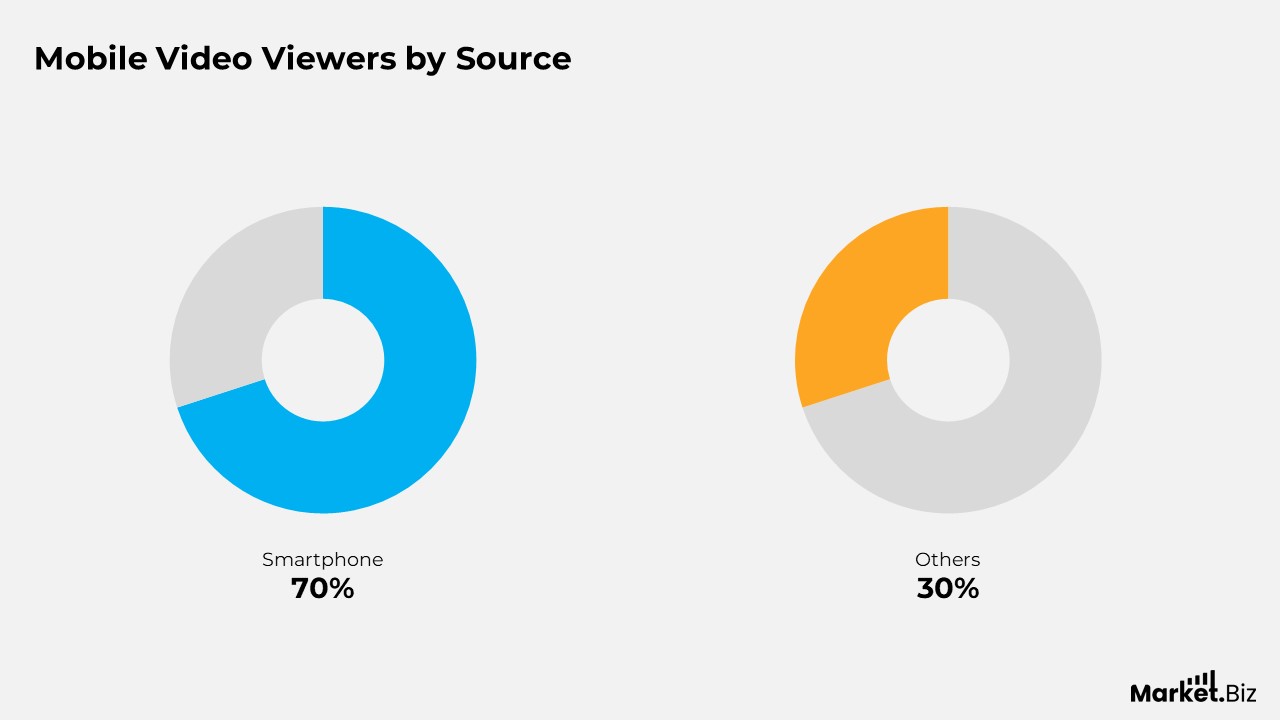
- 70% of individuals who view videos online do so via their smartphones.
- An impressive 92% of individuals who watch a video on a smartphone will share it with others.
- On X (formerly Twitter), 93% of video viewers access content through mobile devices.
- 77% of individuals who watch a video about an application ultimately download the app.
- 38% of marketing videos are produced using smartphone applications.
Mobile vs. Desktop Statistics
- In the United States, web traffic is nearly evenly divided between mobile devices (49%) and desktop computers (48%). A separate study indicates that 63% of online traffic originates from smartphones or tablets, underscoring the dominance of mobile.
- According to DataReportal, Americans dedicate approximately 4 hours daily to their desktops and 3 hours to their mobile phones.
- There are significant differences in the way mobile and desktop users engage with websites. On average, compared to mobile users (2.67), desktop users visit more pages (3.95) and tablet users (3.21).
- In terms of conversions, desktops maintain a leading rate of 3.7%, while mobile devices trail with a rate of 2.2%.
- Additionally, desktop users spend around 40% more time on websites than their mobile counterparts.
- Globally, mobile devices show the highest bounce rate at 52.11%, in contrast to desktop and tablet users.
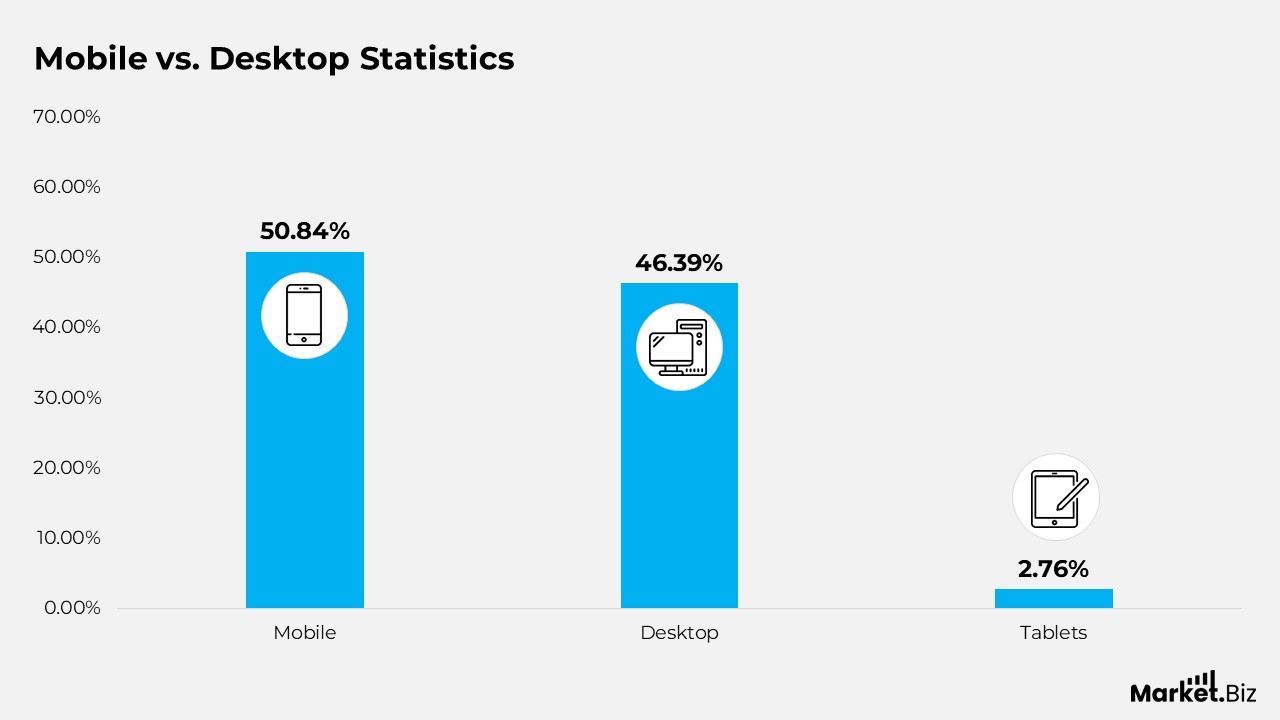
- Mobile devices account for 50.84% of all online visits worldwide, whereas desktops represent 46.39% and tablets only 2.76%. This confirms the predictions of experts regarding mobile’s eventual dominance over desktop.
Shopping Statistics
- In 2024, it is anticipated that over 187 million individuals in the United States will engage in mobile shopping, representing 66% of the American population who will have purchased their mobile device.
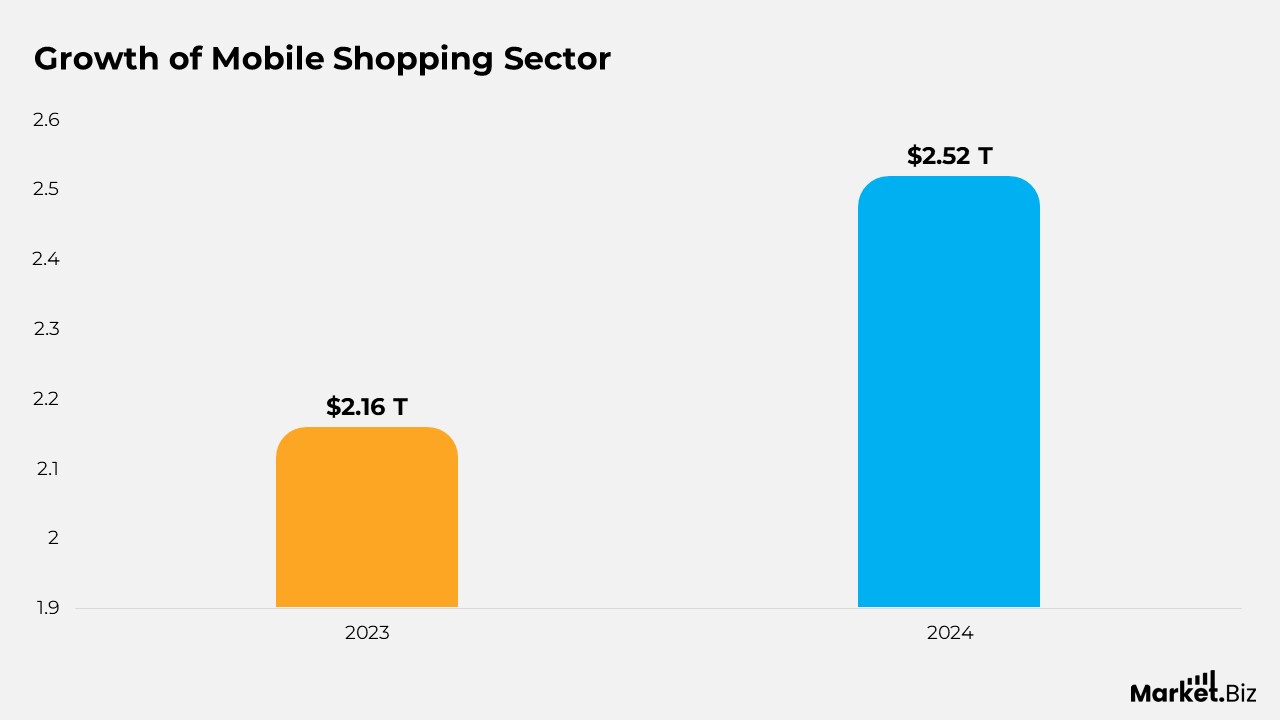
- The mobile commerce sector (mCommerce) is experiencing significant growth, with projections indicating that sales will soar to an impressive $2.52 trillion in 2024. This marks a 16.3% increase from the $2.16 trillion recorded in 2023.
- On iOS, Amazon Shopping stands out as the leading mobile commerce platform, boasting approximately 20.8 million daily active users.
- Despite the convenience of mobile shopping, desktop users continue to exhibit a higher conversion rate of 3%, compared to 2% for mobile users.
- Mobile shoppers predominantly utilize their devices for price comparisons (49%), redeeming mobile coupons (40%), and gathering information about products of interest (30%).
- Shopping applications are expanding at a rate surpassing that of other applications, with user engagement levels 48% higher than the average app.
- A notable 55% of users have completed a purchase after discovering a product on social media, underscoring the influence of social media on consumer purchasing decisions.
- Dedicated mCommerce applications are favored for mobile shopping, accounting for 54% of all mobile commerce transactions.
- Data trends from Keywords Everywhere indicate that the search volume for mobile commerce has remained stable over the past year, with no significant fluctuations.
- Furthermore, 61% of consumers express a preference for retailers that provide augmented reality (AR) experiences, reflecting an increasing interest in interactive shopping.
- Voice search is gaining traction within mobile commerce, with 27% of searches conducted on mobile devices now being voice-activated.
Mobile Advertising by Country Statistics
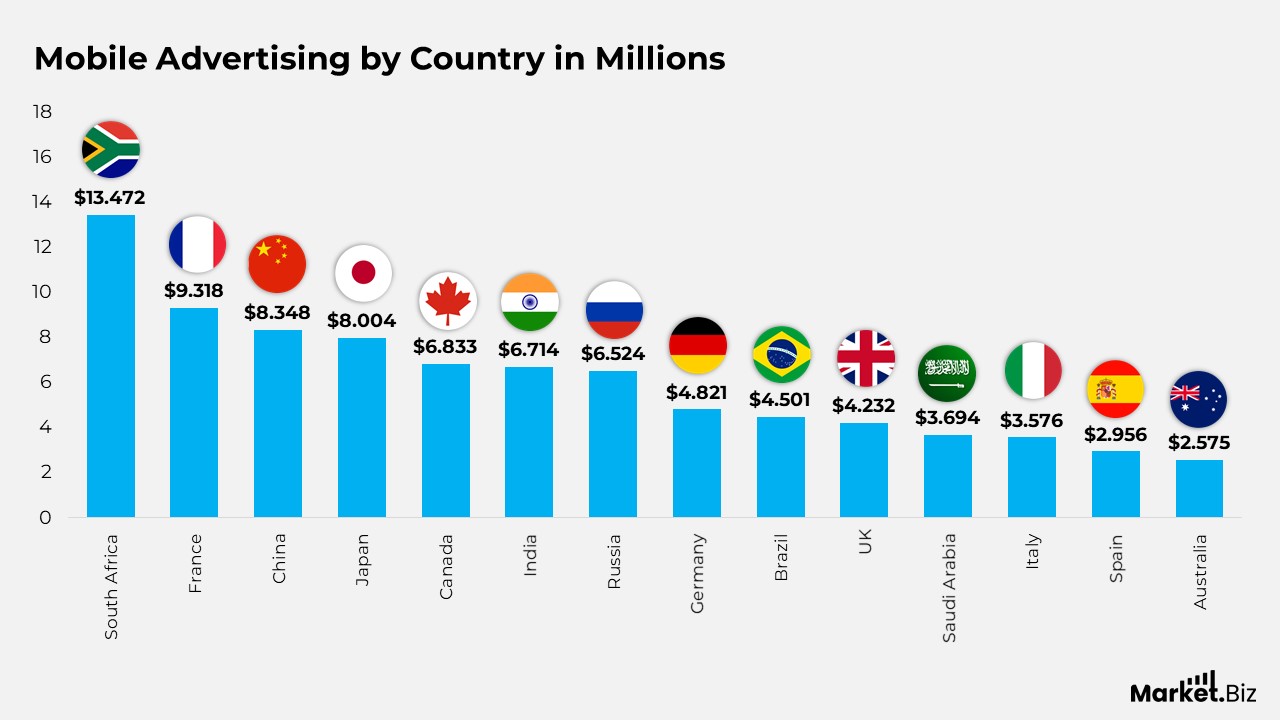
In 2025-
- South Africa Mobile Advertising Market Sales Revenue $13.472 Billion
- France Mobile Advertising Market Sales Revenue $9.318 Billion
- China Mobile Advertising Market Sales Revenue $8.348 Billion
- Japan Mobile Advertising Market Sales Revenue $8.004 Billion
- Canada Mobile Advertising Market Sales Revenue $6.833 Billion
- India Mobile Advertising Market Sales Revenue $6.714 Billion
- Russia Mobile Advertising Market Sales Revenue $6.524 Billion
- Germany Mobile Advertising Market Sales Revenue $4.821 Billion
- Brazil Mobile Advertising Market Sales Revenue $4.501 Billion
- United Kingdom Mobile Advertising Market Sales Revenue $4.232 Billion
- Saudi Arabia Mobile Advertising Market Sales Revenue $3.694 Billion
- Italy Mobile Advertising Market Sales Revenue $3.576 Billion
- Spain Mobile Advertising Market Sales Revenue $2.956 Billion
- Australia Mobile Advertising Market Sales Revenue $2.575 Billion
Mobile Commerce Statistics
- Mobile users represent 75% of the overall traffic and contribute to 63% of sales on eCommerce platforms.
- In 2023, mobile commerce constituted 8% of retail sales in the United States, with projections indicating an increase to over 10% by 2025.
- Approximately nine out of ten Americans aged 18 to 49 (91%) report having made purchases online via a smartphone.
- Over 40% of online transactions happen on mobile devices.
- In 2023, consumers dedicated nearly 500 billion hours to using shopping applications.
- 69% of in-store shoppers prefer to read product reviews on their phones instead of consulting a store associate.
- More than half of retail customers would use their mobile phones to search for online deals and discount codes.
- 38% of shoppers who initiate their product search on mobile devices ultimately make their purchases in-store.
- According to various mobile marketing statistics, 59% of consumers deem mobile shopping functionality as crucial when selecting a brand or retailer.
- 53% of smartphone users indicate that they do not have their preferred brand’s application installed on their devices.
- A mobile-friendly website is essential for the success of online stores. Data reveals that 61% of customers are more inclined to make purchases from a mobile-optimized site.
- 79% of individuals state they are more likely to return to and/or share a mobile site if it is user-friendly.
- According to certain data, 46% of shoppers are less inclined to explore other options while using the brand’s shopping application on mobile.
Social Media Advertising Statistics
- Global social media advertising expenditure is anticipated to reach $433.28 billion by the year 2030.
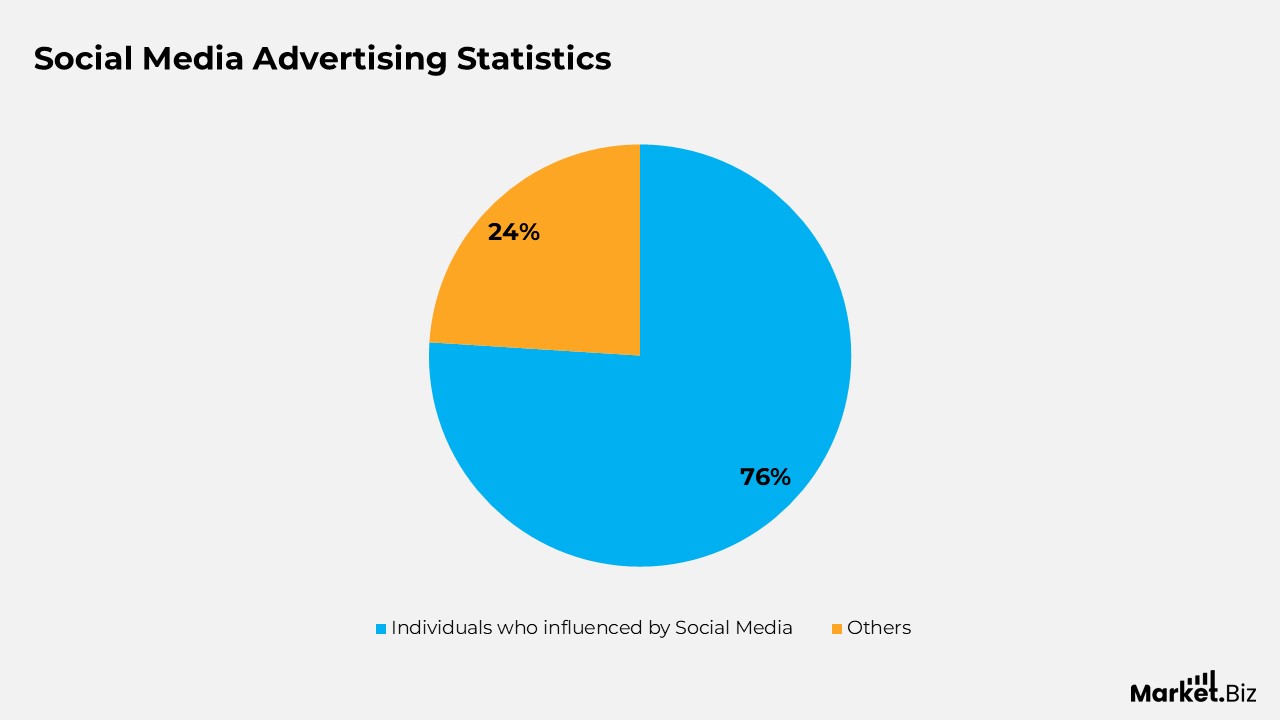
- 76% of individuals reported that they have bought a product after encountering it in social media advertisements.
- 59% of consumers indicate that they are equally or more likely to purchase a product that is endorsed by influencers they follow.
- In 2024, it was projected that companies in the United States would allocate $2.56 billion for influencer marketing campaigns on Instagram.
- 86% of businesses have incorporated Facebook into their advertising strategies.
- More than 3 million companies worldwide actively promote their products or services on Facebook.
- TikTok is expected to generate $33.1 billion in advertising revenue by the end of 2025.
- In 2024, TikTok was projected to account for 3.4% of the overall digital advertising market in the United States.
- According to a Business Insider study, 29.2% of the 1,000 TikToks viewed were advertisements.
- Brands have reported a 33% increase in purchase intent as a result of ad exposure on LinkedIn.
Conclusion
The mobile advertising sector in 2025 will require both agility and innovation. Technologies such as generative AI, augmented reality, and real-time attribution models are expanding the limits of what can be achieved. This sector is experiencing rapid growth, fueled by the rising use of mobile devices and improvements in targeting technologies.
Although it presents substantial opportunities for companies to connect with broader audiences, it also encounters challenges concerning user privacy and data security. Ultimately, achieving success in mobile advertising depends on the ability to adapt to changing trends, prioritize user experience, and enforce strong data protection protocols.
FAQs
The mobile advertising market was valued at USD 214.59 billion in 2024 and is anticipated to expand from USD 262.84 billion in 2025 to USD 1,005.96 billion by 2032, demonstrating a compound annual growth rate (CAGR) of 21.1% throughout the forecast period.
Global spending on mobile advertising was expected to reach $402 billion in 2024. In that year, the United States topped the list for mobile ad spending with $203.22 billion. It is projected that mobile ad spending in the U.S. will increase to $228.11 billion in 2025. Marketers in the U.S. dedicate 19% of their marketing budgets to mobile advertising.
Mobile advertising includes a variety of formats such as banner ads, interstitial ads, video ads, native ads, and push notifications. These advertisements are presented on mobile devices, including smartphones and tablets, frequently within applications or mobile websites.