Introduction
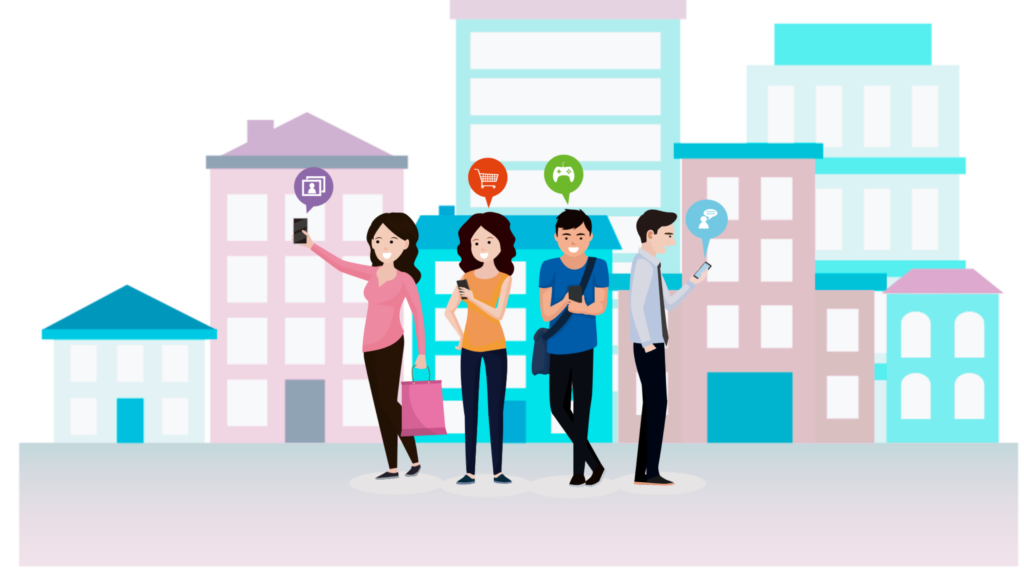
Social Sharing Statistics: One of the most prevalent occurrences on mobile and social messaging platforms is the sharing of content among users. The vast number of links exchanged and posts disseminated globally is so extensive that it is beyond measurement. We are currently in the Information Age, where content from a multitude of sources can be shared instantaneously.
In a single minute of internet activity in 2019, global online users transmitted more than 41.6 million mobile messages and 2.1 million snaps, highlighting the incessant desire of digital users to communicate and share. The market leader, Facebook, has achieved 3.07 billion monthly active users, while its video-and photo-sharing application, Instagram, boasts over one billion monthly active accounts.
Editor’s Choice
- Users of mobile devices or smartphones now allocate over 30% of their time on these devices to sharing content.
- Daily, more than 30 million pieces of content are shared across various platforms.
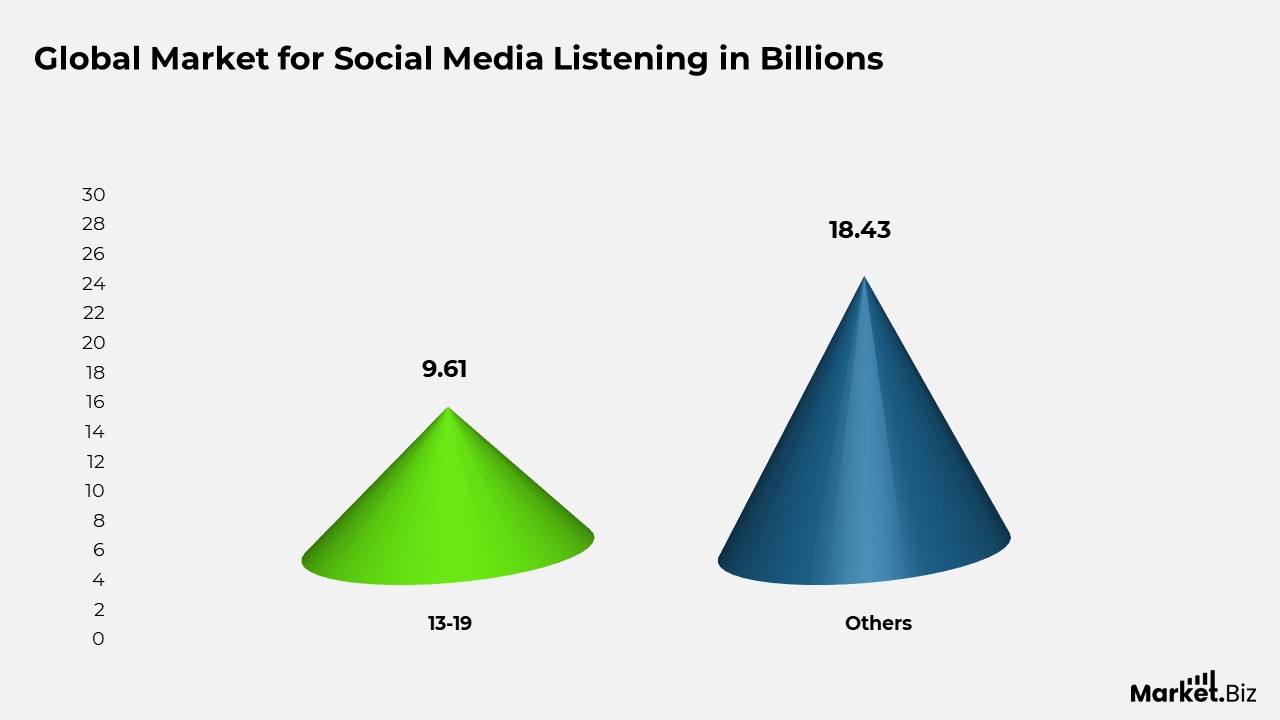
- The global market for social media listening underscores the growing significance of this trend. It is expected to nearly double from $9.61 billion in 2025 to $18.43 billion by 2030, with an annual growth rate of 13.9%.
- 31% of social listeners primarily use their tools to examine cultural trends.
- In the United States alone, 100.7 million Americans (36.8% of online consumers) engaged in shopping on social media in 2024.
General Social Sharing Statistics
- Users of mobile devices or smartphones now allocate over 30% of their time on these devices to sharing content.
- Infographics receive three times more likes and shares on social media compared to any other content type.
- Over 25% of mentions on Twitter stem from tweet buttons that are integrated into your website.
- Daily, more than 30 million pieces of content are shared across various platforms.
- Brands that engage in social sharing and produce 15 blog posts each month typically generate an average of 1,200 new leads monthly.
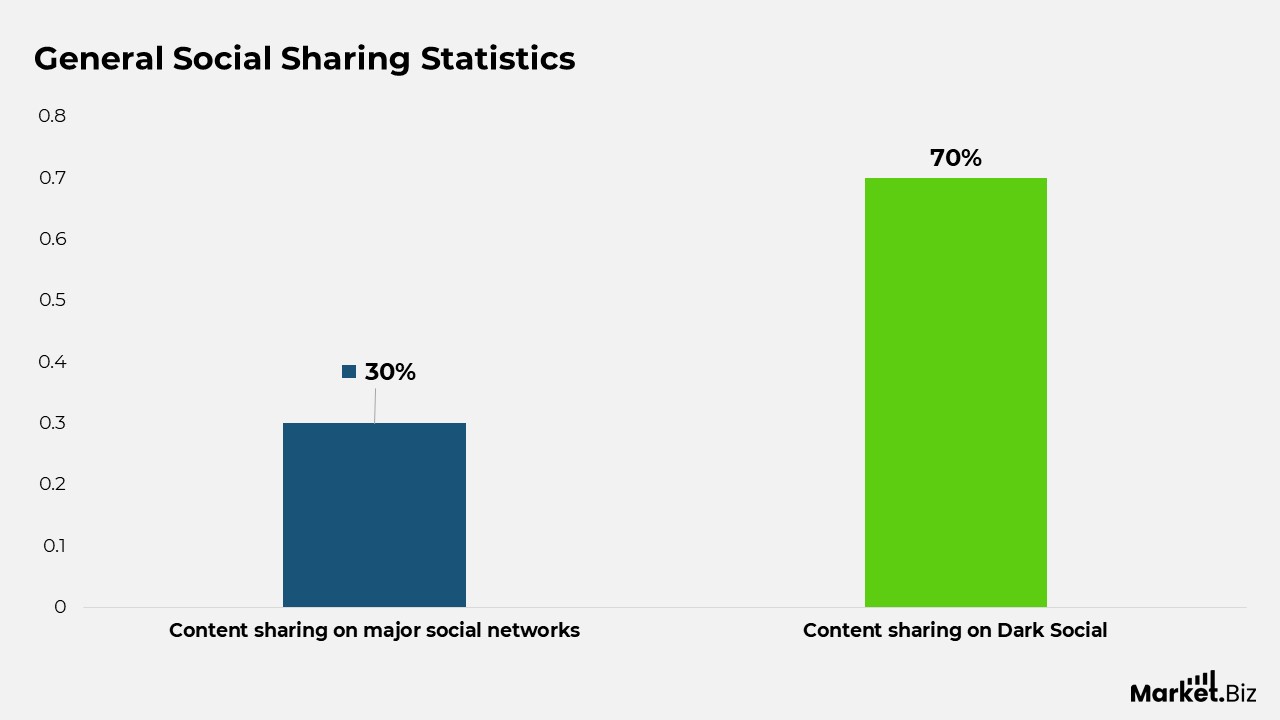
- Only 30% of content sharing occurs on major social networks, while the remaining 70% is disseminated through what is known as ‘Dark Social.’
- Every minute, Tumblr users post around 30,000 new blog entries.
Social Media Listening Statistics
- 62% of marketers currently use social listening tools to inform their strategies and assess ROI. This positions it as their second most important social media focus, following direct audience engagement.
- The trend in investment is obvious: 55% of marketing professionals anticipate an increase in the time and resources allocated to social listening.
- The global market for social media listening underscores the growing significance of this trend. It is expected to nearly double from $9.61 billion in 2025 to $18.43 billion by 2030, with an annual growth rate of 13.9%.
- Social listeners report a markedly higher level of confidence in their ROI across various platforms. On LinkedIn and Instagram, 76% of social listeners express confidence in their outcomes, in contrast to 63% and 59% of non-listeners, respectively. The disparity is even more pronounced on Facebook, where 67% of listeners convey confidence compared to only 27% of those who do not employ listening tools.
- 31% of social listeners primarily use their tools to examine cultural trends.
- The landscape of tools is becoming more consolidated. In 2024, 25% of companies were relying on a single listening tool, an increase from 16% the previous year.
Influencer Marketing Statistics
- More than 80% of marketers consider influencer marketing to be an exceptionally effective approach for connecting with and engaging target audiences.
- The return on investment continues to be remarkable. On average, businesses earn $5.78 for every $1 invested in influencer marketing initiatives.
- The landscape is now mainly occupied by smaller creators. In 2024, nano-influencers represented 75.9% of Instagram’s influencer demographic, indicating a trend towards more genuine, niche voices.
- Virtual influencers are increasingly popular. On YouTube, almost 59% of users follow virtual influencers, with TikTok at 56%, Instagram at 51%, and Twitch at 18%.
- Trust poses a significant challenge for virtual personalities. Merely 15% of customers rate their trust in products promoted by virtual influencers at 7 out of 10 or higher.
- 43.5% of users never have bought anything influenced by a virtual influencer, yet 27% are willing to consider doing so in the future.
Social Media Buying Behavior Statistics
- Direct purchases via social media platforms have more than doubled in recent years. 46% of consumers indicate that they have bought products directly through social media, an increase from 21% in 2019.
- Concerns regarding privacy continue to be significant. 67% of consumers voice anxieties about privacy and data sharing on social media platforms.
- The concept of social proof is vital in influencing purchase decisions. 82% of consumers seek out reviews to confirm a company’s credibility before purchasing a product through social media.
- The market size illustrates this increasing trend. Social commerce sales are anticipated to exceed $1.2 trillion worldwide in 2025.
- In the United States alone, 100.7 million Americans (36.8% of online consumers) engaged in shopping on social media in 2024.
- Younger consumers are at the forefront of this trend. Approximately 70% of Gen Z consumers have made a purchase prompted by something they saw in their social media feed.
- The influence of platforms varies. 28% of users concur that TikTok has motivated impulse purchases more than any other platform.
User-Generated Content (UGC) Statistics
- 85% of consumers place their trust in recommendations from friends and family, which renders user-generated content (UGC) a highly reliable source of information.
- Brands that integrate UGC into their marketing strategies may experience an increase in sales and conversions of up to 20%.
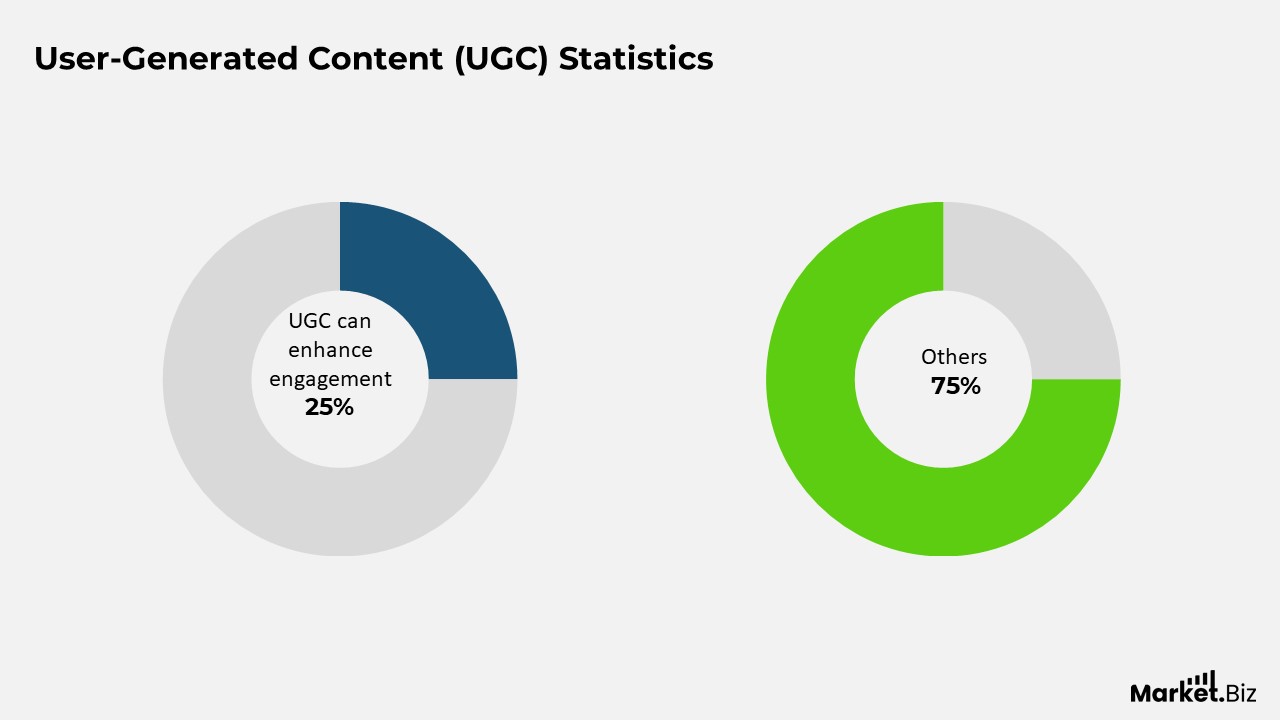
- The use of UGC can enhance engagement rates by 25%, as consumers tend to engage more with content produced by their peers.
- Instagram stands out as a premier platform for UGC, with 71% of online adults using it to discover new products and services.
- 70% of consumers are more inclined to make a purchase from a brand that showcases UGC, highlighting its significant influence on brand trust and loyalty.
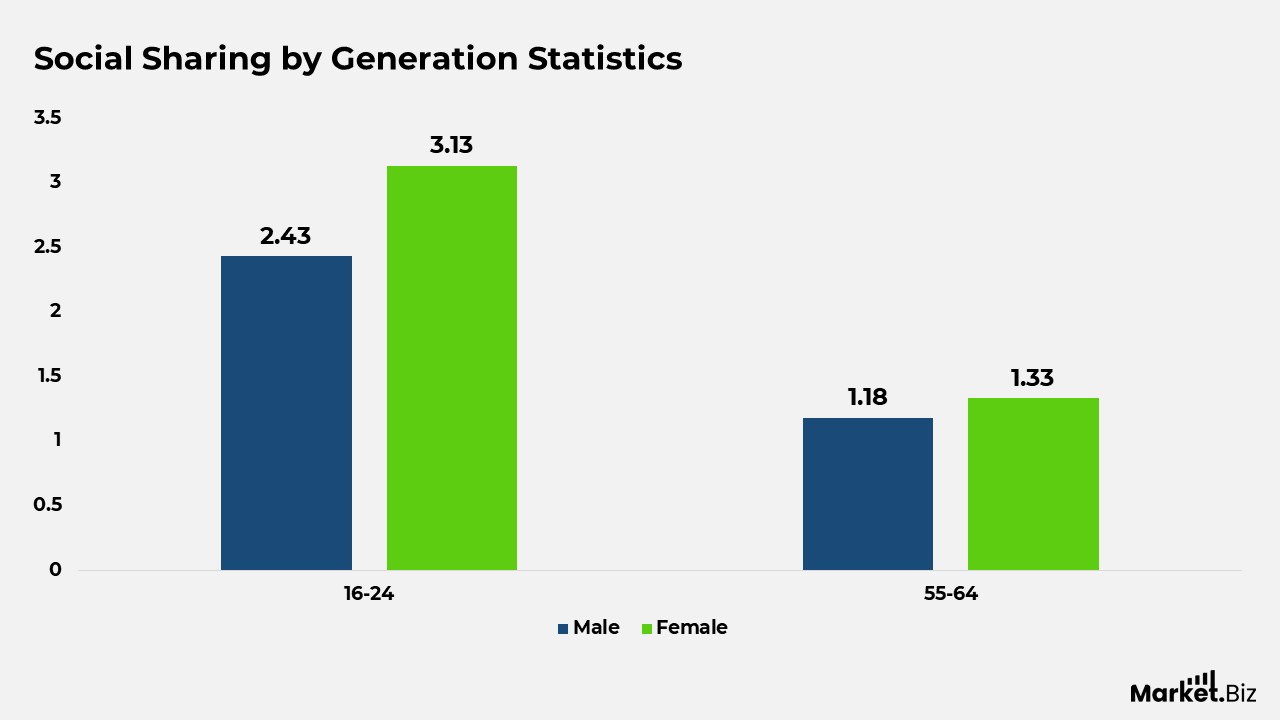
Social Sharing by Generation Statistics
- Generation Z allocates more time to social media than any other demographic, and the duration of daily social media usage appears to have an opposite relationship with age.
- Individuals aged 16 to 24 engage with social media for longer periods than any other age group. On average, males within this age bracket spend 2 hours and 43 minutes, while females in the same category spend 3 hours and 13 minutes on social media each day.
- On the other hand, those aged 55 to 64 dedicate the least amount of time to social media compared to other age groups. Males in this age range typically spend 1 hour and 18 minutes, whereas females spend an average of 1 hour and 33 minutes on social media daily.
Social Media Advertising Statistics
- Between 2019 and 2024, there was a 140% increase in global spending on social media advertising.
- The projected global expenditure on social media ads for 2024 is 234.14 billion USD.
- It is anticipated that social media advertising spending will rise by 50% by 2029, surpassing 345 billion dollars.
- The United States holds the position as the largest market for social media advertising.
- The worldwide click-through rate for social media advertising stands at 0.98%.
- Social media advertisements represent 28.8% of the total digital advertising expenditure.
- Approximately 8.7% of a business’s overall revenue is allocated to the advertising budget.
- 69% of marketers have invested in video advertisements.
- Advertisements that incorporate user-generated content (UGC) receive 73% more favorable comments on social media compared to conventional ads.
B2B Social Media Marketing Statistics
- The leading sector for B2B investment in content marketing is video.
- The primary objective accomplished by B2B professionals through content marketing is the improvement of brand awareness.
- 46% of B2B marketers aware of their content marketing budget anticipate an increase in 2025 compared to 2024.
- 59% of B2B marketers utilize digital display advertising to promote their content.
- 44% of B2B companies enhance their social media posts.
- 21% of B2B organizations adopt video marketing strategies.
Social Sharing by Platform Statistics
Facebook ranks as the third most-visited website globally, following Google and YouTube. It boasts the highest number of daily active users, totaling 2.11 billion, and has over 3.07 billion monthly active users.
YouTube
As of January 2025, YouTube has surpassed 2.70 billion active monthly users, establishing itself as the second most popular social media platform in the world.
In October 2022, Instagram exceeded 2 billion monthly active users. Almost a quarter of the global population engages with Instagram each month, representing 37% of all active internet users.
A significant 86% of B2B marketers have achieved substantial success through LinkedIn, experiencing conversion rates that are up to twice as high as those from other social media channels. Furthermore, audiences on LinkedIn who are exposed to brand and acquisition messages are six times more likely to convert.
Conclusion
Social Sharing Statistics: Social sharing remains a prevalent online activity, with billions of individuals actively involved. Users of social media are progressively interacting with content across diverse platforms and formats, such as mobile devices and video.
The landscape of social media is also changing, characterized by fluctuations in platform popularity and variations in user demographics.
FAQs
Social statistics and the analysis of quantitative data serve as essential instruments for comprehending society and the dynamics of social change. By utilizing numerical data, we can attempt to capture individuals’ attitudes and identify patterns in behaviors and circumstances, as well as illustrate how individuals and populations evolve.
Social statisticians operate across a diverse range of fields. Some are employed within Statistics departments, while others work in social science departments, educational institutions, policy schools, biostatistics departments, public health programs, and similar areas. A significant number are engaged in federal government roles, with others in the private sector.
Although there is no singular “founder” of social media, SixDegrees.com, which was launched in 1997 by Andrew Weinreich, is commonly acknowledged as the inaugural social networking site. It enabled users to establish profiles and connect. Nevertheless, the development of social media encompasses a more extensive narrative involving various platforms and individuals throughout history.