Introduction
Shopping Application Statistics: The shopping application market has experienced significant growth in recent years, fueled by the widespread adoption of e-commerce and mobile shopping solutions. Advancements in mobile technology, coupled with the increasing preference for convenience, have made shopping apps an essential part of consumers’ purchasing habits.
With enhanced user experiences, personalized AI-powered recommendations, and streamlined mobile payment options, shopping apps are providing a seamless, efficient way for consumers to shop from anywhere.
The growing focus on secure transactions and fast delivery systems has further contributed to the popularity of these platforms. As mobile commerce continues to evolve, shopping applications are expected to reshape the retail industry, opening new avenues for brands and retailers to connect with consumers.
Editor’s Choice
- In 2023, 72% of global e-commerce sales were made on mobile devices, a figure expected to rise to nearly 88% by 2027, making mobile the dominant platform for online shopping.
- By 2027, 22.6% of all global retail purchases are projected to be made online, continuing the rapid growth of e-commerce worldwide.
- 43% of U.S. consumers prefer online shopping to in-store shopping, making the U.S. a leader in online shopping, with expectations for further growth in the coming years.
- 48% of U.S. online shoppers cite free delivery as the primary reason they shop on Amazon, highlighting the growing importance of shipping incentives in driving e-commerce sales.
- 92% of U.S. consumers make online purchases on their mobile phones, and 80% of global consumers visit retailer websites on smartphones while in-store, reflecting mobile’s influence on both in-store and online shopping experiences.
- The global shopping cart abandonment rate reached 70.19% in 2023, with 48% of shoppers abandoning their carts due to additional costs like shipping fees, underscoring the need for transparent pricing strategies.
- Social media platforms accounted for 18.5% of global online sales in 2023, with 106.8 million social buyers in the U.S., showing how social commerce is reshaping online shopping and influencing purchasing decisions.
General Shopping Application Statistics
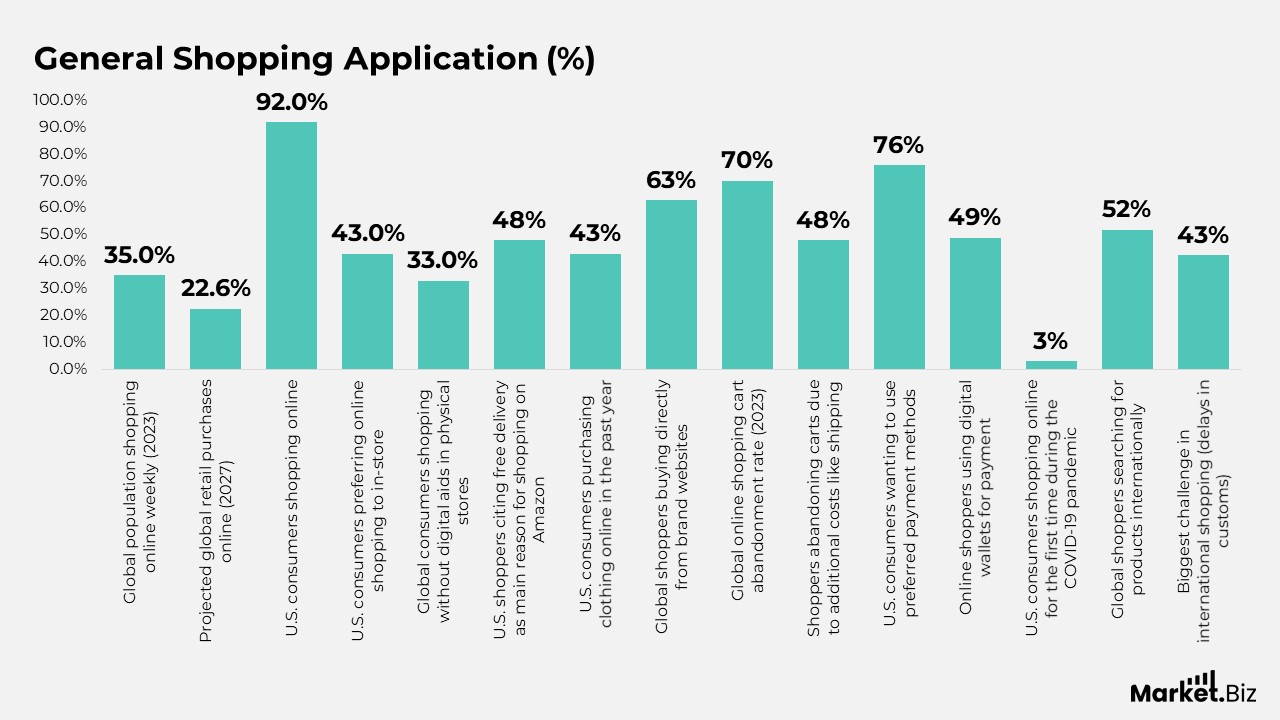
- In 2023, 35% of the global population engaged in online shopping at least once a week.
- By 2027, 22.6% of all global retail purchases are projected to occur online.
- 92% of U.S. consumers make purchases online.
- Between 2024 and 2029, an additional 60 million U.S. consumers are expected to shop online.
- 43% of U.S. consumers prefer online shopping to in-store shopping, making the U.S. the leader in online shopping.
- Globally, only 33% of consumers shop in physical stores without using any digital aids.
- 48% of U.S. online shoppers cite free delivery as the main reason for shopping on Amazon.
- In the U.S., 43% of consumers purchased clothing online in the past year, making it the top online purchase category.
- 63% of global shoppers have bought products directly from a brand’s website.
- The global online shopping cart abandonment rate reached 70.19% in 2023.
- U.S. grocery delivery eCommerce revenue is projected to exceed $422 billion by 2028.
Further
- 48% of shoppers abandon their carts due to additional costs, such as shipping fees.
- 76% of U.S. consumers want to use their preferred payment method when shopping online.
- 49% of online shoppers use digital wallets for payment.
- Only 3% of U.S. consumers shopped online for the first time during the COVID-19 pandemic.
- 52% of global shoppers search for products internationally.
- The biggest challenge in international shopping for 42.6% of consumers is delays in customs shipments.
- In the U.S., $222.1 billion was spent online during the 2023 holiday season (Nov 1–Dec 31).
- Adobe forecasts that U.S. online spending during the 2024 holiday season will reach $240.8 billion.
- As of June 2024, 904 million consumers in China are shopping online.
- 39% of international online shoppers purchase clothing and footwear from abroad.
- 83% of shoppers do online research before visiting physical stores.
- 35% of people turn to online marketplaces for shopping inspiration.
(Source: Statista, Digital Silk)
Online Shopping Behavior Statistics
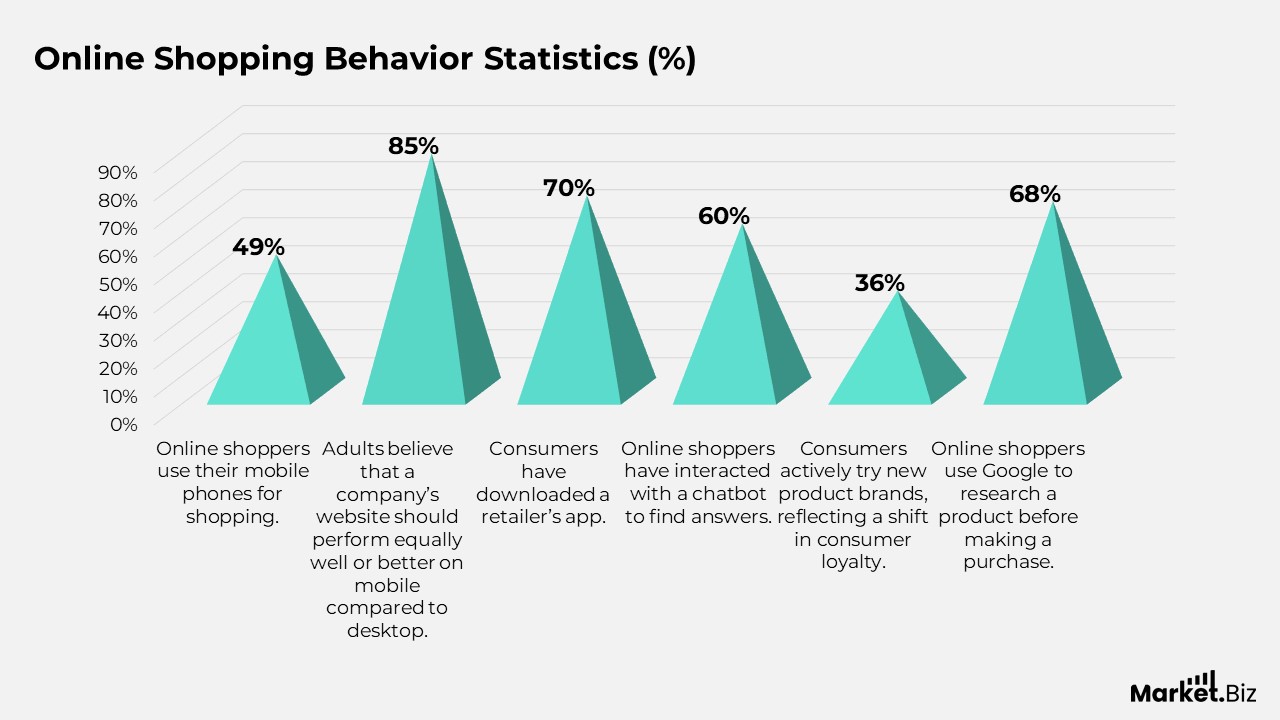
- 49% of online shoppers use their mobile phones for shopping.
- 85% of adults believe that a company’s website should perform equally well or better on mobile compared to desktop.
- Nearly 70% of consumers have downloaded a retailer’s app.
- 60% of online shoppers have interacted with a chatbot to find answers.
- 36% of consumers actively try new product brands, reflecting a shift in consumer loyalty.
- 68% of online shoppers use Google to research a product before making a purchase.
(Source: Statista, giosg.com Ltd.)
Shopping Cart Abandonment Statistics
- 69.57% of online shopping carts are abandoned, according to Baymard Institute.
- 56% of cart abandonment is due to unexpected costs, such as extra fees.
- 18% of cart abandonment is due to a long, complicated checkout process.
- Large e-commerce sites can see a 35.26% increase in conversion rates with a better checkout design, based on Baymard Institute data.
(Source: Statista, giosg.com Ltd., Baymard Institute)
Product Return Rate Statistics in E-Commerce
- Retail returns averaged 16.6% in 2021, a significant increase from 10.6% in 2020, according to the National Retail Federation and Appriss Retail.
- 92% of shoppers say they would buy again from an online store if the return process is easy.
- 67% of shoppers check a website’s returns policy before making a purchase.
- 49% of e-commerce stores offer free return shipping.
(Source: Statista, giosg.com Ltd., Baymard Institute)
Top Retailers by Digital Performance
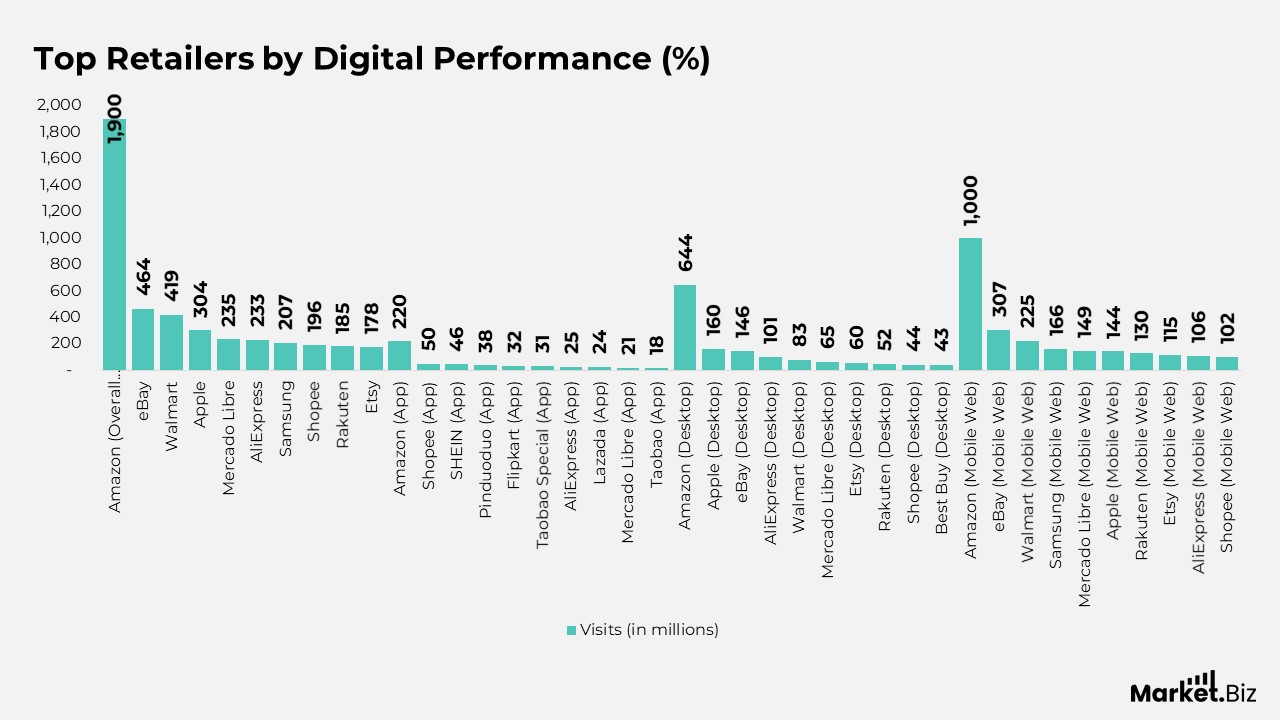
- In Q4 2020, Amazon led overall performance with 1.9 billion visits.
- eBay followed with 464 million visits.
- Walmart garnered 419 million visits, ranking third.
- Apple achieved 304 million visits.
- Mercado Libre attracted 235 million visits.
- AliExpress had 233 million visits.
- Samsung reached 207 million visits.
- Shopee recorded 196 million visits.
- Rakuten earned 185 million visits.
- Etsy concluded the top 10 with 178 million visits.
On the App front:
- Amazon topped with 220 million visits.
- Shopee had 50 million visits.
- SHEIN saw 46 million visits.
- Pinduoduo followed closely with 38 million visits.
- Flipkart reached 32 million visits.
- Taobao Special attracted 31 million visits.
- AliExpress had 25 million visits.
- Lazada recorded 24 million visits.
- Mercado Libre had 21 million visits.
- Taobao garnered 18 million visits.
In terms of Desktop visits:
- Amazon led with 644 million visits.
- Apple followed with 160 million visits.
- eBay had 146 million visits.
- AliExpress reached 101 million visits.
- Walmart saw 83 million visits.
- Mercado Libre earned 65 million visits.
- Etsy had 60 million visits.
- Rakuten garnered 52 million visits.
- Shopee recorded 44 million visits.
- Best Buy attracted 43 million visits.
On the Mobile Web side:
- Amazon dominated with 1 billion visits.
- eBay recorded 307 million visits.
- Walmart garnered 225 million visits.
- Samsung reached 166 million visits.
- Mercado Libre earned 149 million visits.
- Apple achieved 144 million visits.
- Rakuten had 130 million visits.
- Etsy recorded 115 million visits.
- AliExpress saw 106 million visits.
- Shopee concluded the list with 102 million visits.
(Source: Digital Shipping Performance Report, Semrush)
Most Popular Mobile Shopping Application in the U.S. Statistics
- In September 2019, Amazon had the highest reach with 80.64% of mobile shopping app users.
- Walmart followed with 46.08% of mobile shopping app users.
- eBay reached 33.28% of mobile shopping app users.
- Ibotta was used by 25.2% of mobile shopping app users.
- Target attracted 24.31% of mobile shopping app users.
- Groupon had 18.75% of mobile shopping app users.
- Etsy was used by 17.21% of mobile shopping app users.
- The Home Depot reached 16.13% of mobile shopping app users.
- Wish accounted for 14.81% of mobile shopping app users.
- Best Buy attracted 14.01% of mobile shopping app users.
- Shopkick was used by 12.72% of mobile shopping app users.
- Kohl’s had 12.47% of mobile shopping app users.
- Walgreens reached 12.34% of mobile shopping app users.
- Ticketmaster had 10.79% of mobile shopping app users.
- Domino’s reached 9.85% of mobile shopping app users.
- Wayfair had 9.76% of mobile shopping app users.
- Macy’s attracted 9.66% of mobile shopping app users.
- Coupons.com reached 9.53% of mobile shopping app users.
- Lowe’s accounted for 9.31% of mobile shopping app users.
- Kroger was used by 9.18% of mobile shopping app users.
- Craigslist reached 9.14% of mobile shopping app users.
- Ebates Cash Back & Coupons had 8.26% of mobile shopping app users.
- The Fetch Rewards App was used by 7.49% of mobile shopping app users.
- DoorDash – Food Delivery accounted for 7.41% of mobile shopping app users.
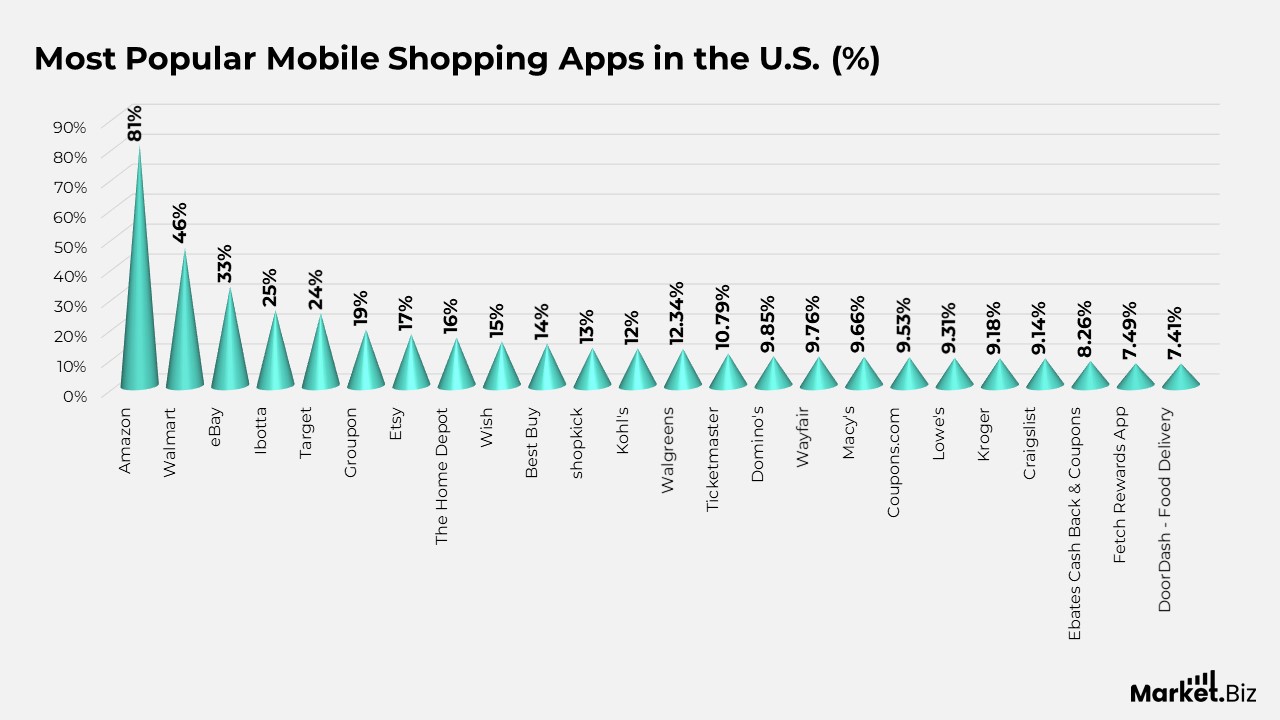
(Source: Statista, Big Commerce)
Top Worldwide Shopping Application Downloads Statistics
- In Q4 2020, Amazon led with 51 million downloads.
- Shopee followed with 43 million downloads.
- SHEIN had 37 million downloads.
- Flipkart recorded 33 million downloads.
- Wish was downloaded 31 million times.
- Pinduoduo saw 29 million downloads.
- Lazada reached 22 million downloads.
- Taobao Special had 21 million downloads.
- AliExpress was downloaded 18 million times.
- Taobao reached 17 million downloads.
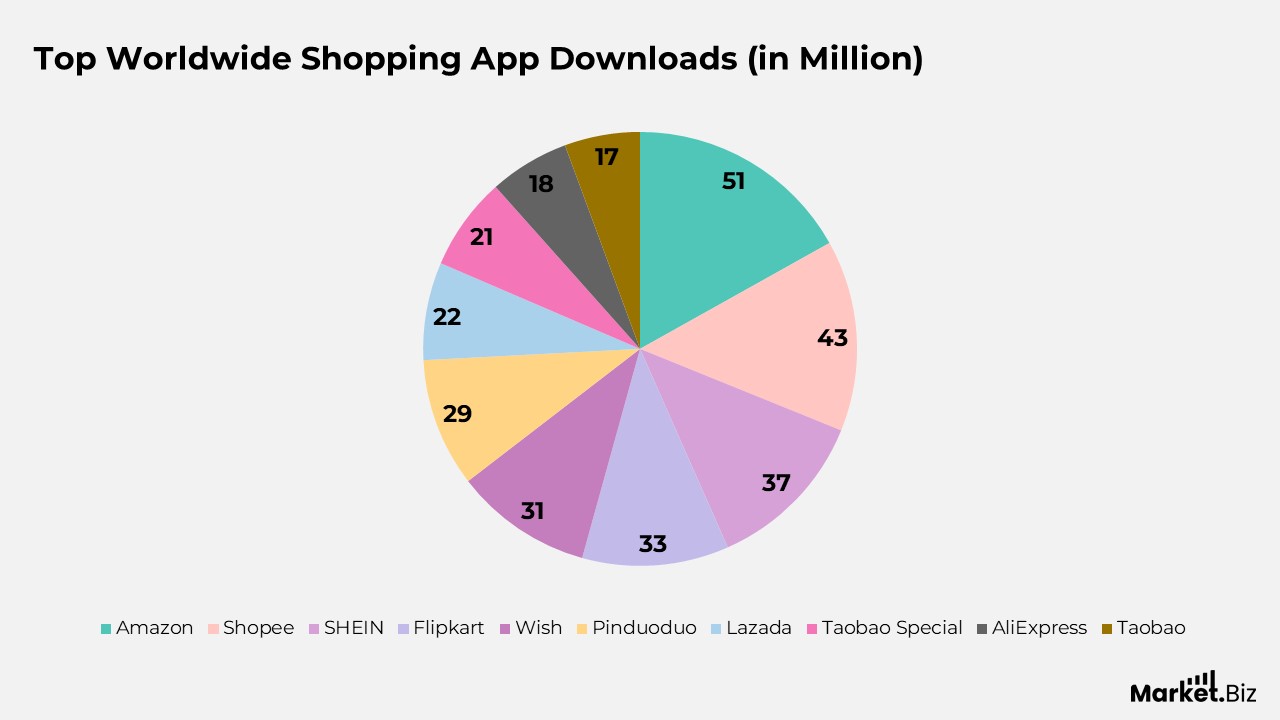
(Source: Statista, Big Commerce)
Top Countries by Mobile Application Sessions for Shopping Statistics
- China led with 27 billion shopping app sessions in Q4 2020, maintaining its top position from Q4 2019.
- The United States had 14 billion shopping app sessions in Q4 2020, down from 23 billion in 2019.
- India recorded 10 billion shopping app sessions in 2020, slightly decreasing from 11 billion in 2019.
- Brazil saw a growth, with 4.3 billion shopping app sessions in 2020, compared to 7.1 billion in 2019.
- South Korea had 4.1 billion shopping app sessions in 2020, a decrease from 4.9 billion in 2019.
- China outperformed all other countries, with more than 28 billion shopping app sessions, including a notable increase from the previous year.
- Both Brazil and the United States experienced the most growth, with Brazil’s sessions increasing by 66.3% year-on-year and the US by 65.9%.
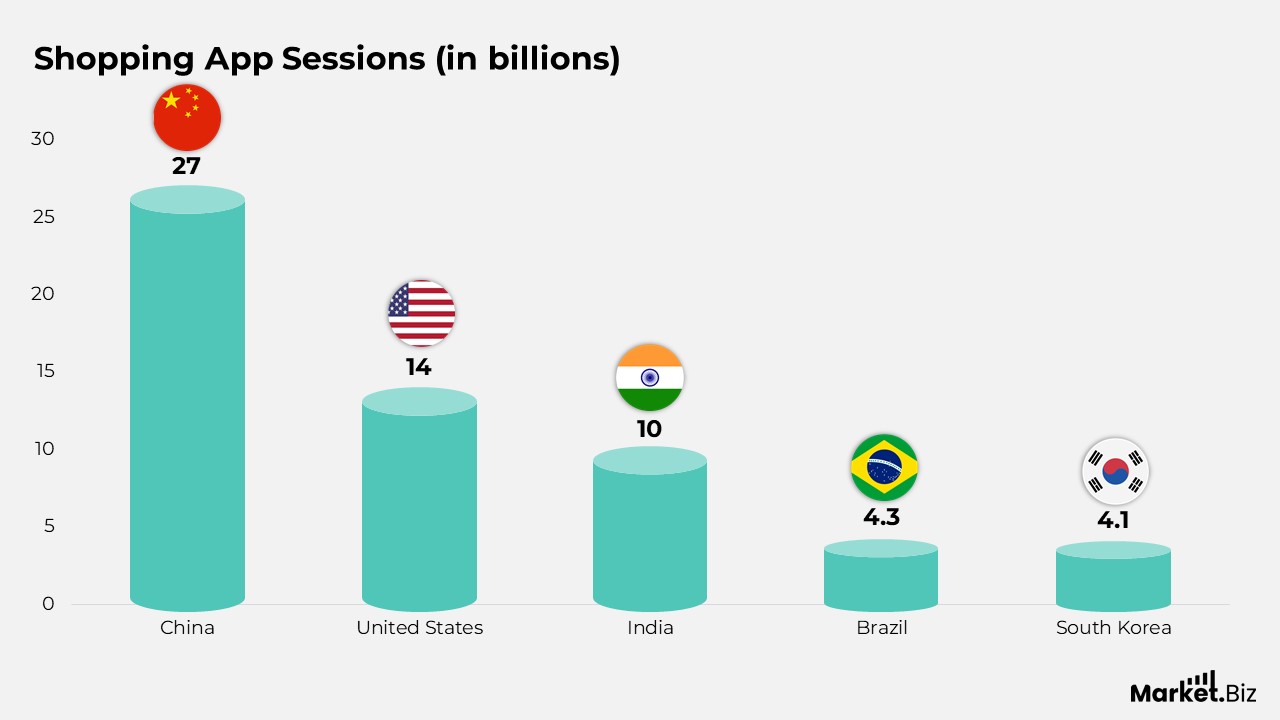
(Source: Statista, Big Commerce)
Mobile Commerce Trends
- 72% of global e-commerce sales were completed via mobile devices in 2023, with projections indicating this will rise to nearly 88% by 2027.
- Mobile commerce is on the rise, with sales expected to hit $728.28 billion by 2025 as mobile devices continue to dominate online shopping.
- In 2023, mobile shopping in the United States accounted for $470 billion in online sales, marking a 12% increase from the previous year.
- By 2026, nearly 69.2% of the U.S. population is expected to engage in mobile shopping.
- In 2023, consumers worldwide spent over 109 billion hours on shopping apps, emphasizing the growing influence of mobile apps in the shopping journey.
- A 2023 study found that 74% of consumers are more likely to revisit an online store if it is optimized for a seamless mobile experience.
- In 2022, global shoppers spent a total of 108 billion hours on shopping apps, reflecting a 9.1% year-over-year increase.
- 80% of global customers visit retailer websites on their smartphones while shopping in-store, and 74% use retailer apps throughout their in-store shopping experience.
- 29.9% of global online shoppers type weekly consumption on their smartphones.
- Among South Korean internet operators, 44.4% make weekly mobile e-commerce purchases, which is 48.5% higher than the global average.
- In Mexico, 35.3% of internet users make weekly mobile e-commerce purchases, 18.1% higher than the global average.
- In China, 33.7% of internet users make weekly mobile e-commerce purchases, 12.7% higher than the global average.
Moreover
- 32.5% of internet users in the UK make weekly mobile e-commerce purchases, 8.7% above the global average.
- 29.7% of Canadian internet users make daily mobile e-commerce purchases, just 0.67% below the global average.
- In Japan, only 21.3% of internet users make weekly e-commerce purchases, which is 28.8% below the global average.
- Among people aged 30-49, 92% regularly use smartphones for online shopping, and 49% make weekly purchases.
- 76% of U.S. adults make online purchases on their smartphones.
- People aged 18-24 shop online on mobile devices the most in the U.S., accounting for 46.9% of the online shopping audience.
- 96% of Gen Z consumers in the U.S. made at least one purchase per month in 2023.
- 60% of adults in the U.S. consider mobile shopping a necessity for shopping convenience.
- 74% of consumers are more likely to return to an online store if it’s optimized for mobile devices.
- Temu became the leading shopping app in the U.S. with 122.5 million downloads in 2023.
- The global mobile cart abandonment rate reached 84%.
(Source: Gauss, inBeat Agency)
Conclusion
Shopping Application Statistics: Shopping applications are transforming the global retail landscape, driven by growing online shopping preferences, convenience, and the desire for personalised experiences. The number of online shoppers continues to rise, especially in regions such as the U.S. and China, making shopping apps a key part of modern consumer behaviour.
Factors such as mobile payment solutions, free delivery offers, and the ease of shopping from home are further fueling the popularity of these platforms. While challenges such as cart abandonment and international shipping delays persist, the market continues to expand, with new opportunities in mobile commerce, digital wallet adoption, and cross-border shopping. As consumer demands evolve, shopping applications are poised to play an even larger role in the future of retail.
FAQ’s
A significant portion of the global population engages in online shopping weekly, reflecting the growing preference for digital purchasing due to convenience and accessibility.
The share of global retail purchases made online is expected to increase significantly, reflecting the shift towards e-commerce as a dominant channel for consumer purchases.
A large majority of U.S. consumers regularly shop online, underscoring how deeply e-commerce has embedded itself in consumer behaviour in the country.
Projections suggest that the number of online shoppers in the U.S. will continue to grow, with many more consumers expected to adopt online shopping over the next several years.
A significant percentage of U.S. consumers now prefer shopping online rather than in-store, highlighting the convenience and advantages of online shopping platforms.