
Introduction
Mobile internet usage statistics reveal that smartphones have become the dominant access point for digital connectivity worldwide. As billions of people rely on mobile devices for social networking, video streaming, online shopping, digital payments, and remote productivity, mobile internet now plays a central role in global digital adoption.
The rapid rollout of 4G and 5G networks, declining data prices, and rising smartphone penetration continue to push mobile traffic upward, particularly in high-growth developing regions.
These insights help businesses, developers, and policymakers understand shifting user behaviors, time spent online, app interaction trends, content consumption habits, and regional differences, ultimately showing how mobile connectivity is reshaping digital landscapes and influencing future technology innovation.
Editor’s Choice
- Over 64% of global website traffic in 2025 comes from mobile devices.
- 96.3% of internet users access the web via mobile phones.
- There are around 4.32 billion active mobile internet users.
- Africa records the highest share of mobile-based internet traffic at 69.13%.
- Global 5G connections are expected to exceed 1 billion by 2025.
- According to Statista, 5.52 billion people use the internet, representing 67.5% of the world’s population.
- India has the second-largest online population, with over 881.3 million internet users.
- US adults spend more than 5 hours every day on their mobile phones.
- Mobile e-commerce sales were projected to hit $3.56 trillion by the end of 2021.
- Mobile phones account for 52% of global internet traffic.
- Nearly 3 in 5 users check their email on mobile devices.
- The average user spends about 2 hours per day on YouTube and social media on a mobile device.
- 35% of US consumers complete all their online shopping via mobile phones.
- American mobile users spend only 21 minutes per day on voice calls.
- 60.4% of total web traffic comes from mobile devices.
- 96% of people worldwide connect to the internet using a mobile device.
- 92.3% of internet users rely on mobile phones for browsing.
- 15% of US adults access the internet exclusively through mobile devices.
- The number of smartphone users is projected to reach 4.69 billion by the end of 2025.
Mobile Internet Traffic Share
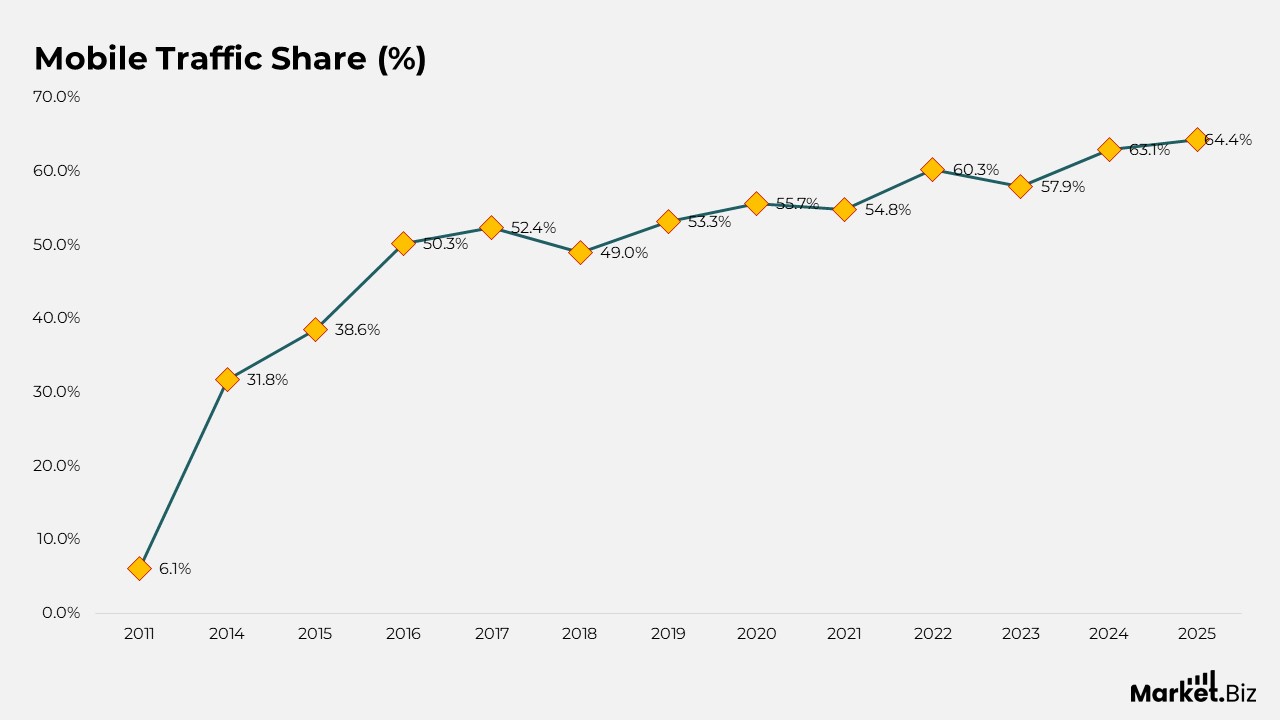
- As of May 2025, mobile devices account for 64.35% of all website traffic.
- In 2011, mobile internet traffic accounted for only 6.1%, underscoring how dramatically usage has expanded.
- By 2015, mobile traffic increased to 38.59%, marking a significant acceleration in global adoption.
- In December 2014, mobile traffic accounted for 31.79%, rising sharply to 38.59% in December 2015, for a 21.39% annual increase.
- Mobile’s share surpassed the halfway mark in December 2016, reaching 50.25%, reflecting a 30.26% jump.
- In December 2017, mobile traffic climbed to 52.40%, a 4.28% year-over-year increase.
- A slight dip occurred in December 2018, when mobile traffic dropped to 49.02%, a decline of 6.45%.
- Usage rebounded in December 2019, rising to 53.25% and increasing by 8.63%.
- Mobile traffic continued its upward trend in December 2020, rising 4.59% to 55.69%.
- A minor drop followed in December 2021, with traffic at 54.84%, slipping 1.53%.
- In December 2022, mobile internet traffic surged to 60.28%, up 9.91% from the previous month.
- In December 2023, the rate declined slightly to 57.94%, down 3.88%.
- By December 2024, mobile traffic had risen again to 63.05%, an 8.83% boost year-over-year.
(Source: Exploding Topics, Statista)
Global Internet Access by Device Type
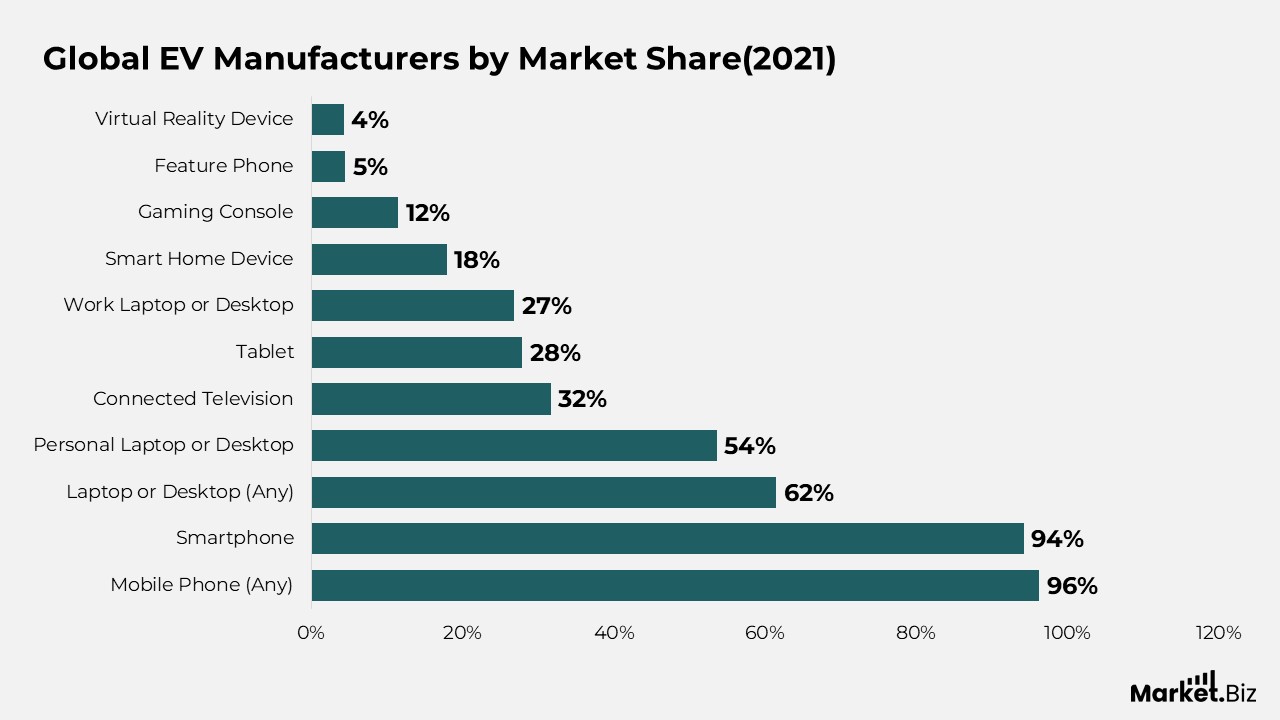
- Around 96.3% of internet users access the web through some form of mobile phone, making it the dominant device category.
- 94.2% of users specifically browse the internet on smartphones, highlighting their central role in digital activity.
- Laptops and desktops are used by 61.5% of online users, showing they remain an important secondary access point.
- Personal computers alone account for 53.6% of internet usage.
- Connected TVs are gaining traction, with 31.7% of people going online via smart TVs.
- Tablets serve as an access device for 27.9% of global internet users.
- Work laptops or desktops contribute to online access for 26.8% of internet users.
- 17.9% of people use smart home devices, such as voice assistants, to connect to the internet.
- Gaming consoles are an online entry point for 11.5% of users.
- Feature phones still play a role, with 4.5% of users accessing the internet through them.
- Virtual reality headsets are used by 4.3% of users for online connectivity, indicating a growing niche.
(Source: Exploding Topics, Statista)
Global Mobile Data Traffic Trends
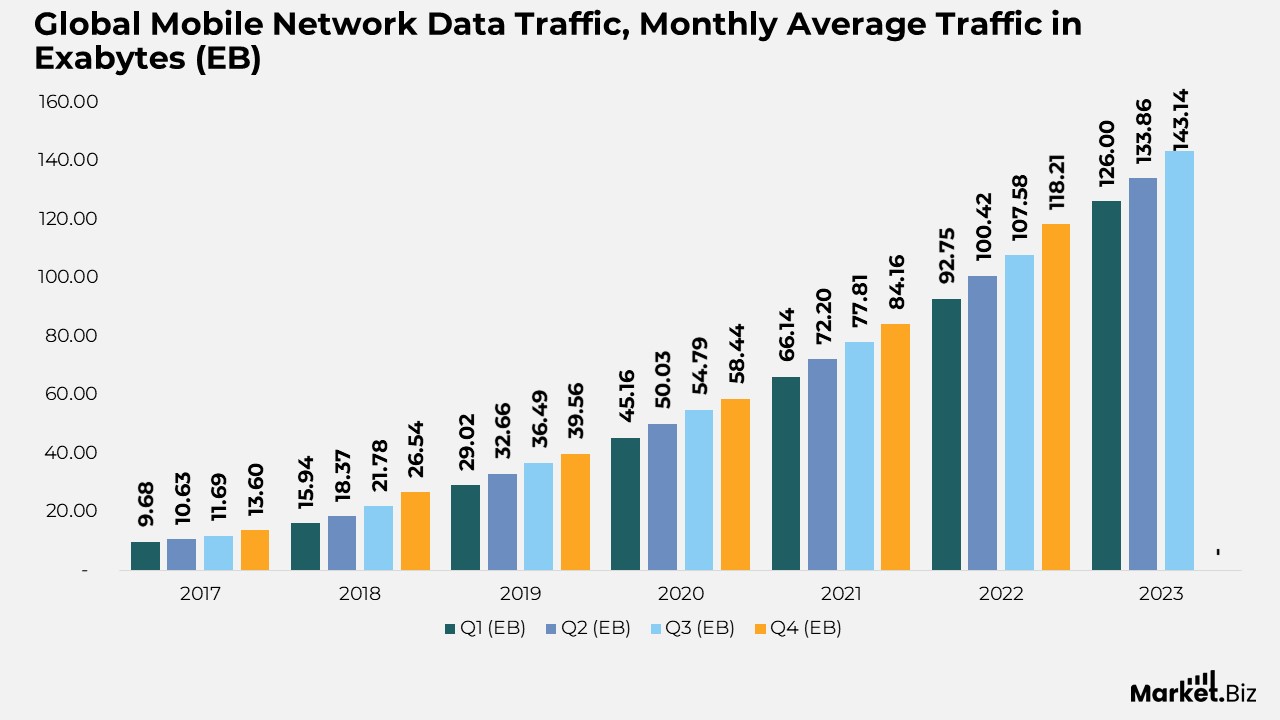
- Global mobile network data traffic has grown steadily from 9.68 EB in Q1 2017 to more than 143.14 EB in Q3 2023, indicating a massive expansion in mobile data usage.
- Mobile data traffic climbed to 10.63 EB in Q2 2017 and continued rising to 11.69 EB in Q3 2017, reaching 13.6 EB by the end of that year.
- In 2018, traffic increased from 15.94 EB in Q1 to 18.37 EB in Q2, then jumped to 21.78 EB in Q3 and 26.54 EB in Q4.
- The upward trend persisted through 2019, with mobile data usage growing from 29.02 EB in Q1 to 32.66 EB in Q2, then to 36.49 EB in Q3, and finally to 39.56 EB in Q4.
- In 2020, mobile data traffic rose sharply, starting at 45.16 EB in Q1 and reaching 50.03 EB in Q2, 54.79 EB in Q3, and 58.44 EB in Q4.
- In 2021, global traffic increased from 66.14 EB in Q1 to 72.2 EB in Q2, then rose to 77.81 EB in Q3 and 84.16 EB in Q4.
- The growth accelerated in 2022, with traffic reaching 92.75 EB in Q1, crossing 100.42 EB in Q2, climbing to 107.58 EB in Q3, and hitting 118.21 EB in Q4.
- By 2023, mobile data traffic continued its strong rise, reaching 126 EB in Q1, 133.86 EB in Q2, and 143.14 EB in Q3.
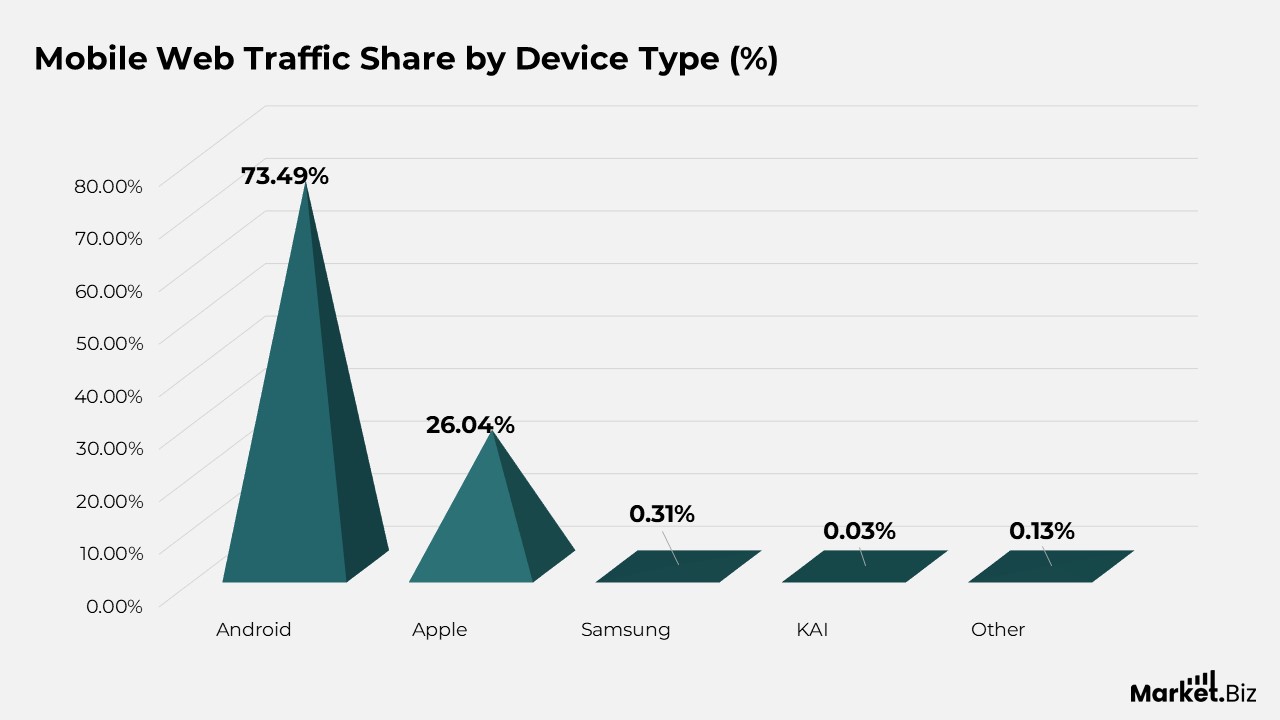
- Android leads global mobile web traffic with a 73.49% share, while Apple accounts for 26.04%, and together the two platforms account for 99.53% of all mobile web activity.
(Source: Exploding Topics, Statista)
Mobile Web Traffic Share
- Android leads global mobile web traffic with a commanding 73.49% share, up 3.01% from the previous year.
- Apple devices account for 26.04% of total mobile web traffic, reflecting a slight year-over-year decrease of 2.76%.
- Samsung accounts for 0.31% of mobile web usage, down 0.6% from last year.
- KAI devices hold a minimal 0.03% share of mobile web traffic, dropping -0.11% year over year.
- Other device types collectively account for 0.13% of mobile web activity, down 0.8% from the previous period.
(Source: Exploding Topics, DataReportal, StatCounter)
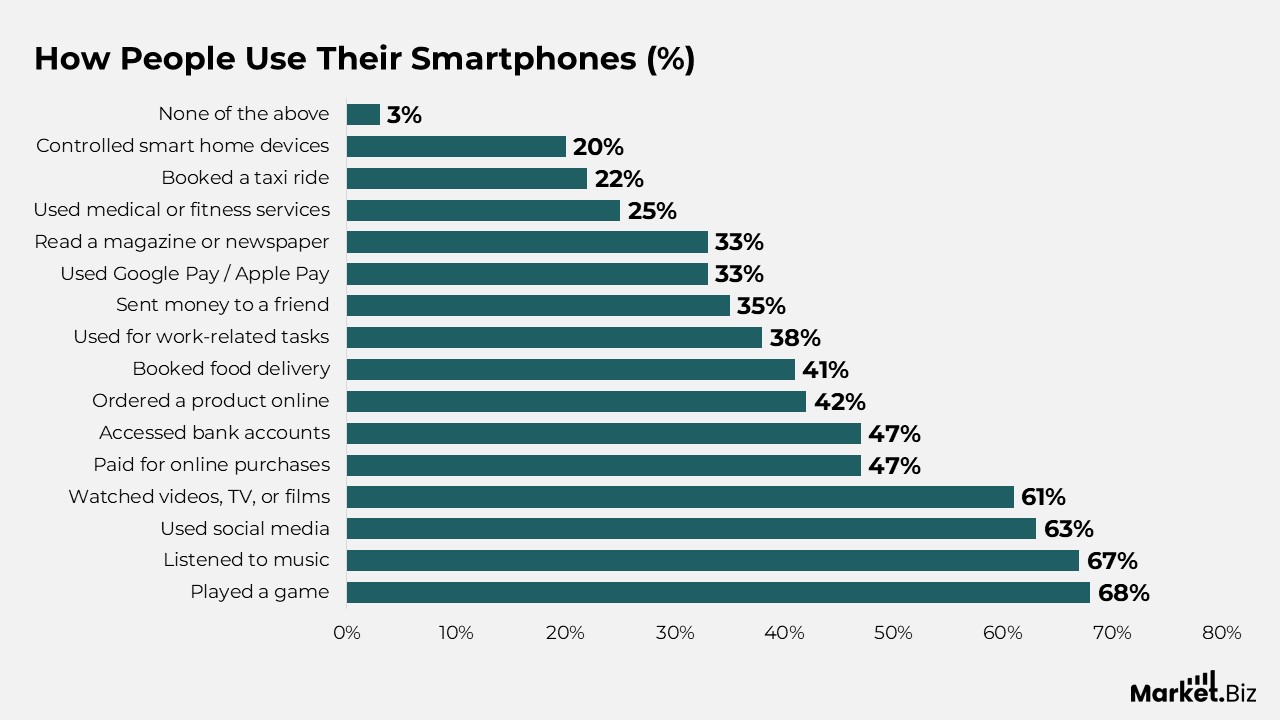
How People Use Their Smartphones
- About 68% of smartphone users play games, making it the most popular mobile activity.
- Listening to music comes next, with 67% of users engaging in this entertainment activity.
- Social media usage remains strong, with 63% of people using their smartphones for social networking.
- Watching videos, TV, or films is a preferred activity for 61% of users.
- Paying for online purchases is done by 47% of smartphone owners, tying with accessing bank accounts, also at 47%.
- Ordering products online is part of the routine for 42% of users.
- 41% of smartphone users book food delivery services.
- 38% of users perform work-related tasks on mobile devices.
- Sending money to friends is common for 35% of users.
- 33% of users use mobile wallets such as Google Pay or Apple Pay for payments.
- Similarly, 33% read magazines or newspapers on their smartphones.
- Applications related to medical or fitness services are used by 25% of users.
- Taxi or ride-booking apps are accessed by 22% of smartphone users.
- 20% of users control smart home devices via smartphones.
- Only 3% of users report not engaging in any of these listed activities.
(Source: Exploding Topics, DataReportal, StatCounter)
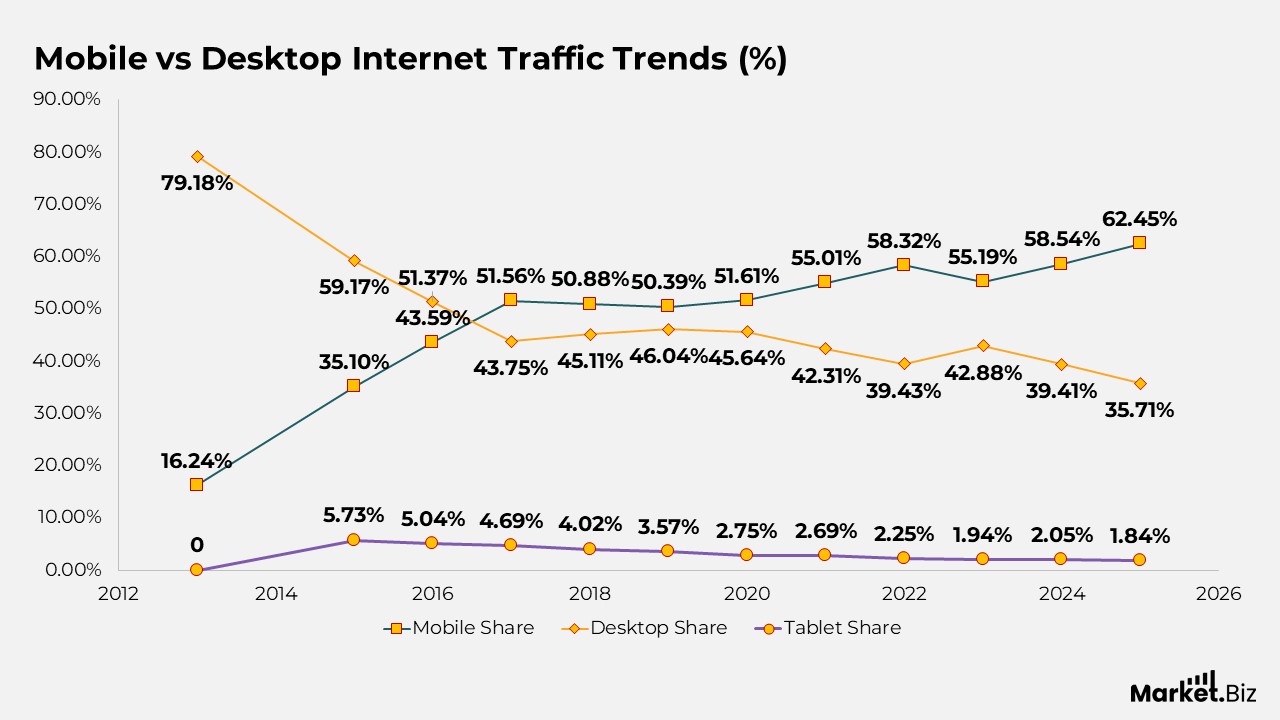
Mobile vs Desktop Internet Traffic Trends
- In 2013, mobile users accounted for only 16.24% of internet traffic, while desktops dominated with 79.18%, highlighting the early imbalance between device types.
- A decade ago, desktop traffic still held nearly 60%, showing how recently mobile usage began its rapid climb.
- Mobile traffic surpassed desktop for the first time in late 2016, marking a major shift in global browsing behavior.
- By 2018, mobile devices accounted for 50.88% of all website visits, desktops for 45.11%, and tablets for 4.02%.
- In 2015, desktop traffic was 59.17%, mobile 35.1%, and tablets 5.73%.
- In 2016, desktops fell to 51.37%, while mobile share rose to 43.59%, with tablets at 5.04%.
- 2017 marked the turning point, with mobile at 51.56%, desktop at 43.75%, and tablets at 4.69%.
- In 2018, mobile continued its lead at 50.88%, desktop reached 45.11%, and tablets dropped to 4.02%.
- During 2019, mobile accounted for 50.39% of traffic, desktops for 46.04%, and tablets for 3.57%.
- In 2020, mobile usage climbed to 51.61%, desktop to 45.64%, and tablets to 2.75%.
- The shift accelerated in 2021, with mobile at 55.01%, desktop at 42.31%, and tablets at 2.69%.
- In 2022, mobile traffic reached 58.32%, desktop traffic declined to 39.43%, and tablet traffic dropped to 2.25%.
- In 2023, mobile share reached 55.19%, desktop share rose slightly to 42.88%, and tablet share fell to 1.94%.
- By 2024, mobile traffic accounted for 58.54%, desktops for 39.41%, and tablets for 2.05%.
- In 2025, mobile accounted for 62.45% of internet traffic, desktop decreased to 35.71%, and tablets continued to shrink to 1.84%.
(Source: Fifty Pixels Ltd.)
Global Mobile Internet Penetration and Usage Statistics
- Around 64.4% of the global population can access the internet through a mobile phone.
- Countries such as Ireland, Saudi Arabia, Norway, and the UAE lead mobile internet adoption with a remarkable 99% penetration rate each.
- Mobile internet penetration is strong in major regions, reaching 91.8% in the US, 97.8% in the UK, and 96.9% in Singapore.
- The worldwide average mobile download speed stands at 41.54 Mbps, reflecting steady improvements in mobile network performance.
- The fastest mobile internet speeds are recorded in Qatar (174.56 Mbps), the UAE (178.25 Mbps), and Norway (143.55 Mbps).
- The slowest average speeds appear in Afghanistan (4.14 Mbps), Cuba (3.44 Mbps), and Venezuela (6.59 Mbps).
- In the US, 63% of all search activity comes from mobile devices.
- About 15% of adults in the US rely exclusively on mobile phones for internet access, with no home broadband connection.
- The mobile browser market is dominated by Chrome (64.86%), followed by Safari (24.86%) and Samsung Internet (4.49%).
- Users spend nearly 90% of their mobile screen time within apps rather than mobile websites.
- In some regions, the average time spent in mobile apps increased by as much as 50% between 2020 and 2022.
- Countries such as Singapore, Indonesia, and Australia record some of the highest app usage levels, often exceeding 5 hours per day.
- Collectively, people spend more than 100 billion hours annually using shopping apps.
- Mobile apps outperform mobile websites by 157% on average, achieving higher conversion rates.
(Source: Fifty Pixels Ltd., Statista, Speedtest, Pew Research)
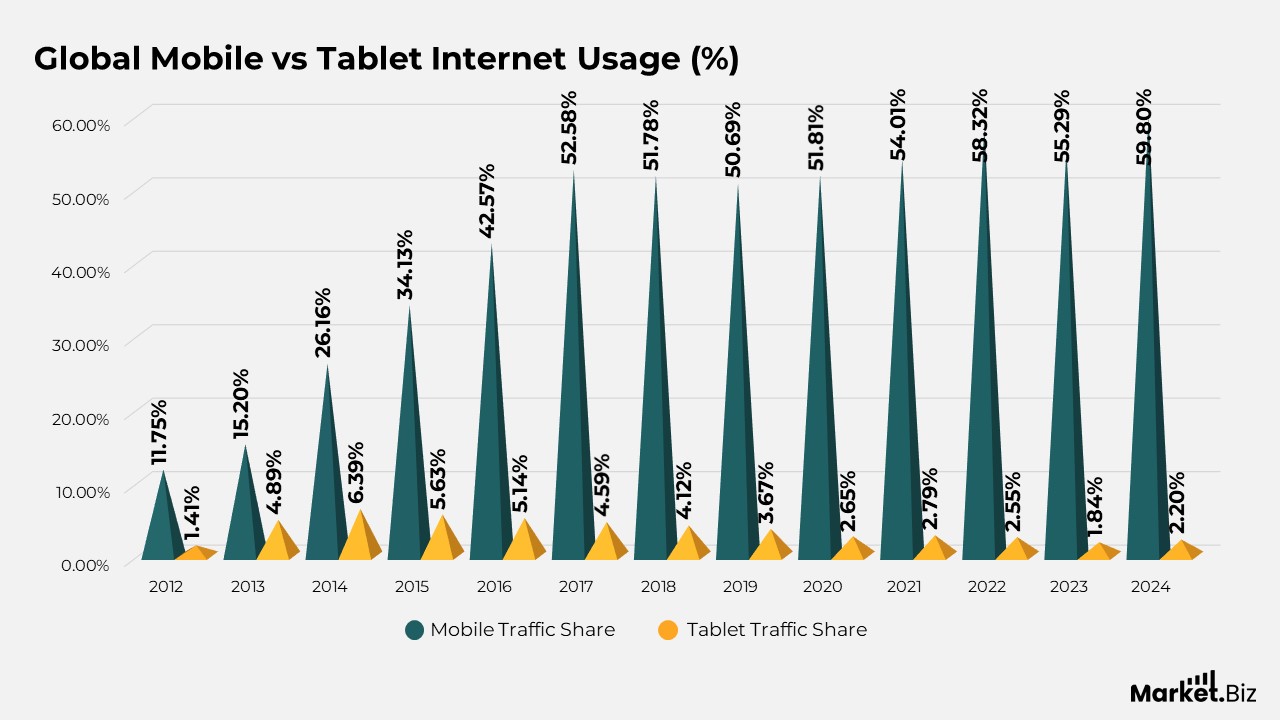
Global Mobile vs Tablet Internet Usage
- In 2012, mobile devices accounted for 11.75% of global internet traffic, while tablets contributed 1.41%.
- By 2013, mobile traffic rose to 15.20%, with tablet usage increasing to 4.89%.
- In 2014, mobile traffic saw a strong jump to 26.16%, while tablet traffic rose to 6.39%.
- The upward trend continued in 2015, with mobile at 34.13% and tablets at 5.63%.
- In 2016, mobile internet share reached 42.57%, while tablet usage slightly decreased to 5.14%.
- Mobile devices crossed the halfway mark in 2017, capturing 52.58% of traffic, with tablets at 4.59%.
- In 2018, mobile traffic remained strong at 51.78%, while tablet share declined to 4.12%.
- The following year, 2019, saw mobile usage at 50.69%, while tablets continued to drop to 3.67%.
- In 2020, mobile traffic increased again to 51.81%, while tablet usage declined further to 2.65%.
- Mobile usage grew to 54.01% in 2021, while tablets contributed 2.79% of global traffic.
- In 2022, mobile traffic rose significantly to 58.32%, with tablet usage dropping to 2.55%.
- In 2023, mobile traffic accounted for 55.29%, while tablets dropped further to 1.84%.
- By 2024, mobile internet share is expected to reach 59.80%, with tablets contributing an estimated 2.20%.
(Source: Priori Data)
Internet Usage by Region
- In 2024, nations such as Malaysia, the UAE, Singapore, and Switzerland recorded mobile internet usage levels close to 95%, indicating that mobile connectivity is deeply embedded in everyday routines across these regions.
- New Zealand had a strong mobile internet penetration rate of 94.6%, while Kuwait, the UAE, and Bahrain ranked among the world’s leaders in average mobile internet speed.
- As of January 2024, mobile phones accounted for 87% of all web page views in Nigeria, making it among the most mobile-dependent digital markets. Vietnam followed with 86.5% of its web traffic coming from mobile devices.
- Countries including Portugal, Belgium, and Canada recorded significantly lower mobile reliance, each with less than 43% of their national internet activity coming from mobile devices.
- Japan had the lowest mobile internet share among major economies, with mobile devices accounting for only 37.6% of total online usage at the beginning of 2024.
- Across Asia, mobile traffic continued its upward trend, reaching 68.8% of overall web usage in March 2024, slightly higher than the 68% recorded in the previous year.
- The Asia-Pacific region hosts some of the world’s largest mobile-connected populations, with China having nearly 1.1 billion mobile internet users in 2024 and India close behind with about 1.05 billion.
Further,
- In terms of monthly mobile data consumption, Nepal, India, and Bhutan led the region in 2024, with smartphone users averaging nearly 35 GB per month, driven by heavy engagement with activities such as 4K video streaming and mobile gaming.
- In many African nations, mobile devices account for more than half of all internet traffic. In contrast, in the United States, mobile usage remains comparatively lower, contributing to around 45.49% of total online activity.
- Nigeria leads the world in mobile internet dependence, with 86.67% of its online traffic generated by mobile devices.
- Vietnam follows closely at 86.51%, showcasing one of the strongest mobile-first digital ecosystems in Asia.
- In South Africa, 80.9% of internet usage comes from mobile devices, highlighting the region’s reliance on mobile connectivity.
- Saudi Arabia also records a high mobile penetration rate of 80.59%, reflecting widespread smartphone adoption across the country.
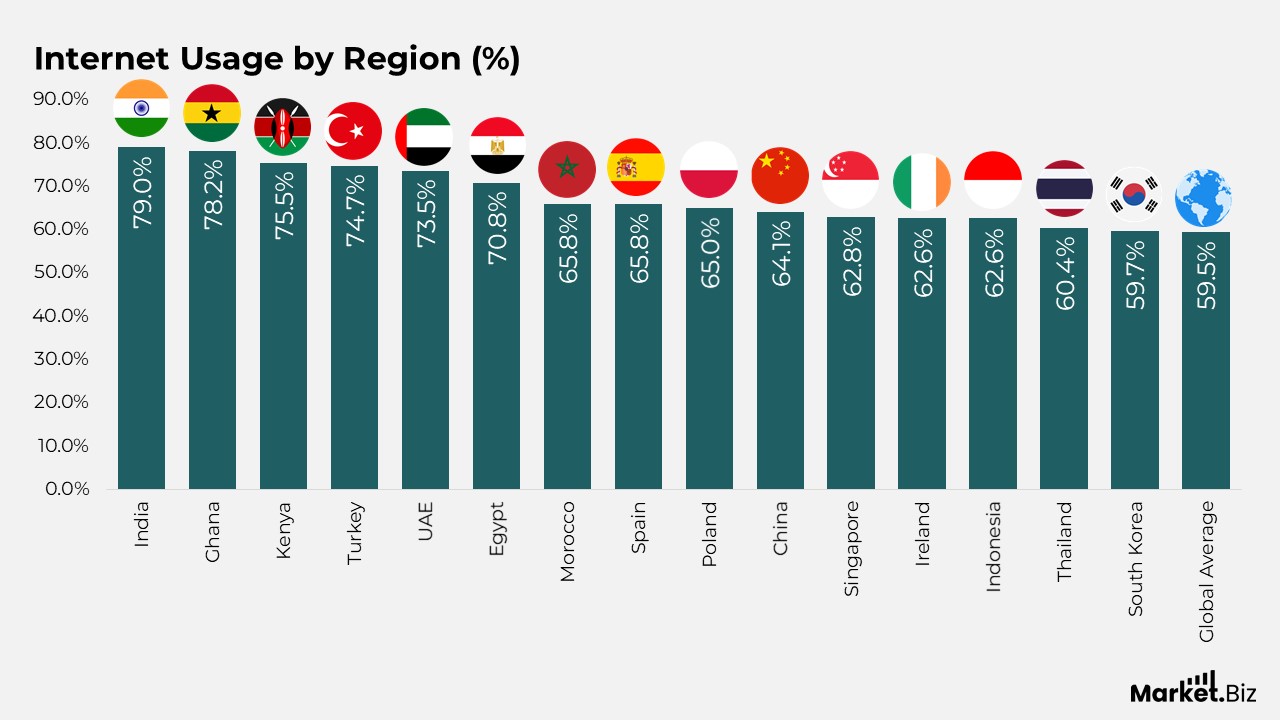
- India shows strong engagement with 79% of its online activity taking place on mobile devices.
- Ghana demonstrates significant mobile dependence, with 78.19% of its internet traffic coming from smartphones.
- In Kenya, mobile devices account for 75.46% of total online usage, reinforcing Africa’s mobile-first momentum.
Moreover
- Turkey logs 74.65% mobile-based internet usage, indicating a dominant mobile user base.
- The UAE maintains high connectivity levels, with 73.53% of online activity driven by mobile devices.
- Egypt records 70.8% mobile internet usage, placing it among the leading mobile-first nations in the Middle East and Africa.
- Morocco and Spain show similar usage patterns, with 65.81% and 65.8% of traffic coming from mobile devices, respectively.
- Poland displays a mobile share of 64.95%, while China follows closely at 64.09%, reflecting strong mobile adoption in both markets.
- Singapore stands at 62.81%, indicating a consistently high mobile internet penetration rate.
- Ireland registers 62.61% mobile usage, further highlighting Europe’s growing shift toward mobile browsing.
- Indonesia records 62.55%, aligning with Southeast Asia’s broader mobile-driven digital behavior.
- Thailand has 60.39% mobile internet usage, indicating a strong reliance on smartphones for online access.
- SouthKorea posts a mobile share of 59.65%, slightly above the global benchmark.
- The worldwide average stands at 59.45%, confirming the global transition toward mobile-first internet usage.
(Source: Statista, KeywordsEverywhere)
Global Social Media Platforms by Monthly Active Users
- Facebook remains the world’s largest social platform with 3.07 billion monthly active users.
- YouTube follows with 2.510 billion users engaging monthly with video content.
- WhatsApp connects 2.00 billion people globally, reflecting its dominance in messaging.
- Instagram matches this reach with 2.00 billion monthly users driven by visual content.
- WeChat serves 1.30 billion users, making it China’s leading multifunctional app.
- TikTok engages 1.050 billion monthly users through short-form video experiences.
- Facebook Messenger maintains a strong presence with 0.930 billion active users.
- Douyin, TikTok’s Chinese counterpart, draws 0.710 billion monthly users.
- Telegram continues to expand with 0.700 billion users relying on secure messaging.
- Snapchat attracts 630 million monthly users, especially younger audiences.
- Kuaishou reaches 0.620 billion active users with short video and livestream content.
- Sina Weibo engages 0.580 billion users, ranking among China’s biggest social platforms.
- QQ maintains 0.570 billion active accounts, showing lasting popularity.
- Twitter (X) brings together 0.550 billion monthly users for real-time conversations.
- Pinterest inspires 0.440 billion users monthly through visual discovery and ideas.
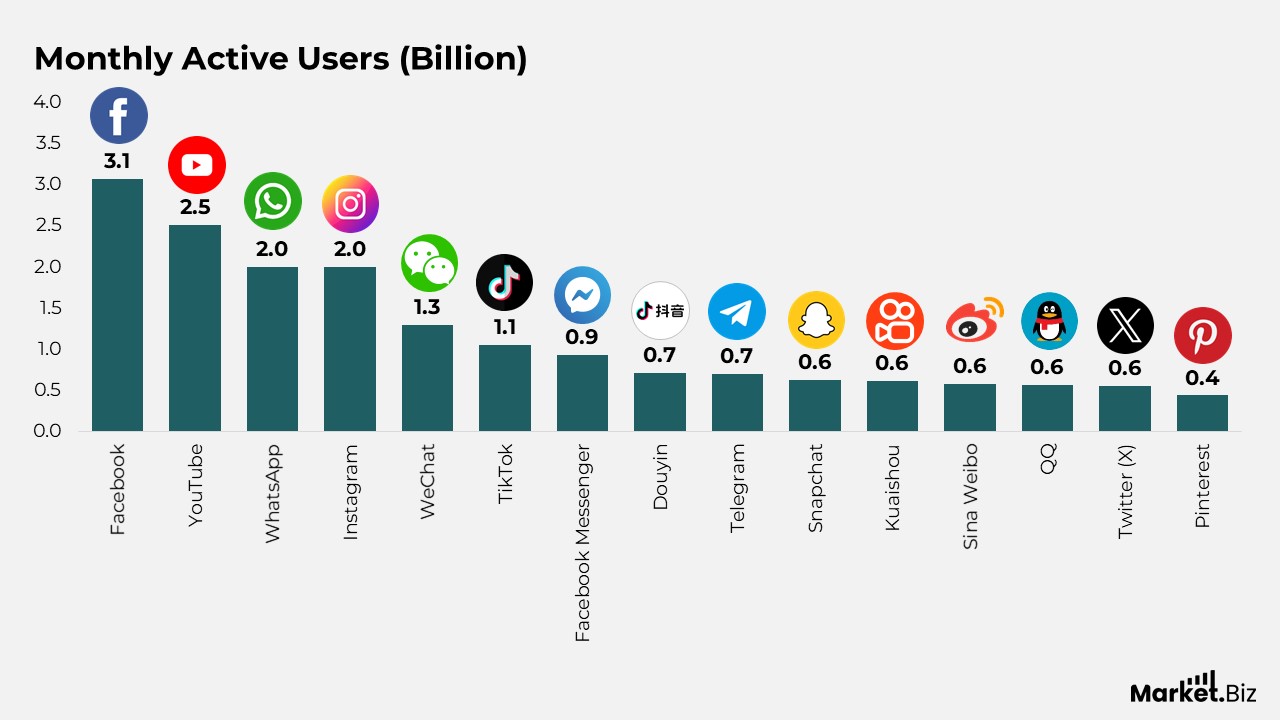
(Source: Demandsage)
Conclusion
Mobile Internet Usage Statistics: Mobile internet usage has firmly established itself at the centre of global digital behaviour, with smartphones becoming the primary way to access online services across most regions. The steady rise in mobile traffic, supported by expanding network speeds, lower data costs, and the widespread use of mobile apps, continues to push the world toward a mobile-first ecosystem.
Although adoption levels differ by country, the overall direction is unmistakable mobile connectivity now shapes everyday communication, commerce, entertainment, and work. As mobile infrastructure strengthens and 5G deployments accelerate, mobile internet usage is set to expand even further, opening new pathways for innovation and digital growth.
FAQ’s
Mobile devices account for over half of global internet traffic, and this share continues to grow as more users turn to smartphones for browsing, communication, entertainment, and everyday online activities.
Mobile reliance is strongest in Africa and several Asian countries. Nations such as Nigeria, Vietnam, and South Africa record some of the highest mobile traffic rates due to the accessibility of smartphones and cost-effective mobile data plans.
Mobile speeds differ significantly across countries. Regions like the UAE, Qatar, and Norway deliver some of the fastest mobile networks worldwide, while others experience slower performance depending on infrastructure strength and coverage.
Rising smartphone ownership, lower data costs, expanding 4G and 5G coverage, and the growing popularity of mobile apps for shopping, payments, entertainment, and work all contribute to the surge in mobile internet usage.
The rollout of 5G networks is significantly increasing mobile data usage by providing faster speeds, improved streaming quality, reduced gaming latency, and more reliable connectivity, further anchoring mobile devices at the centre of digital life.