Introduction
Online Shopping Statistics: Online shopping has revolutionized the retail industry, providing consumers with unparalleled convenience, a wide range of products, and easy access to services. Factors such as greater internet accessibility, the rise of mobile commerce, and shifting consumer preferences have contributed to the substantial growth of the e-commerce market.
Online shopping statistics offer key insights into market trends, consumer habits, demographic shifts, popular product categories, and the technologies driving the future of retail. Understanding these insights is essential for both businesses and consumers to successfully navigate the competitive online marketplace and keep up with emerging trends in digital shopping.
Editor’s Choice
- 2.71 billion people globally engage in online shopping.
- The estimated number of online shoppers in the United States has reached 273.49 million.
- Global retail e-commerce sales total $6.151 trillion.
- Mobile e-commerce sales account for $4.089 trillion worldwide.
- 48% of online shoppers abandon their carts due to extra costs, including fees, taxes, and shipping charges.
- 31% of online shoppers purchase at least once a month.
- 51% of shoppers in the United States use voice search to find products.
- As of 2023, there are approximately 274.70 million online buyers in the U.S., with over 81% of the total U.S. population shopping online.
- 93% of millennials plan to make purchases during Black Friday or Cyber Monday sales.
- Total e-commerce revenue in the United States stands at $1,137 billion.
- Global retail e-commerce sales total $6,310 billion.
- U.S. retail e-commerce sales are expected to reach $1,072.81 billion.
- By 2026, 199.50 million mobile shoppers are expected in the United States.
- Experts predict mobile e-commerce sales will hit $710 billion by 2025.
- 108 million social shoppers in the U.S. are expected by 2025.
- U.S. social e-commerce sales are projected to reach $1.2 trillion by 2025.
- 48% of online shoppers abandon their carts due to high additional costs.
- E-commerce retailers lose approximately $18 billion annually due to abandoned carts.
- Gen Z in the U.S. is expected to have a buying power of $44 billion by 2025.
- 81.3% of millennials shop online at least once per month.
- Before the pandemic, 36% of Americans ordered groceries online, but post-pandemic, 55% of Americans now shop for groceries online.
- Brands in the United States are expected to spend about $4.62 billion on influencer marketing.
General Online Shopping Statistics
- In 2023, 35% of the global population shopped online weekly.
- By 2027, 22.6% of all global retail purchases are expected to be made online.
- 92% of consumers in the U.S. shop online.
- The number of online shoppers in the U.S. is projected to grow by 60 million between 2024 and 2029.
- 43% of U.S. consumers prefer shopping online over in-store shopping, making it the country with the highest online shopping preference.
- Only 33% of global consumers shop in physical stores without using any digital tools.
- 48% of online shoppers in the U.S. cite free delivery as the main reason they shop on Amazon.
- Clothing is the most popular category for online shopping in the U.S., with 43% of consumers ordering clothes online in the past year.
- 63% of global consumers have purchased products directly from a brand’s website.
Moreover
- The global online shopping cart abandonment rate was 70.19% in 2023.
- In the U.S., grocery delivery eCommerce revenue is expected to exceed $422 billion by 2028.
- 48% of consumers cite extra costs, like extra delivery fees, as the main reason for leaving their shopping carts.
- 76% of U.S. consumers want the ability to use their preferred payment method when shopping online.
- 49% of online shoppers use digital wallets to pay for their online purchases.
- Only 3% of U.S. consumers reported shopping online for the first time through the COVID–19 pandemic.
- 52% of online shoppers worldwide search for products internationally.
- 42.6% of online shoppers consider delayed shipments in customs as the biggest challenge when shopping internationally.
- Clothing and footwear are the most popular categories for cross-border online shopping, with 39% of consumers purchasing these items from abroad.
- 83% of shoppers conduct online research before visiting physical stores.
- 35% of people consider online marketplaces their primary source of inspiration when shopping.
(Source: Digital Silk, inBeat Agency, Statista)
How Many People Are Shopping Online?
- An estimated 2.71 billion people worldwide are expected to shop online in 2024.
- 2.64 billion people shopped online in 2023, and 2.77 billion are projected to make purchases in 2025.
- Global online shopper growth from 2022 to 2023 was 3.1%.
- The Middle East & Africa experienced the highest growth in online shoppers, with a 5.2% increase from 2022 to 2023.
- Latin America saw a 4.6% increase in online shoppers.
- Asia-Pacific experienced a 3.8% growth in online shoppers.
- Central & Eastern Europe had a 3.2% growth in online shopping.
- North America grew by 2.1% in online shoppers.
- Western Europe showed the lowest growth, with a 1.1% increase.
- The global online shopping market grew by 3.4% in 2023.
(Source: DemandSage, Oberlo, eMarketer)
Virtual Shopping Assistant Market Size
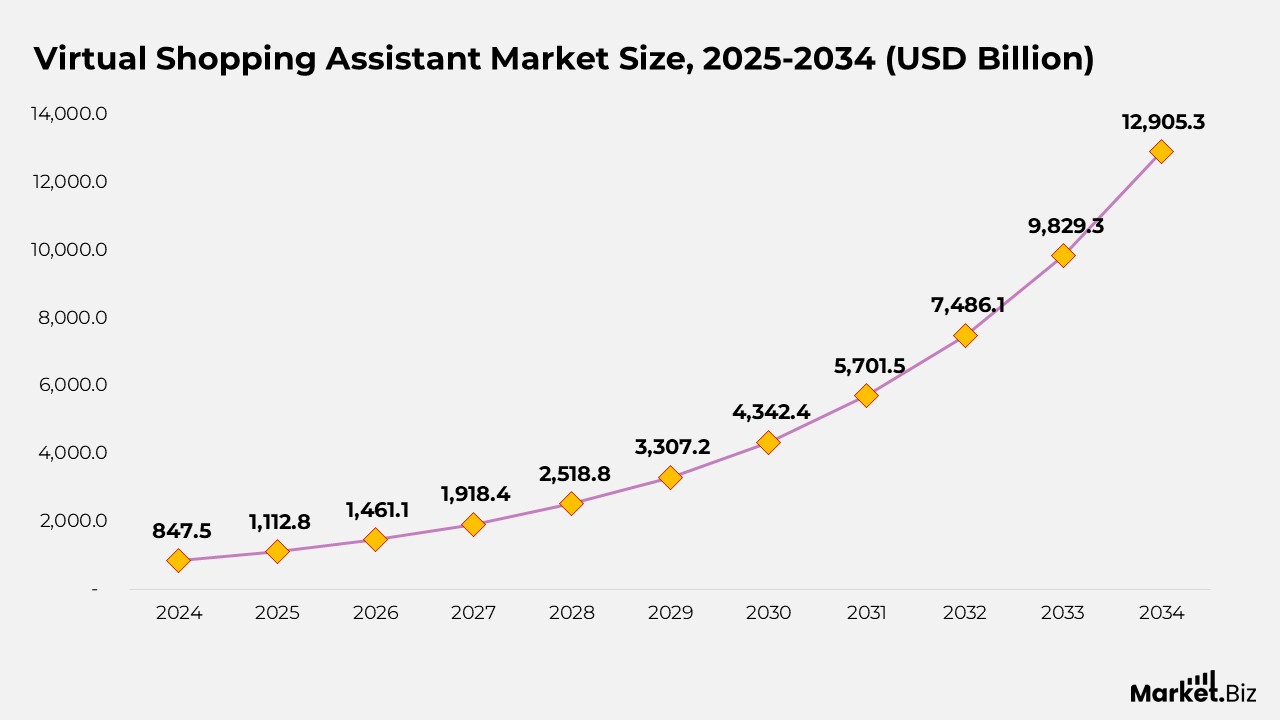
- According to Market.us, the virtual shopping assistant market is expected to rise from $1,112.8 billion in 2025 to $12,905.9 billion by 2034, representing a compound annual growth rate (CAGR) of 31.3% from 2025 to 2034.
- The growth of the virtual shopping assistant market is driven by increased adoption of conversational commerce and advancements in natural language processing (NLP) and machine learning, allowing more accurate and natural interactions.
- In 2024, the solutions segment captured the largest market share at approximately 76%, driven by the demand for ready-to-deploy platforms offering personalized shopping experiences.
- Natural Language Processing (NLP) led technology adoption with a 24% market share, enabling virtual assistants to process and understand human language naturally.
- The smartphone and tablet platform dominated with a 45% market share in 2024, as mobile devices became the primary medium for online shopping.
- Consumers increasingly use handheld devices for product discovery, price comparisons, and immediate support, reinforcing the dominance of mobile commerce.
Moreover
- Cloud-based deployment held 78% of the market share in 2024, favored for its flexibility, scalability, and lower upfront costs.
- The growing trend of Software-as-a-Service (SaaS) has bolstered the prevalence of cloud-based virtual assistant solutions.
- Large enterprises held 63% of the market share in 2024, driven by significant investments in customer experience transformation.
- The product discovery and search application led the market with a 20% share, driven by consumer demand for fast, intuitive navigation during online shopping.
- The retail and e-commerce sector held 28% of the market share, reflecting the need for personalized digital shopping experiences and continuous customer support.
- North America dominated the market with a 35.8% share and over USD 303 billion in revenue in 2024, supported by early adoption and strong e-commerce infrastructure.
- The U.S. virtual shopping assistant market was valued at USD 284.3 billion in 2024, projected to reach USD 3,544 billion by 2034, with a CAGR of 28.7%.
(Source: Market.us)
Home Shopping Services Market Size
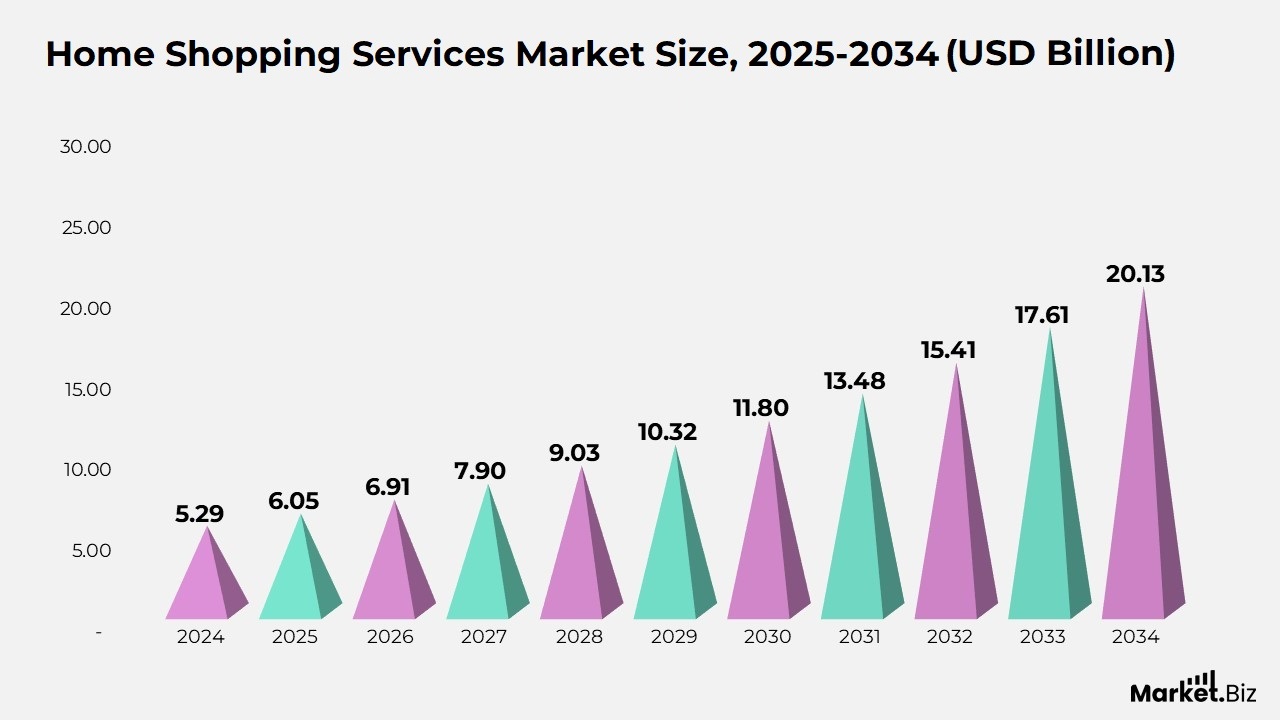
- According to Market.us, the home shopping services market is expected to rise from $6.05 billion in 2025 to $20.13 billion by 2034, representing a compound annual growth rate (CAGR) of 14.30% from 2025 to 2034.
- The growth of the home shopping services market is fueled by technological advancements, shifting consumer behavior, and increased internet access, with convenience being a key driver.
- In 2024, the E-commerce and Mobile Shopping segment dominated the market, capturing over 75% of the share, driven by the popularity of online shopping and widespread smartphone adoption.
- The Apparel & Accessories segment held the largest market share in 2024, surpassing 30%, as consumers increasingly prefer shopping for fashion items online.
- E-commerce platforms and mobile shopping apps have transformed the fashion industry, offering a wide variety of styles, sizes, and brands, making shopping more convenient.
- In North America, the United States led the market with a size of USD 1.7 billion and a strong CAGR of 12.4%, owing to advanced digital infrastructure and high internet penetration.
- The U.S. alone contributed USD 1.7 billion to the North American home shopping services market, driven by continuous technological innovation in e-commerce and mobile apps.
(Source: Market.us)
Social Media Online Shopping Statistics
- In 2022, $992 billion was spent on social media commerce.
- Spending on social media commerce is projected to reach $8.5 trillion by 2030.
- The United States has 106.8 million people who shop online via social media.
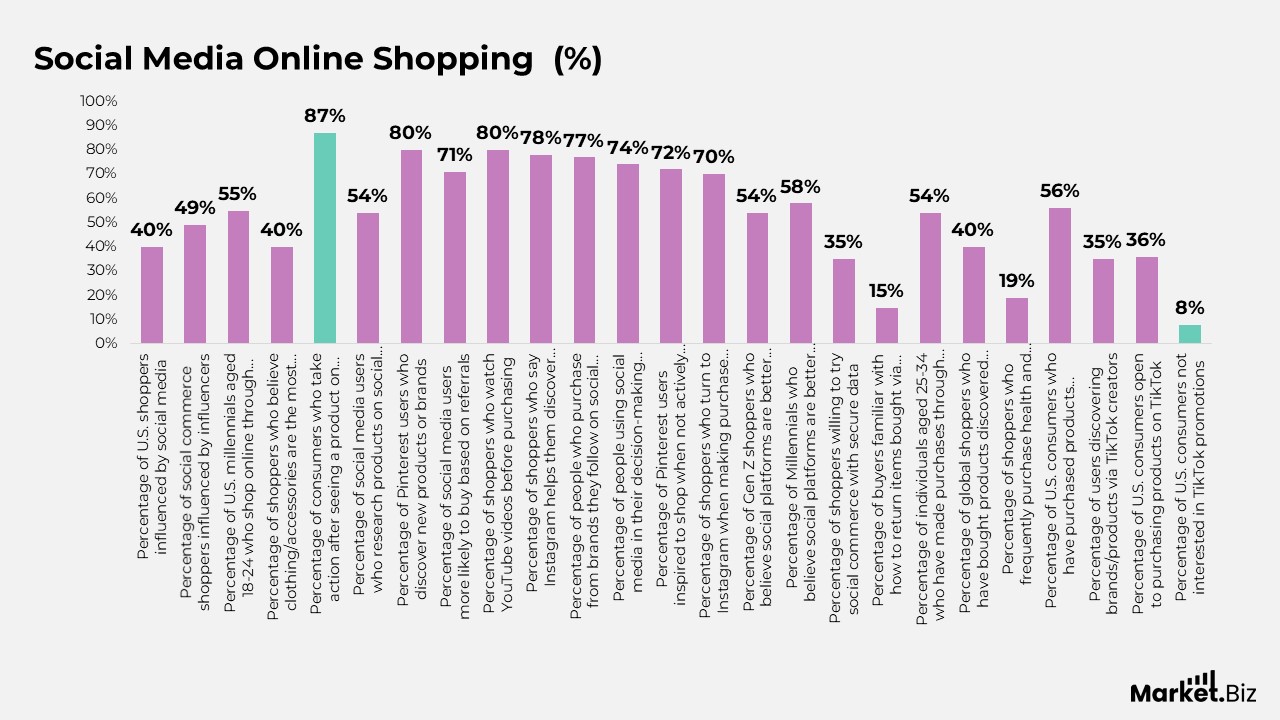
- 40% of U.S. shoppers are inclined by social media when purchasing a product.
- Clothing and accessories are the leading product category on social media.
- 49% of social commerce shoppers say they make a purchase based on influencer recommendations.
- Younger shoppers, particularly Millennials and Gen Z, are 2 to 3 times more likely to shop using new touchpoints like social media, virtual try-ons, and online live streams.
- 55% of U.S. millennials aged 18 to 24 shop online through social media.
- 40% of shoppers believe clothing or accessories are the most influential products on social media.
- 87% of consumers take action after seeing a product on Instagram.
- 54% of social media users turn to social media platforms to research products.
- 80% of Pinterest users discover new products or brands through the platform.
- 71% of social media users are more likely to buy products and services based on social media referrals.
- 80% of shoppers watch YouTube videos related to their intended purchase at the beginning of their shopping journey.
Moreover
- 78% of shoppers say Instagram plays a significant role in helping them discover new brands.
- 77% of people purchase from brands they follow on social media.
- 74% of people use social media as part of their decision-making process when buying products.
- 72% of Pinterest users say the platform inspires them to shop, even when they aren’t actively looking for anything.
- 70% of shoppers turn to Instagram when making purchase decisions.
- 54% of Gen Z shoppers and 58% of Millennials believe social platforms are more effective than online searches for discovering new products.
- There are over 250 Facebook shops globally.
- Consumer spending on TikTok has surpassed $2.5 billion worldwide.
- There are around 24 million TikTok users in the U.S.
- 35% of shoppers would be willing to try social commerce if they were assured that their data would remain secure.
- Only 15% of buyers are familiar with how to return items purchased through social media.
- 54% of individuals aged 25-34 have made purchases through social media.
- 40% of global shoppers have bought products they discovered on YouTube.
- 19% of shoppers frequently purchase health and wellness products via social media.
- Social commerce is projected to reach $2.9 trillion by 2026.
- 56% of U.S. customers have purchased products helped or promoted on TikTok.
- 35% of users discover brands and products through TikTok creators.
- 36% of U.S. consumers are open to buying products promoted or advertised on TikTok.
- 8% of U.S. customers are not involved in getting products helped or advertised on TikTok.
(Source: DemandSage, Oberlo, Statista)
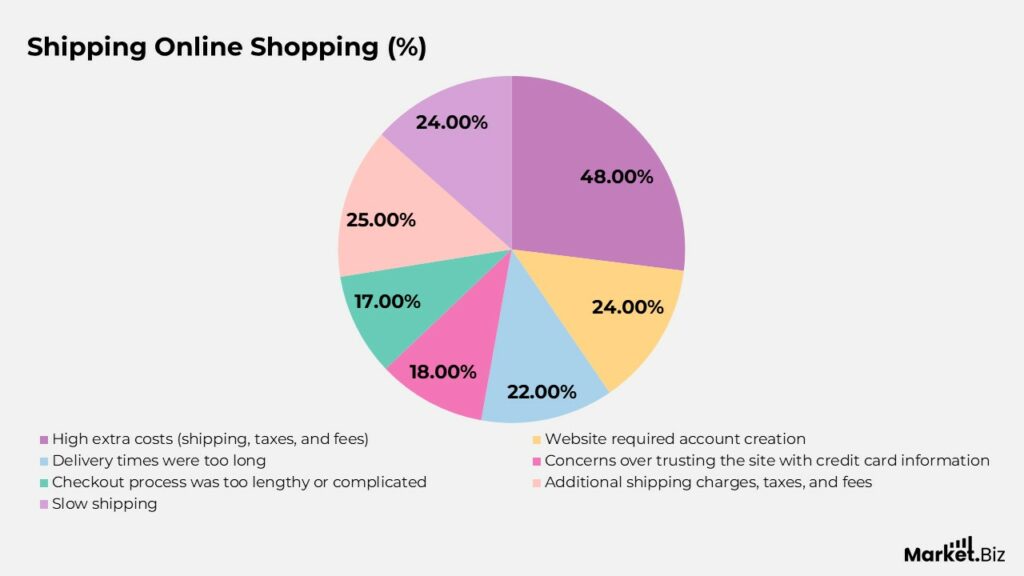
Shipping Online Shopping Statistics
- The majority of cart abandonment is due to high additional charges such as shipping, taxes, and fees. According to the latest 2022 data, the primary reasons for online shopping cart abandonment are as follows:
- 48%: Extra costs, including shipping, taxes, and fees, were too high.
- 24%: The website required account creation.
- 22%: Delivery times were too long.
- 18%: Concerns over trusting the site with credit card information.
- 17%: The checkout process was too lengthy or complicated.
- Additional shipping charges, taxes, and fees led 25% of online shoppers to abandon their carts. Meanwhile, slow shipping was the reason 24% of online shoppers decided not to complete their purchases.
(Source: Meetanshi Technologies LLP, DemandSage, Oberlo, Statista)
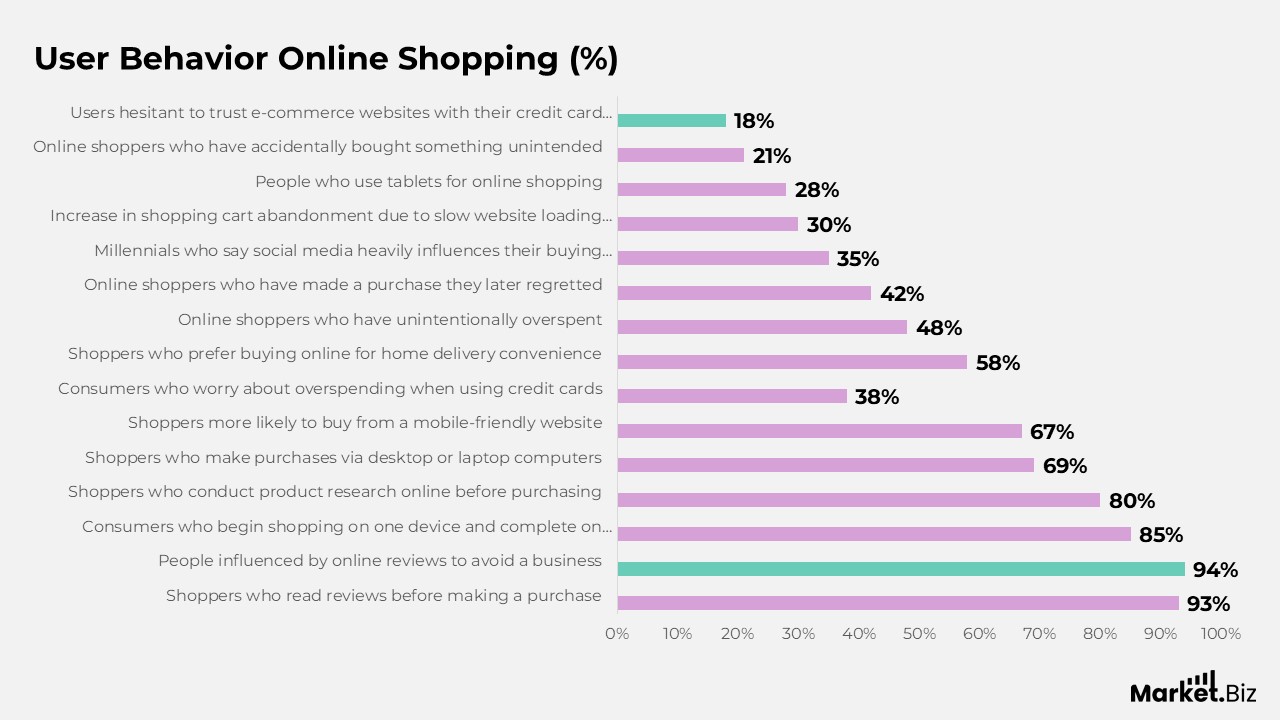
User Behavior Online Shopping Statistics
- 93% of shoppers read reviews before making a purchase.
- 94% of people report that online reviews influence them to avoid a business.
- 85% of consumers begin their shopping on one device and complete it on another.
- 80% of shoppers conduct product research online before purchasing.
- 69% of shoppers say they make purchases via desktop or laptop computers.
- 67% of shoppers are more likely to buy from a company with a mobile-friendly website.
- 38% of consumers worry about overspending when using credit cards.
- 58% of shoppers prefer buying online for the convenience of direct home delivery.
- 48% of online shoppers have unintentionally overspent.
- 42% of online shoppers have made a purchase they later regretted.
- 35% of Millennials admit that social media heavily influences their buying decisions.
- Shopping cart abandonment increases by 30% due to slow website loading times.
- 28% of people use tablets for online shopping.
- 21% of online shoppers have accidentally purchased something they didn’t intend to buy.
- On average, men spend $220 per transaction, compared to $151 for women shoppers.
- 18% of users are hesitant to trust e-commerce websites with their credit card information.
(Source: WebFX, Qualtrics, Kinsta Inc., Pew Research Center, Statista)
Mobile Online Shopping Trends
- In 2023, approximately 30% of global internet users who made weekly purchases opted for mobile shopping, reflecting the increasing reliance on mobile devices for e-commerce.
- Mobile commerce revenue is projected to reach around $2 trillion by 2024, indicating robust growth in this segment of online shopping.
- Mobile devices accounted for 66% of retail orders, highlighting their dominance in the online shopping landscape.
- Despite their popularity for adding items to shopping carts, mobile devices generally exhibit lower conversion rates at checkout compared to desktops, where users feel more secure.
- According to 2023 cart abandonment data, consumers are more hesitant to purchase high-priced or personal items, and desktops consistently have the lowest abandonment rates across all product categories.
- The impact of mobile commerce varies significantly by market:
- In the UK, mobile shopping represented more than 50% of all online retail sales in 2022.
- In Asia-Pacific, South Korea leads the region with 75% of online sales made via mobile, nearly double the rate in Japan.
- 44.4% of internet users in South Korea made weekly mobile purchases in 2023, compared to just 7.6% in Nigeria.
(Source: Shopify hub, Statista)
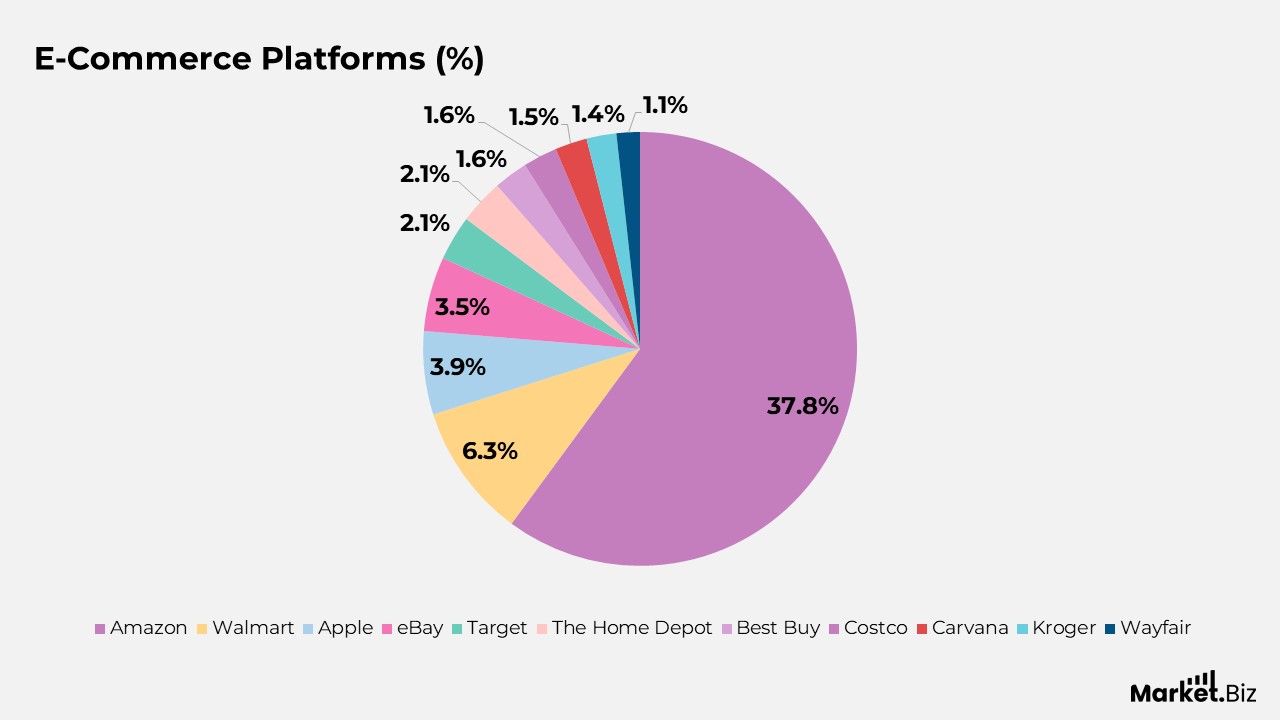
E-Commerce Platforms Statistics
- Amazon dominates the e-commerce sector with a 37.8% market share.
- Walmart holds 6.3% of the online retail market.
- Apple makes up 3.9% of the e-commerce market.
- eBay captures 3.5% of the online shopping market.
- Target represents 2.1% of the e-commerce industry.
- The Home Depot also holds 2.1% of the online retail market.
- Best Buy accounts for 1.6% of online retail sales.
- Costco secures 1.6% of the e-commerce market.
- Carvana has a 1.5% share in online shopping.
- Kroger holds 1.4% of the e-commerce market.
- Wayfair represents 1.1% of online retail.
(Source: Statista, DemandSage, Shopify, Oberlo)
Consumer Behavior In Online Shopping Statistics
- 31% of online shoppers purchase at least once a month, with the largest group, 818 million shoppers, buying products or services once per week.
- 24% of shoppers make an online purchase every two weeks, representing over 633 million online shoppers.
- 20% of online shoppers make a purchase every week.
- 24% of shoppers buy products online every two weeks.
- 31% of shoppers make at least one online purchase per month.
- 10% of shoppers buy online once every three months.
- 15% of shoppers make 3-4 online purchases within three months.
(Source: Statista, DemandSage, Shopify, Oberlo)
Categories Preferred by Online Shoppers
- 32% of shoppers prefer buying products from the Home & Kitchen category.
- 23% of shoppers purchase Beauty & Personal Care items.
- 20% of shoppers shop for Toys & Games.
- 18% of shoppers buy Clothing, Shoes & Jewellery.
- 17% of shoppers purchase Health, Household & Baby Care items.
- 16% of shoppers buy Sports & Outdoors products.
- 15% of shoppers shop for Arts, Crafts & Sewing supplies.
- 15% of shoppers purchase Books.
- 14% of shoppers shop for Kitchen & Dining products.
- 14% of shoppers buy Baby items.
- 14% of shoppers purchase Electronics.
- 13% of shoppers buy Tools & Home Improvements.
- 13% of shoppers purchase Pet Supplies.
- 12% of shoppers buy Office Products.
- 12% of shoppers shop for Garden & Outdoors items.
- 10% of shoppers purchase Grocery & Gourmet Food products.
(Source: Statista, DemandSage, Oberlo)
Trends in E-Commerce Payment Methods
- In 2023, digital wallets such as PayPal, Apple Pay, and Google Wallet made up 49% of global e-commerce transactions, solidifying their position as the most popular payment method worldwide.
- The popularity of Buy Now, Pay Later (BNPL) services like Afterpay and Klarna has increased, especially among younger consumers. By April 2024, BNPL is expected to account for nearly 11% of all online purchases in the U.S., with further growth anticipated as more retailers adopt these options.
- Despite the rise of digital wallets, credit and debit cards continue to be significant payment methods in the U.S. In 2023, 52% of consumers used debit cards for online shopping, while 47% opted for credit cards.
- In regions like Europe and Asia, 25% of people prefer using direct bank transfers for online purchases.
- In 2023, mobile wallets represented around 50% of all global e-commerce transactions. This share is expected to continue growing, with a projected compound annual growth rate (CAGR) of 14.9% from 2023 to 2027.
(Source: inBeat Agency, Statista, Pay.com, DemandSage)
Security Concerns in Online Shopping
- A ClearSale survey revealed that 92% of U.S. online shoppers are deeply concerned about security, considering it a critical factor when shopping online.
- 81% of respondents believe online fraud is widespread.
- 83% of shoppers stated they would be more likely to shop on websites that openly address their efforts to prevent fraud.
- 58% of consumers feel that retailers are not being “overly cautious” in preventing online fraud.
- According to a 2023 survey, 73% of consumers prioritize payment security when shopping online.
- 18% of users are hesitant to trust e-commerce stores with their credit card information.
- Phishing continues to be a significant threat, with online shopping brands accounting for 41.65% of all financial phishing attempts. This underscores the need for greater vigilance and improved security awareness to prevent data theft and phone tracking.
(Source: inBeat Agency, Statista, Pay.com, DemandSage)
Conclusion
Online shopping is experiencing rapid growth, fueled by advancements in technology, shifting consumer behaviors, and greater internet accessibility. Key statistics highlight that more consumers are opting for digital platforms to enjoy convenience, discover products, and experience smoother shopping journeys.
Social media has become a major influence in purchasing decisions, with platforms like Instagram, Pinterest, and TikTok playing significant roles in shaping consumer habits. As mobile and social commerce continue to rise, businesses need to adapt by providing personalized, mobile-optimized, and secure shopping experiences.
The future of online shopping is bright, with ongoing growth expected across different regions and product categories, emphasizing the need for businesses to stay ahead in the constantly evolving digital landscape.
FAQ’s
Technological innovations, the widespread use of mobile devices, a growing demand for convenience, and broader internet access primarily fuel the expansion of online shopping. Social media platforms have also become essential in influencing buying behavior, contributing significantly to this growth.
Social media has become a key factor in driving online purchases. For instance, 87% of consumers take action after encountering a product on Instagram, and 71% are more likely to make a purchase based on social media recommendations. Platforms like Instagram, Pinterest, and TikTok are crucial for discovering new products and shaping consumer buying choices.
Younger generations, especially Gen Z and Millennials, are more inclined to use new shopping avenues such as social media, virtual try-ons, and live-streamed events. For example, 54% of Gen Z and 58% of Millennials favor social media over traditional online searches for discovering new products.
Online reviews are vital in shaping purchasing decisions, with 93% of consumers reading reviews before buying and 94% stating that reviews often prompt them to avoid certain businesses. Positive reviews are essential for establishing trust and encouraging sales.
Mobile devices are increasingly central to online shopping, with 85% of shoppers starting on one device and completing their purchase on another. Additionally, 67% of consumers are more likely to make a purchase from websites optimized for mobile, underlining the importance of mobile-friendly e-commerce experiences.