
Introduction
Herbal Tea Statistics: Herbal tea, also referred to as tisane, encompasses a wide variety of caffeine-free infusions made from plant-based ingredients such as chamomile, ginger, peppermint, lemon balm, and Echinacea. When steeped in hot water, these herbs produce an array of flavors and potential health advantages.
Chamomile promotes relaxation, peppermint supports digestion, ginger offers comfort and warmth, lemon balm alleviates stress, and echinacea boosts immune function. Herbal teas can be enjoyed either hot or cold and can be sweetened according to personal taste.
Although they are generally considered safe, it is advisable to consume them in moderation and to consult a healthcare professional, particularly for those with health issues or who are using medicinal herbs. In essence, herbal tea serves as a delightful and healthful beverage choice that is cherished globally for its natural qualities and adaptability.
Editor’s Choice
- The worldwide revenue for the herbal tea market is projected to hit USD 6.9 billion by the year 2032.
- Starting from USD 3.5 billion in 2022, the overall market revenue has seen a steady increase, culminating in 6.9 billion USD by 2032.
- Leading the imports is the United States, which imported green tea valued at USD 110.94 million.
- The nutritional information is calculated based on a standard serving size of one mug, which is generally around eight fluid ounces or roughly 100 grams.
- Pakistan stands out as a prominent importer, holding an import share of 11.38% and bringing in herbal tea worth USD 640.57 million.
General Herbal Tea Statistics
- The worldwide herbal tea market is projected to achieve a revenue of USD 6.9 billion by the year 2032.
- Among the various flavors, chamomile dominates the market with a significant share of 34%. It is valued for its calming effects and subtle floral scent.
- Herbal tea generally contains minimal saturated fat, with levels reaching up to 0.005g, which accounts for 0% of the daily recommended intake.
- China stands out with a significant export share of 25.41%, amounting to an impressive export value of USD 2008 million.
- Pakistan is recognized as a major importer, holding an import share of 11.38% and bringing in herbal tea worth USD 640.57 million.
- Global production of green tea was estimated at 2.1 million metric tons (MMT) in 2021.
- In 2018, the United States Tea Association indicated that around 84% of tea consumption in the United States was linked to black tea.
Market Size Statistics of Herbal Tea
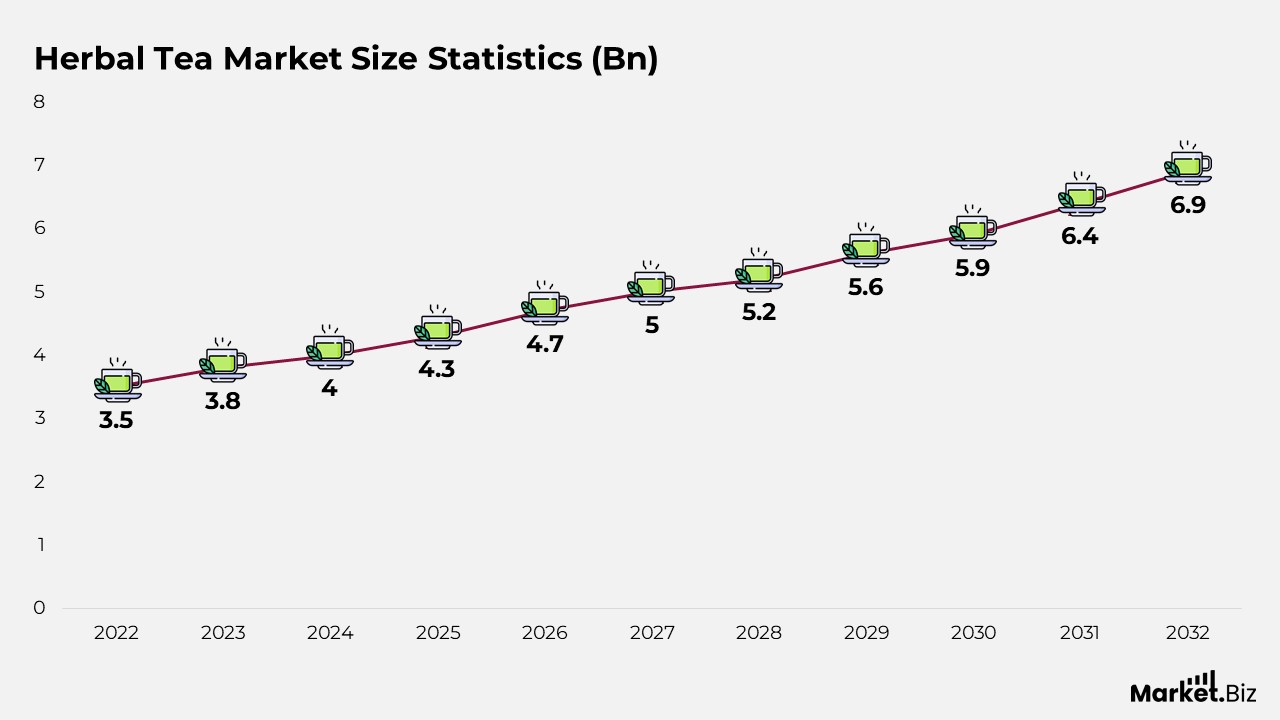
- The worldwide herbal tea market has shown steady growth over the years, achieving a compound annual growth rate (CAGR) of 7.2%. Revenue has been consistently rising from 3.5 billion USD in 2022 to an anticipated 6.9 billion USD by 2032.
- This positive trend indicates an increasing consumer preference for natural and health-oriented beverages.
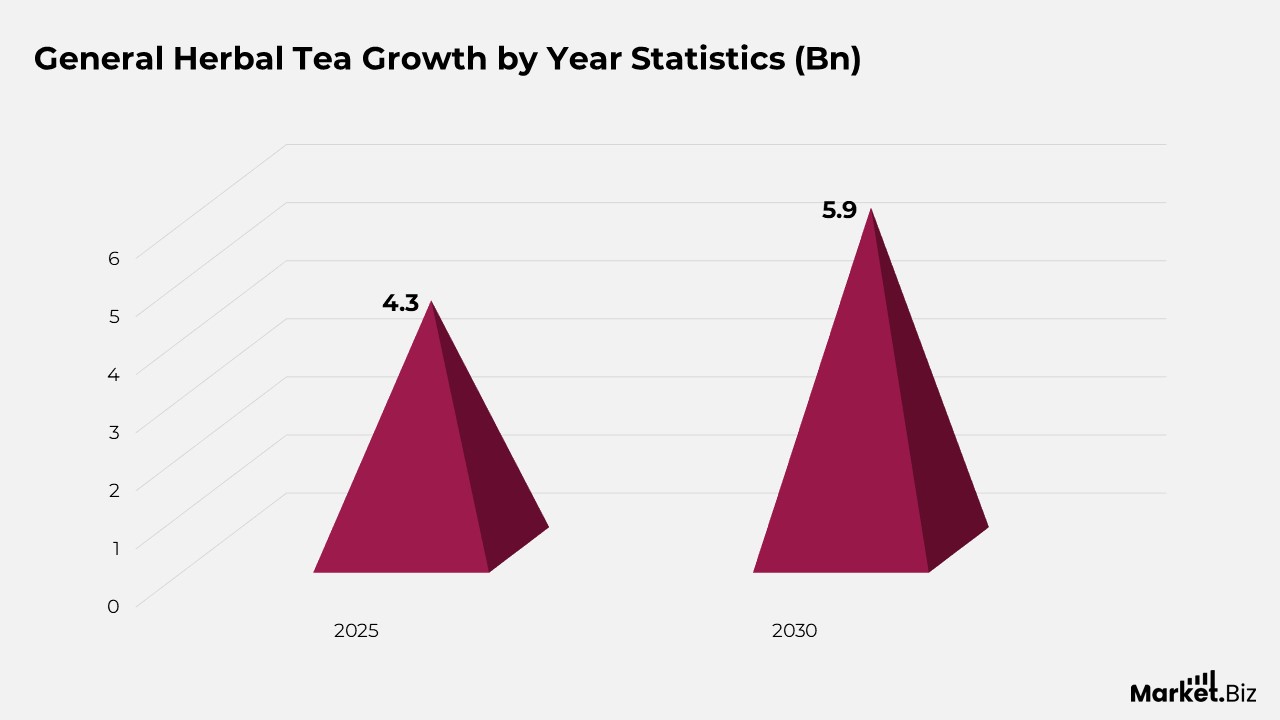
- In 2023, the revenue improved to 3.8 billion USD, followed by 4.0 billion USD in 2024 and 4.3 billion USD in 2025.
- The upward trend is expected to continue, with projected revenues of 4.7 billion USD in 2026, 5.0 billion USD in 2027, and 5.2 billion USD in 2028.
- By 2029, the market is projected to reach 5.6 billion USD, followed by 5.9 billion USD in 2030 and 6.4 billion USD in 2031.
- Ultimately, by the conclusion of 2032, the global herbal tea market is forecasted to achieve a remarkable milestone of 6.9 billion USD in revenue.
Herbal Tea Market by Raw Material Type Statistics
- Starting at 3.5 billion USD in 2022, the overall market revenue experienced a steady increase, culminating in 6.9 billion USD by 2032.
- This upward trend was reflected in the revenue from black, green, and yellow tea. In 2022, black tea produced 1.05 billion USD, green tea generated 1.58 billion USD, and yellow tea contributed 0.88 billion USD.
- By 2032, these amounts had significantly grown, with black tea at 2.07 billion USD, green tea revenue reaching 3.11 billion USD, and yellow tea at 1.73 billion USD.
Herbal Tea Market by Flavour Type Statistics
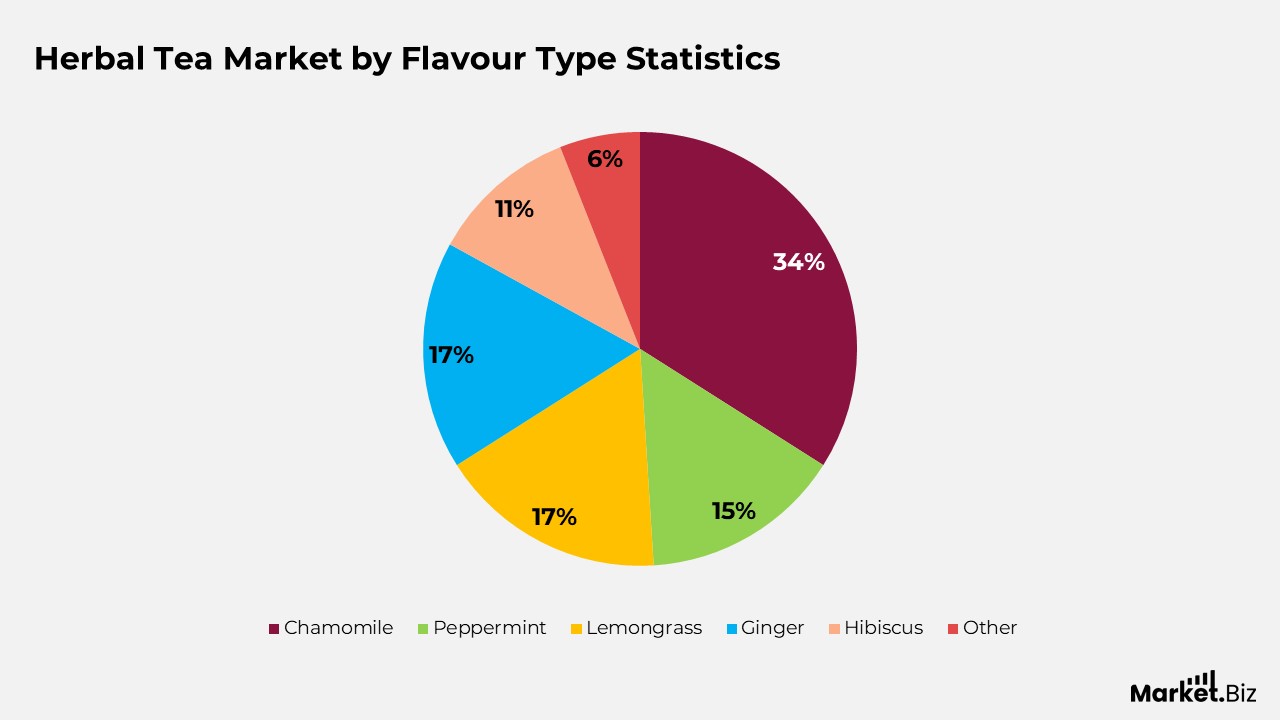
- Among the favored flavors, chamomile commands the largest market share at 34%, recognized for its calming effects and subtle floral scent.
- Peppermint follows closely, securing 15% of the market, esteemed for its invigorating flavor and digestive advantages.
- Lemongrass and ginger each account for a market share of 17%, with lemongrass providing a citrusy brightness. Ginger adds a warm, spicy character, enhancing the diverse flavor profile of herbal teas.
- Hibiscus, celebrated for its sharp and tangy taste, holds an 11% market share.
- The remaining 6% is attributed to various other flavors, underscoring the wide array of choices available to consumers.
Nutrition Statistics of Herbal Tea
- The nutritional information is derived from a standard serving size of one mug, which is generally about eight fluid ounces or roughly 100 grams.
- Herbal tea usually has negligible levels of saturated fat, amounting to 0.005g, which is 0% of the suggested daily intake.
- In a similar manner, it has very low amounts of monounsaturated fat (up to 0.012g) and polyunsaturated fat (up to 0.002g).
- The level of cholesterol in herbal tea is non-existent, recorded at 0mg, indicating 0% of the recommended intake.
- The potassium and sodium levels in herbal tea are also minimal, typically reaching 21mg and 2mg, respectively.
Herbal Tea Export Statistics
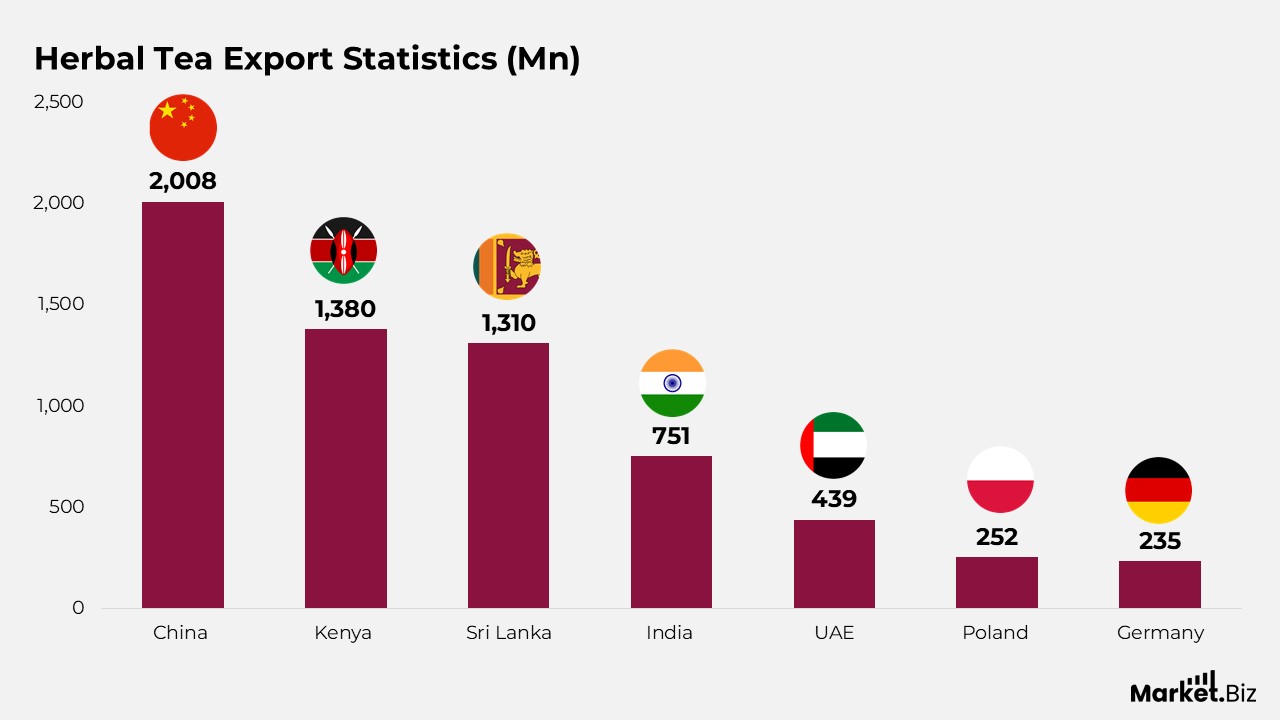
- China dominates the market with a significant export share of 25.41%, amounting to an impressive export value of USD 2008 million.
- In second place, Kenya secures a considerable market share of 16.89%, which corresponds to USD 1380 million.
- Sri Lanka also maintains a prominent position, representing 15.93% of global exports, which is equivalent to USD 1310 million.
- Additionally, India contributes a respectable 9.16% share, resulting in an export value of USD 751.06 million.
- The United Arab Emirates (UAE) distinguishes itself with a 5.36% export share, yielding USD 439.42 million in revenue.
- Other significant players in the market include Poland (3.08%, USD 252.69 million), Germany (2.87%, USD 235.36 million), Vietnam (2.72%, USD 223.09 million), Japan (2.06%, USD 169.19 million), and the UK (1.50%, USD 123.32 million).
Herbal Tea Import Statistics
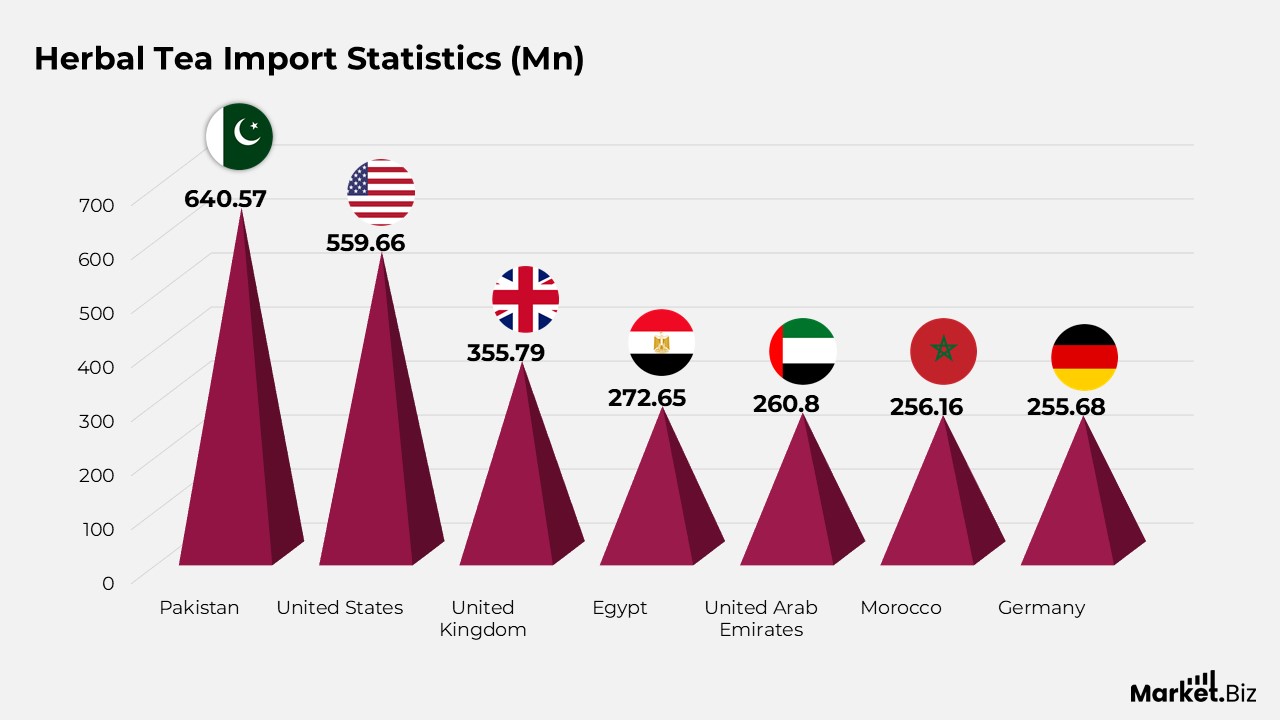
- Pakistan has established itself as a prominent importer, holding an import share of 11.38% and importing herbal tea worth USD 640.57 million.
- Following closely, the United States possesses a considerable share of the import market, accounting for 9.94% of imports, which translates to USD 559.66 million.
- The United Kingdom also plays a significant role, representing 6.32% of imports valued at USD 355.79 million.
- Egypt follows with an import share of 4.84%, amounting to USD 272.65 million in herbal tea imports.
- Morocco and the UAE each hold approximately 4.55% and 4.63% of the import shares, respectively, with import values of USD 256.16 million and USD 260.8 million.
- Germany closely follows, accounting for 4.54% of imports totaling USD 255.68 million.
- Other notable importers include Hong Kong (4.07%, USD 229.25 million), Kuwait (3.13%, USD 176.4 million), and France (3.03%, USD 170.59 million).
Imports of Green Tea
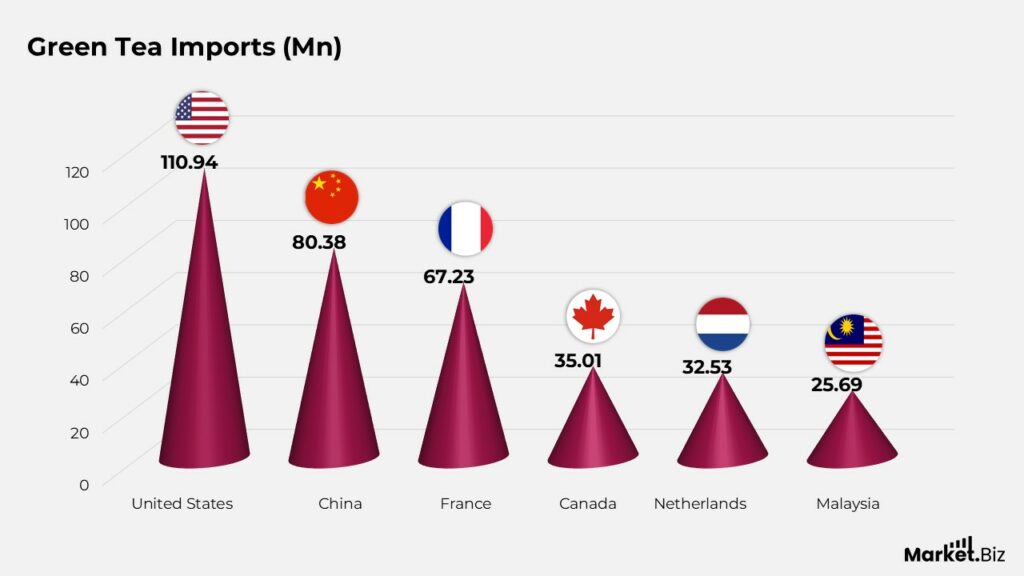
- At the top of the list was the United States, which imported green tea valued at USD 110.94 million. This was followed by China, including Hong Kong SAR, with total imports amounting to USD 80.38 million.
- France claimed the third spot, importing green tea worth USD 67.23 million, while the Netherlands and Canada closely trailed with import values of USD 32.53 million and USD 35.01 million, respectively.
- Germany, Malaysia, Spain, Italy, and Belgium made significant contributions to global green tea imports, with trade values ranging from USD 18.8 million to USD 25.69 million.
Green Tea Exports
- China leads the global market in green tea exports, with its exports in 2021 totaling 0.31 MMT, which accounts for nearly 85% of its overall exports.
- In terms of value, green tea exports represent about 60% of China’s total export revenue. The annual export price for China stands at $5.55/kg, black tea at $10.25/kgand with green tea averaging $4.44/kg.
- Morocco is China’s main export partner, attributed to its high per-capita tea consumption and a strong cultural tradition of green tea consumption, including Moroccan mint tea.
- Vietnam has emerged as a significant exporter of green tea, although its export volumes are much lower than those of China.
- In 2021, Vietnam exported 62,000 MT of green tea, which is nearly half of its total exports.
- Japan, known for its green tea production, exported over 6,000 MT, primarily consisting of green tea, with about one-third of this amount going to the US.
Green Tea Production
- The International Tea Committee (ITC) has reported an increase in the share of green tea production, rising from approximately 30% to 33%.
- In 2021, global green tea production was estimated at 2.1 million metric tons (MMT), with China at the forefront, producing over 1.8 MMT, which accounts for more than 85% of the worldwide output.
- Green tea makes up about 60% of China’s total annual production, exceeding that of black tea, which represents roughly 14% of the country’s yearly output.
- Japan, recognized as the second-largest producer of green tea, contributes approximately 0.8 million metric tons (MMT) each year.
- The primary varieties include Bancha and Sencha, with Sencha accounting for just over half and Bancha making up more than a third of Japan’s green tea production.
- Gyokuro and matcha (tencha) together represent less than 4% of the total volume but have a higher average value per kilogram compared to Sencha.
Herbal Tea Consumer Preferences Statistics
- A lifestyle survey carried out by the Tea Council of the USA in June 2015 found that 86% of Americans have a preference for green tea, while 59% choose black, white, and oolong teas.
- Moreover, the consumption of green tea has seen a significantly more rapid increase compared to black tea, with a volume growth of 60% over the past decade leading up to 2014, as reported by the council.
- Currently, green tea accounts for about 15% of the total tea consumption in the United States, with the rest made up of oolong, white, and dark teas.
- Additionally, a survey involving 600 participants in Tokyo examined their habits regarding green tea consumption. The findings indicated that 72.3% of Japanese individuals consume green tea on a daily basis, while 89.6% drink it more than once a week.
- Interestingly, there is a significant increase in the preference for green tea as individuals age. For example, only 48% of those in their twenties consume green tea daily, whereas this percentage rises to 94% among individuals aged over 50.
Herbal Tea Recent Statistics
- Herbal tea startups have garnered substantial investment, with total funding amounting to around $15 million over the last year.
- International sales of herbal tea products have experienced a 20% year-on-year growth, propelled by expansion into emerging markets in Asia and Europe.
- About 40% of herbal tea brands have transitioned to recyclable or biodegradable packaging, resulting in a 15% decrease in carbon footprint.
Conclusion
The global herbal tea market is witnessing considerable growth and diversification as consumers increasingly choose natural and healthy beverage options. Herbal tea’s recognised health benefits and diverse flavours contribute to its popularity.
Market trends indicate a growing demand driven by heightened health awareness, improved product availability, and expanded distribution networks. The versatility of herbal teas, which can be enjoyed either hot or cold and customised with various ingredients, further enhances their attractiveness.
Manufacturers and retailers are anticipated to capitalise on this opportunity by launching innovative blends and employing marketing strategies that align with changing consumer preferences and lifestyle trends. In summary, the herbal tea market presents promising opportunities for growth and expansion both domestically and internationally.
FAQs
Herbal tea, commonly referred to as herbal infusion or tisane, is prepared using dried herbs, fruits, flowers, or spices steeped in hot water.
Herbal preparations can lead to significant toxic effects, despite being marketed as natural products. In this instance, the consumption of mixed herbal tea resulted in multiorgan toxicity, which included hepatotoxicity, bone marrow toxicity, and prolonged nephrotoxicity.
Indeed, consuming herbal tea on a daily basis is generally acceptable and often advantageous for the majority of healthy adults, providing antioxidants, hydration, and digestive support. However, moderation (2-4 cups) and awareness of particular herbs are essential, as some (such as licorice or hibiscus) may interact with medications or health issues, and strong brews can irritate sensitive stomachs. Therefore, it is advisable to maintain variety and consult a healthcare professional.