
Introduction
Technology statistics provide a clear, data-driven view of how innovation is shaping industries, economies, and everyday life by converting complex technological developments into measurable insights such as adoption rates, usage patterns, investment trends, and performance benchmarks.
These statistics help businesses, policymakers, investors, and researchers track the pace of digital transformation, identify emerging technology priorities, understand shifts in user behavior, and assess competitive dynamics across regions and sectors, making them an essential foundation for informed decision-making and future-focused strategic planning.
Editor’s Choice
- Global IT spending is anticipated to exceed US$ 5.6 trillion in 2025, reflecting around 10% growth from 2024.
- IT services continue to attract the highest investment, with worldwide spending expected to exceed US$ 1.7 trillion in 2025.
- Businesses across North America and Europe are projected to dedicate roughly 19% of their IT budgets to software and an equal 19% share to hardware in 2025.
- About 64% of organisations expect their IT budgets to rise in 2025, a decline of 2% from 2024 expectations.
- Global internet usage reached nearly 5.56 billion users by February 2025, up approximately 2.4% year over year.
- Around 91% of companies participated in at least one digital initiative, such as automation or digital workflows, during 2024.
- Artificial Intelligence ranked as the most searched technology topic in 2024, with average global monthly searches surpassing 668,000.
- Generative AI recorded the fastest rise in search interest, with average monthly searches increasing by about 2,806% between 2022 and 2024.
- The US is expected to see more than 377,000 new computer and IT job openings each year from 2022 to 2032.
- In 2024, nearly 33% of US college students identified digital learning technologies as very important to education.
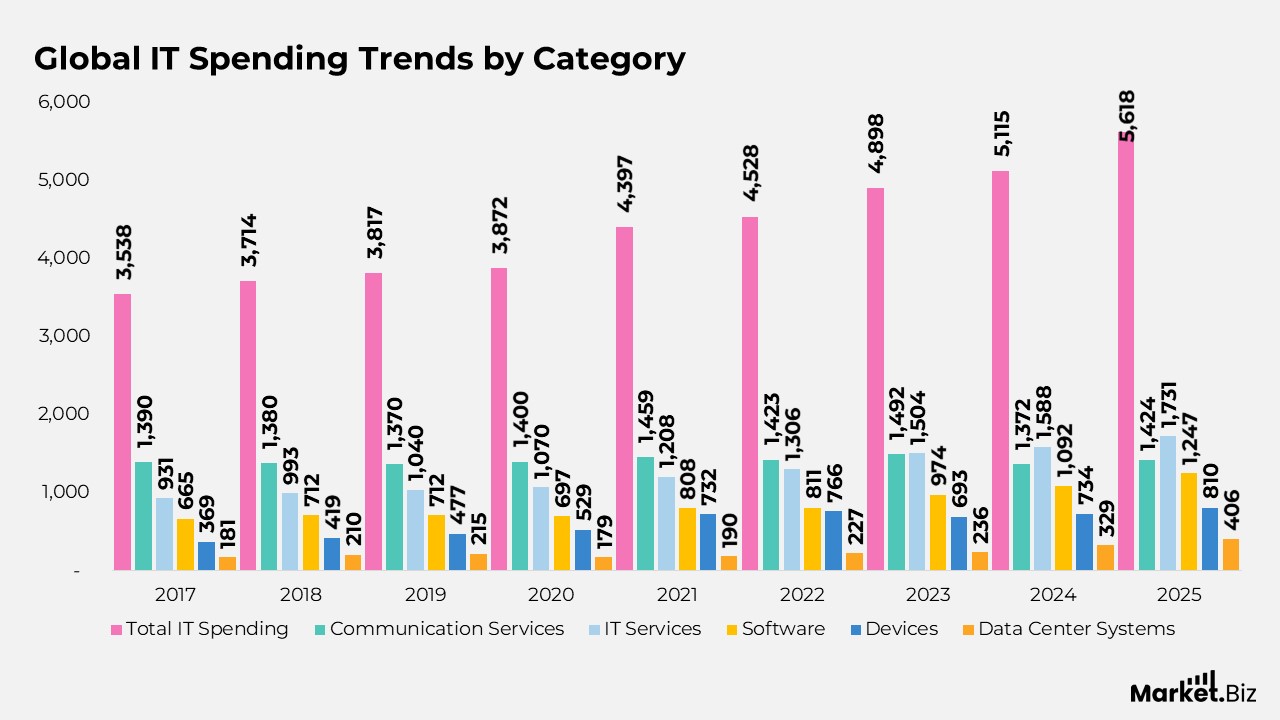
Global IT Spending Trends by Category
- In 2017, global IT spending totaled US$ 3,538 billion, with communication services leading at US$ 1,390 billion, followed by IT services at US$ 931 billion.
- Total worldwide IT expenditure increased to US$ 3,714 billion in 2018, supported by higher investments in software at US$ 712 billion and devices at US$ 419 billion.
- During 2019, overall IT spending reached US$ 3,817 billion, as IT services spending crossed US$ 1,040 billion while software spending remained stable at US$ 712 billion.
- In 2020, global IT outlays rose modestly to US$ 3,872 billion, with device spending climbing to US$ 529 billion despite a decline in data center system investments to US$ 179 billion.
- A strong rebound was observed in 2021, with total IT spending jumping to US$ 4,397 billion, driven by sharp growth in device spending at US$ 732 billion and IT services at US$ 1,208 billion.
- In 2022, worldwide IT expenditure expanded further to US$ 4,528 billion, supported by increased spending on IT services at US$ 1,306 billion and software at US$ 811 billion.
- Global IT spending reached US$ 4,898 billion in 2023, as software investments rose significantly to US$ 974 billion and IT services climbed to US$ 1,504 billion.
- In 2024, total IT spending grew to US$ 5,115 billion, marked by a notable surge in data center systems investment to US$ 329 billion and software spending exceeding US$ 1,092 billion.
- By 2025, global IT expenditure is projected to hit US$ 5,618 billion, with IT services expected to reach US$ 1,731 billion and software spending rising further to US$ 1,247 billion, highlighting continued digital and infrastructure-led expansion.
(Sources: AIPRM, Corp., Statista)
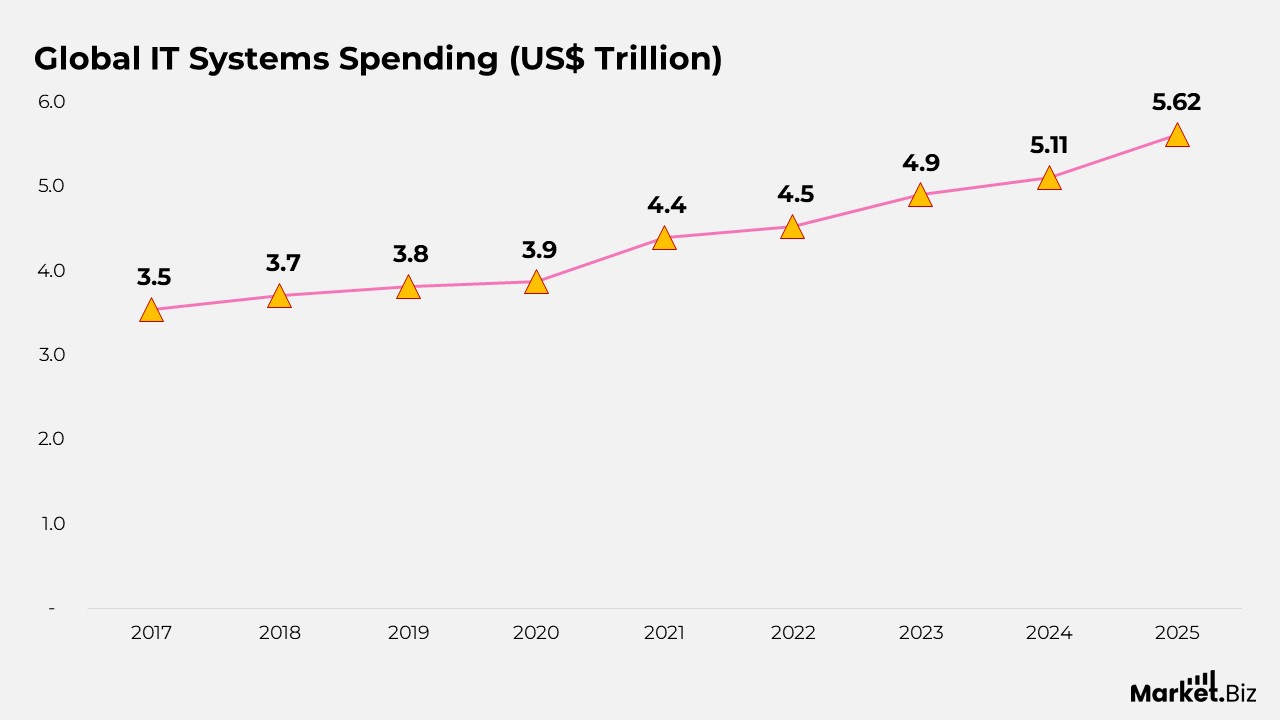
Growth in Global IT Systems Spending
- In 2017, worldwide spending on IT systems stood at approximately US$ 3.54 trillion, reflecting the baseline of sustained digital investment.
- Global IT expenditure increased to US$ 3.71 trillion in 2018, indicating steady year-on-year growth across major technology segments.
- By 2019, overall IT systems spending reached US$ 3.82 trillion, supported by continued enterprise adoption of digital tools.
- In 2020, global IT spending edged up to US$ 3.87 trillion, demonstrating resilience despite broader economic disruptions.
- A strong acceleration occurred in 2021, with total IT systems expenditure climbing to US$ 4.40 trillion.
- In 2022, worldwide IT spending expanded further to US$ 4.53 trillion, driven by increased focus on cloud and digital infrastructure.
- Global IT systems expenditure rose to US$ 4.90 trillion in 2023, reflecting higher investments in software and IT services.
- In 2024, total spending reached US$ 5.11 trillion, marking a significant milestone in global technology investment.
- By 2025, global IT systems spending is projected to reach US$ 5.62 trillion, highlighting sustained long-term growth in the technology landscape.
(Sources: AIPRM, Corp., Statista)
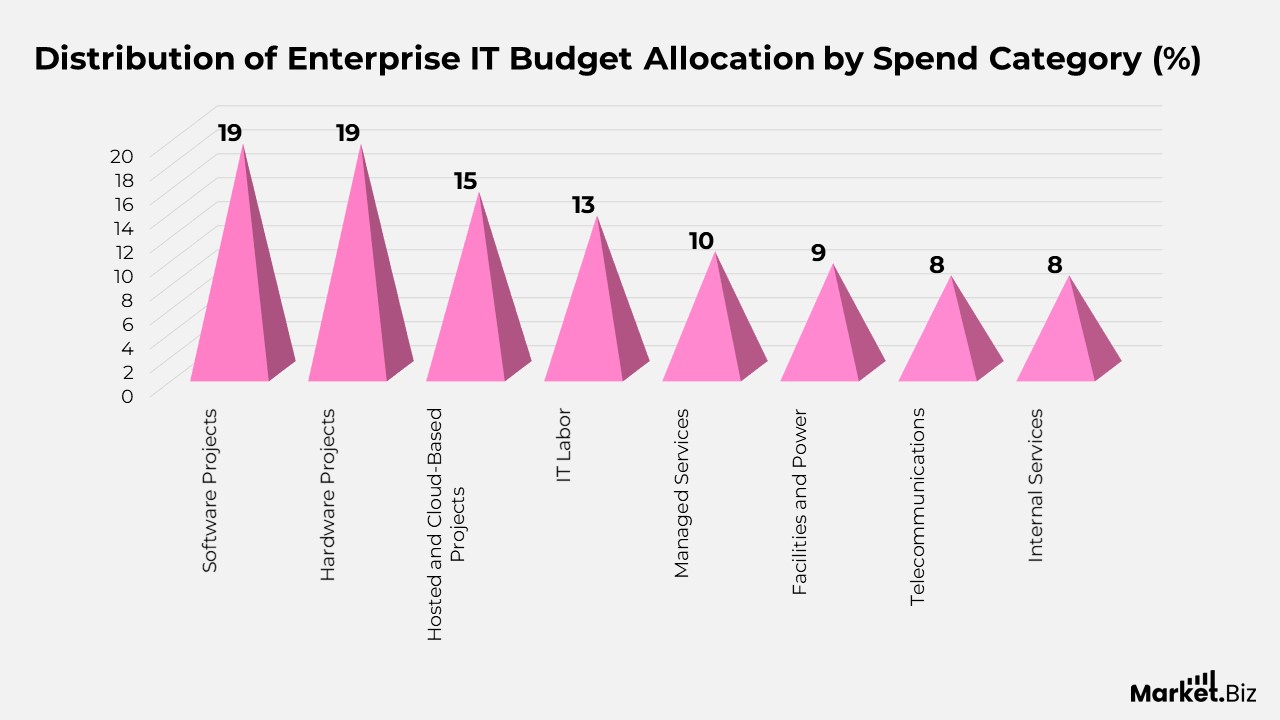
Distribution of Enterprise IT Budget Allocation by Spend Category
- Software projects account for the largest share of enterprise IT budgets at 19%, highlighting sustained focus on application development and digital platforms.
- Hardware projects also represent 19% of total IT spending, reflecting continued investments in physical infrastructure and equipment upgrades.
- Hosted and cloud-based projects account for 15% of IT expenditure, underscoring the growing reliance on cloud deployments and subscription-based models.
- IT labour represents 13% of overall IT budgets, driven by demand for skilled professionals in development, operations, and cybersecurity roles.
- Managed services contribute 10% of total IT spending, indicating increased outsourcing of IT operations and support functions.
- Facilities and power expenses account for 9% of IT budgets and are linked to data centre operations, energy usage, and infrastructure maintenance.
- Telecommunications spending represents 8% of total IT expenditure, supporting connectivity, networking, and communication requirements.
- Internal services also comprise 8% of IT budgets, reflecting in-house operational and administrative IT costs.
(Sources: AIPRM, Corp., Statista)
Enterprise Expectations for IT Budget Changes
- In 2020, about 44% of companies anticipated an increase in their IT budgets, while an equal 44% expected spending levels to remain unchanged, reflecting uncertainty during that period.
- During 2021, the share of firms expecting higher IT budgets declined to 33%, as 46% projected stable spending and 17% anticipated budget reductions.
- In 2022, confidence rebounded, with 53% of organizations expecting their IT budgets to grow, compared to 35% planning no change and only 7% expecting cuts.
- By 2023, expectations strengthened further: 54% of companies projected increased IT spending, 40% anticipated stable budgets, and 6% expected decreases.
- In 2024, optimism peaked: 66% of organisations expected IT budget growth, 30% planned to keep budgets steady, and only 4% anticipated reductions.
- For 2025, expectations remain positive: 64% of companies forecast higher IT budgets, 33% expect no change, and 4% project lower spending, indicating continued confidence in technology investment.
(Sources: AIPRM, Corp., Statista)
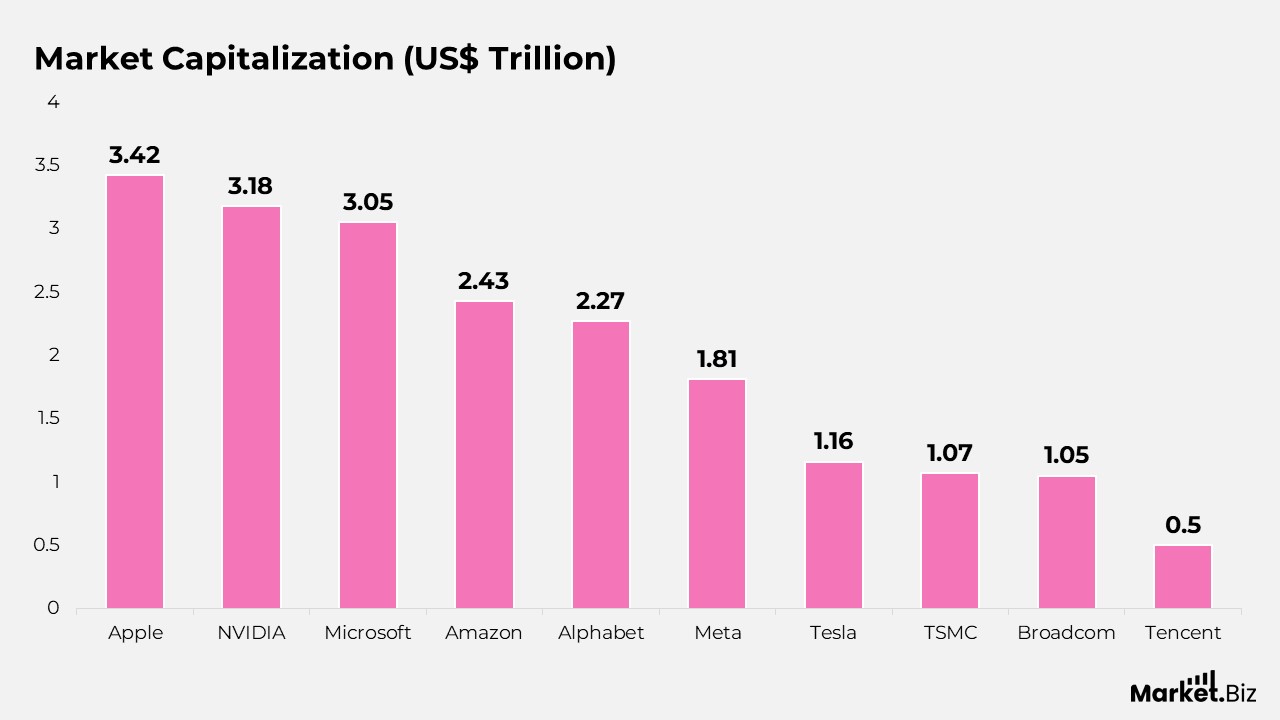
Market Capitalization of Leading Global Technology Companies
- Apple leads the group with a market capitalization of approximately US$ 3.42 trillion, reflecting its strong ecosystem of hardware, software, and services.
- NVIDIA follows closely at around US$ 3.18 trillion, driven by its dominance in AI chips, data centers, and high-performance computing.
- Microsoft holds a market value of nearly US$ 3.05 trillion, supported by enterprise software, cloud services, and AI integration.
- Amazon reports a market capitalization of about US$ 2.43 trillion, underpinned by its e-commerce scale and cloud infrastructure business.
- Alphabet stands at roughly US$ 2.27 trillion, reflecting the strength of its digital advertising, search, and AI-driven platforms.
- Meta records a market value close to US$ 1.81 trillion, supported by its global social media reach and investments in AI and immersive technologies.
- Tesla shows a market capitalization of around US$ 1.16 trillion, driven by electric vehicles, energy solutions, and autonomous technology development.
- TSMC holds a valuation of approximately US$ 1.07 trillion, highlighting its critical role in advanced chip manufacturing.
- Broadcom is valued at about US$ 1.05 trillion, supported by diversified semiconductor and enterprise software operations.
- Tencent reports a market capitalization of roughly US$ 499.36 billion, reflecting its presence in gaming, social platforms, and digital services.
(Sources: AIPRM, Corp., Statista)
Global Adoption Levels of Core Digital Technologies
- Internet usage has expanded to around 5.56 billion people worldwide, meaning approximately 67.9% of the global population now has online access.
- Mobile phones remain the most widely used technology, with about 5.78 billion users globally, representing nearly 70.5% of the world’s population.
- Social media platforms are used by roughly 5.24 billion people worldwide, accounting for close to 63.9% of the global population, underscoring their role in daily communication and content consumption.
(Sources: AIPRM, Corp., Statista)
Growth Trend of Global Internet Users
- In 2018, the global internet user base reached approximately 3.82 billion, recording year-on-year growth of about 7%.
- Worldwide internet usage increased to around 4.15 billion users in 2019, reflecting an annual growth rate of 8.6%.
- During 2020, the number of internet users climbed to nearly 4.52 billion, with growth accelerating to roughly 8.9% as digital connectivity became essential.
- In 2021, global internet adoption rose to about 4.87 billion users, a 7.7% increase from the previous year.
- By 2022, the worldwide online population expanded to approximately 5.09 billion, although the annual increase moderated to 4.5%.
- In 2023, the total number of internet users reached nearly 5.33 billion, with a growth rate of around 4.7%.
- In 2024, global internet adoption continued to rise to roughly 5.43 billion users, with year-on-year growth of 1.9%.
- By 2025, the global internet user base is estimated to reach about 5.56 billion, reflecting a modest rebound in annual growth to approximately 2.4%.
(Sources: AIPRM, Corp., Statista)
Fastest-Growing AI and Emerging Technology Search Trends
- Generative AI experienced explosive growth in online interest, with average monthly global searches rising from about 2,013 in 2022 to nearly 58,495 in 2024, a 2,806% increase.
- AI-powered cybersecurity saw steady momentum, with average monthly searches increasing from roughly 1,575 in 2022 to around 2,542 in 2024, a 61% increase.
- Interest in emotional AI expanded notably, with average monthly global searches climbing from approximately 10,057 in 2022 to about 15,629 in 2024, marking a 55% increase.
- Artificial Intelligence, as a broad topic, continued to gain traction, with average monthly searches rising from nearly 471,190 in 2022 to around 668,212 in 2024, reflecting a 42% growth rate.
- Environmental AI recorded moderate but consistent growth, with average monthly searches increasing from roughly 27,869 in 2022 to about 32,219 in 2024, a 16% rise.
(Sources: AIPRM, Corp., Statista)
Declining Search Interest in Selected Digital and Emerging Technologies
- Interest in the metaverse dropped sharply, with average monthly global searches falling from around 100,882 in 2022 to about 10,668 in 2024, representing a steep decline of roughly 89%.
- Searches related to non-fungible tokens (NFTs) decreased significantly, declining from approximately 25,083 monthly searches in 2022 to nearly 3,256 in 2024, a reduction of about 87%.
- Graph analytics saw a substantial drop in attention, as average monthly global searches fell from roughly 3,892 in 2022 to around 825 in 2024, marking a decline of close to 79%.
- Insurtech experienced a similar downturn, with average monthly searches decreasing from about 6,364 in 2022 to nearly 1,354 in 2024, also reflecting a 79% reduction.
- Distributed ledger technology (DLT) saw a notable decrease in search interest, with average monthly searches dropping from approximately 6,475 in 2022 to about 1,659 in 2024, a decline of around 74%.
(Sources: AIPRM, Corp., Statista)
Global Reach of Leading Free Mobile Apps Based on Download Rankings
- Instagram had the widest global presence, ranking in the top 100 most downloaded apps in 39 of 40 countries, with an average ranking of 14.03.
- WhatsApp Messenger ranked among the most consistently downloaded apps, ranking in 37 countries and averaging 10.24 across markets.
- Threads showed strong international traction, appearing in the top 100 lists of 37 countries with a relatively high average ranking of 8.65.
- ChatGPT matched Threads in geographic reach, ranking in 37 countries, while recording one of the strongest average positions at 8.57.
- Telegram Messenger maintained broad adoption, featuring in 36 countries, though with a lower average ranking of 19.28.
- Facebook also appeared in 36 countries, reflecting continued global usage, with an average position of 16.47.
- Zoom Workplace entered the top 100 in 34 countries, although its average ranking position was lower at 56.94, indicating more niche download momentum.
- Netflix featured among the top downloads in 32 countries, with an average ranking of 52.00, reflecting steady but selective user interest.
- Google Chrome ranked in the top 100 across 32 countries, with an average position of 29.97.
- X completed the list by appearing in 31 countries, with an average ranking position of 55.32, suggesting moderate global download visibility.
(Sources: AIPRM, Corp., Statista)
Technologies Most Likely to Be Adopted by Companies
- Digital platforms and applications lead adoption intent, with about 86.4% of companies expected to implement or expand their use during the 2023–2027 period.
- Education and workforce development technologies follow closely, with roughly 80.9% of organisations planning adoption to support upskilling and talent development.
- Big data analytics remains a top priority, with around 80.0% of companies likely to invest in data-driven decision-making tools.
- The Internet of Things and connected devices are projected to be adopted by approximately 76.8% of organisations, reflecting demand for real-time monitoring and automation.
- Cloud computing continues its strong momentum, with about 76.6% of companies expected to adopt or scale cloud-based infrastructure.
- Encryption and cybersecurity technologies are anticipated to be adopted by nearly 75.6% of companies, driven by rising security and compliance needs.
- E-commerce and digital trade solutions are likely to be implemented by around 75.3% of organizations as digital sales channels expand.
- Artificial intelligence adoption is expected among roughly 74.9% of companies, highlighting its growing role in automation and analytics.
- Environmental management technologies are projected to be adopted by about 64.5% of organizations, reflecting increased focus on sustainability initiatives.
- Climate change mitigation technologies are likely to be adopted by nearly 62.8% of companies over the same period.
- Text, image, and voice processing technologies are expected to be adopted by 61.8% of organisations, enabling smarter interfaces and automation.
- Augmented and virtual reality solutions are projected to attract adoption from approximately 59.1% of companies.
- Power storage and generation technologies are likely to be adopted by about 52.1% of organisations, driven by energy-efficiency goals.
- Electric and autonomous vehicle technologies are expected to be adopted by roughly 51.5% of companies.
- Non-humanoid robotics rounds out the list, with around 51.3% of organizations likely to adopt robotic automation solutions.
(Sources: AIPRM, Corp., Statista)
Projected Growth in Technology Employment by Sector
- Employment in PC, semiconductor, components, and technology manufacturing is estimated at around 1.1 million in 2023 and is projected to rise to nearly 1.2 million in 2024, reflecting an increase of about 20,948 jobs.
- Telecom, cloud, infrastructure, data processing, and hosting roles employed approximately 1.6 million people in 2023, with employment expected to remain at a similar level in 2024, supported by an addition of roughly 37,650 positions.
- IT and custom software services represent the largest employment segment, growing from about 3.0 million workers in 2023 to around 3.1 million in 2024, translating to a significant increase of nearly 116,547 jobs.
- Product software employment is projected to expand from approximately 648,374 roles in 2023 to about 685,517 in 2024, reflecting a net gain of around 37,143 positions, driven by continued demand for packaged and SaaS-based solutions.
(Sources: AIPRM, Corp., Statista)
Conclusion
Technology statistics collectively illustrate how deeply digital innovation is embedded in modern economies and daily life. Strong growth in global connectivity, sustained investment in IT systems, rising adoption of advanced technologies, and shifting patterns of user interest all point to an environment in which technology increasingly shapes productivity, competitiveness, and social interaction.
At the same time, variations in adoption rates, search trends, and employment growth highlight how technology landscapes continue to evolve as markets mature and priorities change. Overall, these statistics confirm that technology remains a central force driving economic development, business transformation, and long-term innovation worldwide.
FAQ’s
Technology statistics refer to structured quantitative measurements used to describe, analyse, and interpret the development, diffusion, and impact of technologies within societies and economies. They provide an empirical foundation for understanding how technological systems evolve.
The primary purpose of technology statistics is to create a standardized, objective view of technological progress and digital transformation. They help translate abstract innovation trends into measurable indicators that support comparison, evaluation, and long-term analysis.
Technology statistics are commonly categorized by domains such as infrastructure, applications, users, investment, and workforce. They may also be grouped by technology type, industry, region, or time period to support systematic analysis and interpretation.
Technology statistics measure factors such as technology adoption, usage intensity, investment levels, performance outcomes, and societal reach. Together, these metrics capture both the scale and the depth of technological integration across different contexts.
By providing consistent, comparable data, technology statistics enable researchers and analysts to identify patterns, test assumptions, and develop evidence-based insights into innovation, economic growth, and digital behaviour.