
Introduction
YouTube Ad Revenue Statistics: YouTube was established on April 14, 2005, by three employees of PayPal: Jawed Karim, Steve Chen, and Chad Hurley. They initiated the company in an office located above a small restaurant in San Mateo. Currently, the platform has nearly 2.49 billion active users each month and has experienced substantial growth over the years.
Approximately 47% of internet users globally engage with YouTube monthly. YouTube functions as both a social media platform and a search engine, facilitating direct interaction with its audience and enabling the creation of content that users can easily discover.
Editor’s Choice
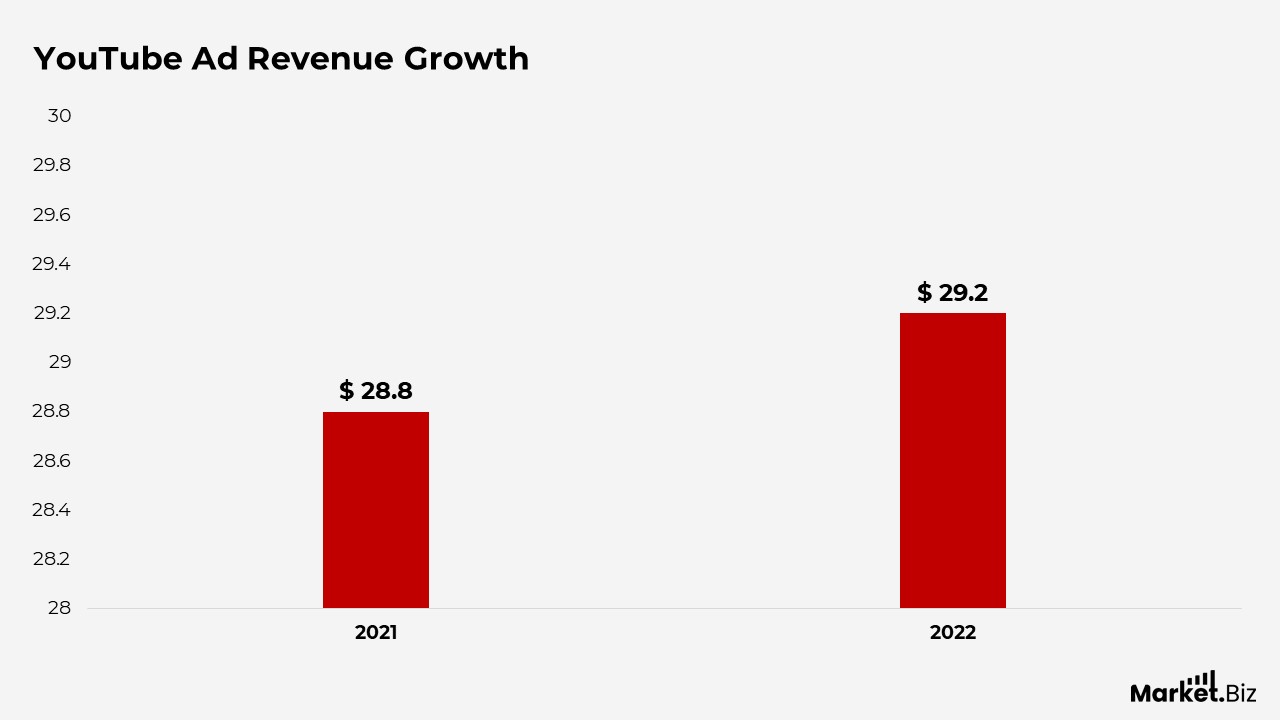
- In 2022, the global advertisement revenue for YouTube rose to $29 billion.
- According to YouTube statistics, the median cost per view on the platform ranges from $0.10 to $0.30.
- As of 2023, Tenlira is recognized as the largest advertiser on YouTube, having invested nearly 29.4 million dollars in advertisements on the platform.
- YouTube generates substantial revenue, approximately $15 billion annually.
- From 2021 to 2022, YouTube experienced an increase in advertisement revenue amounting to $398 million.
General YouTube Ad Revenue Statistics
- Alphabet’s global average revenue reached $282.8 billion, with YouTube contributing 10.3% of that total.
- From 2021 to 2022, YouTube experienced an increase in advertisement revenue amounting to $398 million.
- In 2022, the global advertisement revenue for YouTube rose to $29 billion.
- YouTube accounted for nearly 45% of the revenue generated from advertisements displayed on watch pages.
- Additionally, YouTube gathered approximately 55% of the revenue derived from advertisements in Shorts feeds.
- The advertising platforms of Google and YouTube operate on a bidding system.
- The chart above illustrates the in-app purchase revenue for June 2023.
- In the United States, revenue generated reached nearly $35.3 million, the highest among all countries.
- Conversely, Hong Kong reported the lowest revenue at $2.13 million for June 2023.
- South Korea and Ukraine generated $8.65 million and $5.16 million, respectively.
- Brazil and Taiwan reported revenues of $2.93 million and $2.76 million.
Moreover
- In Australia, the UK, and Canada, the lowest revenues recorded were $2.76 million, $2.45 million, and $2.21 million, respectively.
- According to YouTube statistics, the median cost per view on the platform ranges from $0.10 to $0.30.
- The median cost per click is reported to be between $0.30 and $0.50, based on the latest survey.
- Content creators with close to 1,000 subscribers are eligible to receive channel memberships from their audience.
- The monthly subscription cost varies depending on the region and the creator’s tier.
- YouTube has reduced its share of channel membership revenue by nearly 30%, with the remaining 70% allocated to the content creator.
- The specific revenue generated by YouTube from YouTube TV remains confidential.
- As of May 2023, the monthly subscription fee for YouTube TV was set at $64.99.
- In July 2022, Google announced that YouTube had surpassed 5 million accounts.
- A survey conducted by Takumi International revealed that 56% of customers in the UK and the US have noted an increase in their engagement with creator content on YouTube since 2020.
YouTube Marketing and Growth Statistics
- According to Semrush, YouTube is ranked as the second most-used website globally.
- As reported by DataReportal 2023, YouTube holds the position of the third most popular application among Android users worldwide.
- Tech Crunch 2023 highlights that YouTube Shorts have attracted more monthly logged-in viewers than both Instagram and TikTok reels.
- Since 2022, the number of viewers on YouTube has increased by nearly 500 million users.
- On average, a YouTube Short draws approximately 70 billion viewers each day.
- About 70% of YouTube users are inclined to make purchases after seeing a brand on the platform.
- Intent-targeted advertisements show nearly a 100% rise in the probability of purchasing desired products.
- The data presented above demonstrates that the levels of alignment with intent show a significant increase in engagement.
Moreover
- In terms of advertisement recall, around 19% is attributed solely to Demo, 28% to both Demo and intent, and 25% to intent alone.
- In the awareness category, nearly 3% is attributed solely to Demo, 9% is a combination of Demo and intent, and 8% is linked to intent only.
- For the consideration category, about 3% is solely Demo, 12% is a combination of Demo and intent, and 11% pertains to intent only.
- Regarding purchase intent, approximately 6% is for Demo, 13% is for both Demo and intent, and 12% is for intent alone.
- According to 29% of respondents, pre-roll skippable advertisements are considered more effective.
- As of 2023, Tenlira is recognized as the largest advertiser on YouTube, having invested nearly 29.4 million dollars in advertisements on the platform.
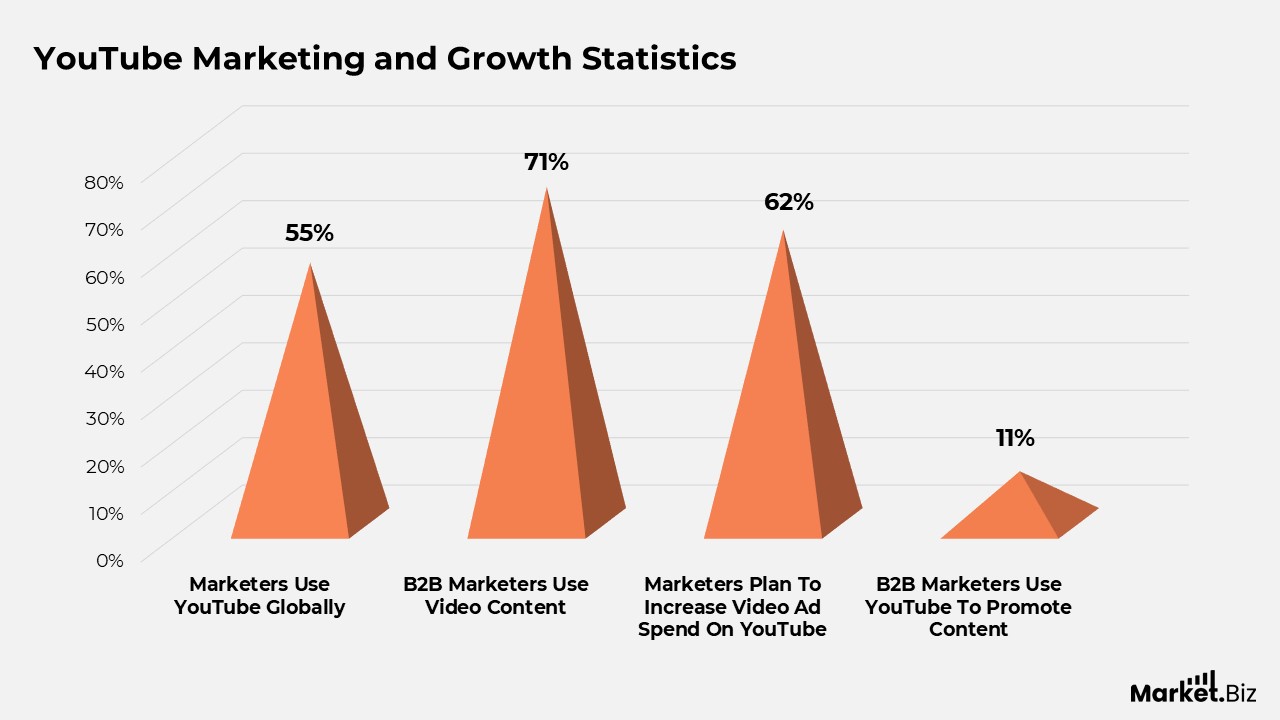
- Nearly 66% of marketers expect an increase in their use of YouTube videos. Additionally, about 59% plan to enhance their organic activities on YouTube.
- The percentage of marketers using YouTube for organic content marketing is projected to rise from 55% to 67% between 2022 and 2023.
- YouTube is acknowledged as the second most effective social media platform for content marketing, according to YouTube Statistics.
Influencers Statistics and YouTube Creator
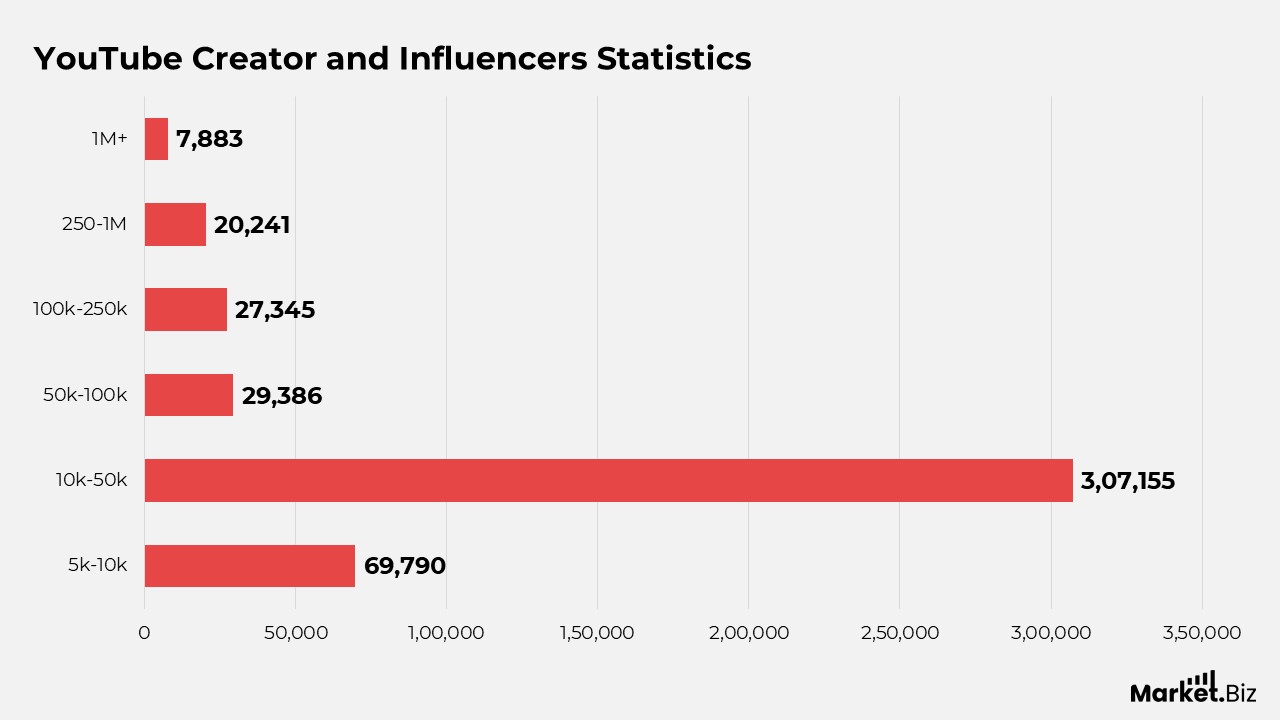
- YouTube is a widely recognized platform for video creation. With more than 31 million channels, it is evident that a significant number of individuals produce videos on YouTube.
- As reported by Matter 2023, the respondents identified YouTube as the most accessible and preferred platform for “valuable and genuine” influencer content.
- One notable channel, T-Series, boasts over 160 million subscribers, indicating a strong preference for their videos!
- Approximately 500 hours of new content are uploaded to YouTube every minute, resulting in a vast array of videos available for viewing. Therefore, to attract viewers to your videos, it is essential to ensure their quality!
- According to Influencer Marketing Hub 2024, YouTube channels with subscriber counts ranging from 100,000 to 1 million show the highest engagement rate of 3.47%.
- A majority of young individuals in America engage with YouTube, with around 90% of Americans aged 18–44 using the platform.
- The chart above illustrates the global influencer marketing market size from 2016 to 2023.
Further
- The graph indicates a consistent increase, with the market size growing from $1.7 billion in 2016 to $3 million in 2017.
- The growth rate was modest in 2018, reaching a market size of $4.6 billion, and it is projected to hit $6.5 billion in 2019.
- Overall, in 2020, the market size increased to $9.7 billion.
- The market was appraised at $13.8 billion, $16.4 billion, and $21.1 billion in 2021, 2022, and 2023, respectively.
- Individuals typically access YouTube via their mobile devices. Over 50% of YouTube users engage with the platform on their phones. So, videos need to be visually appealing on mobile screens.
- Creators producing content aimed at children and music videos tend to attract the highest viewership. This reflects the preferences of the audience!
- YouTube generates substantial revenue, approximately $15 billion annually.
- The majority of YouTube viewers fall within the age range of 18 to 49 years. YouTube surpasses all television channels in terms of viewership!
Moreover
- Each month, more than 2 billion individuals use YouTube. This represents a significant number of viewers consuming video content!
- The inaugural video to achieve one billion views was “Gangnam Style.” This illustrates the potential for YouTube videos to gain immense popularity on a global scale.
- As reported by Influencer Marketing Hub 2024, about 33% of the brands surveyed have used YouTube for their influencer marketing initiatives.
- The renowned YouTube channel T-Series has nearly 261 million subscribers, according to YouTube statistics.
- Recent statistics indicate that T-Series has amassed over 249 billion views across more than 20,000 videos.
- Mr. Beast holds the second position overall with 244 million subscribers, and his channel has gathered over 44 billion views from just 780 videos.
- CoCoMelon has close to 173 million subscribers, and the channel features nearly 1000 videos or more.
YouTube Business Statistics
- Currently, only 10% of small-scale businesses in the United States are active and using YouTube.
- YouTube boasts nearly 51 million channels, according to a survey conducted in 2023.
- In 2020, YouTube Content focused on ‘beginners,’ resulting in a 50% increase in daily views.
- Approximately 55% of digital professionals use YouTube.
- YouTube statistics indicate that 62% of businesses upload their advertising videos on the platform to boost their sales.
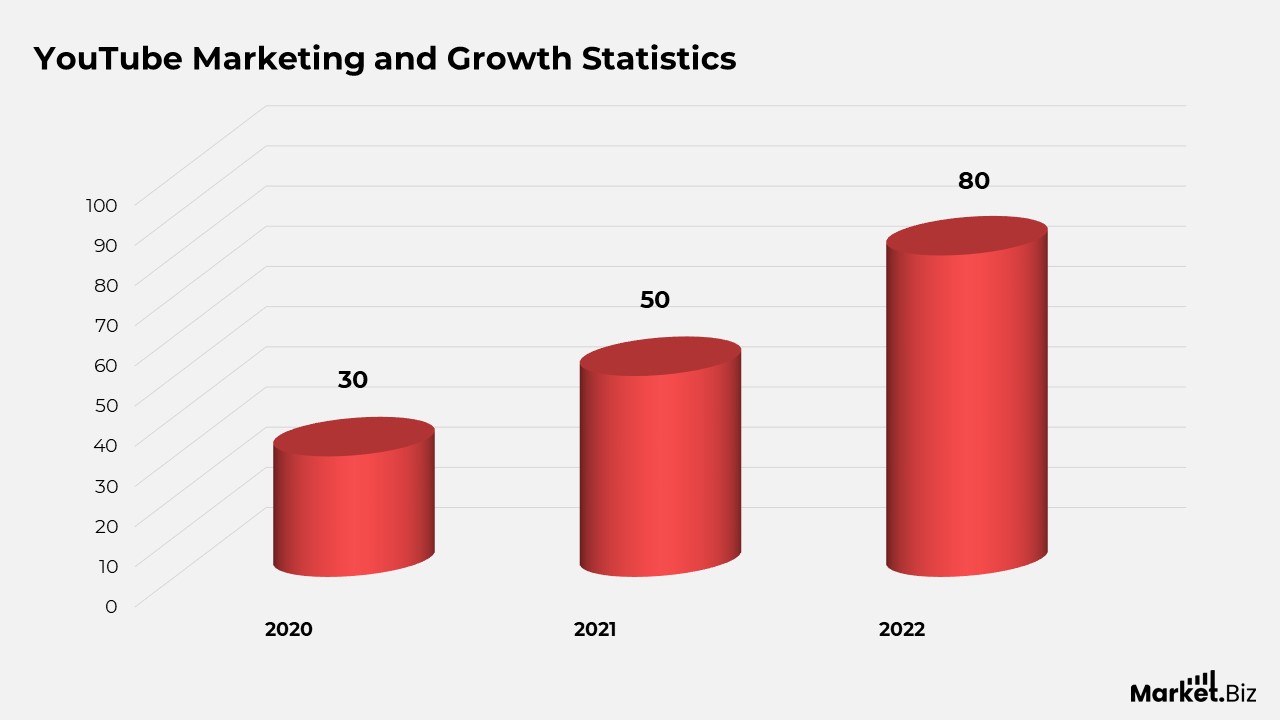
- The number of individuals subscribing to YouTube’s ad-free Premium and Music services has significantly increased in recent years.
- From October 2020 to November of the previous year, the number of subscribers increased by 167%, reaching 80 million.
- Nearly all marketers intend to either maintain their current advertising expenditure on YouTube or increase it, as more individuals are engaging with videos on YouTube compared to other online content.
- YouTube generated $29.24 billion in advertising revenue globally, marking a 1.5% rise from the prior year. However, at the beginning of 2023, there was a 2.6% decline in ad revenue compared to the same period last year, attributed to economic uncertainties.
Moreover
- Over 4.3 billion comments were removed from YouTube for violating guidelines, including nearly 2 billion comments taken down in the last quarter of 2022.
- The YouTube Partner Program allows select content creators to earn revenue from ads displayed on their videos.
- Currently, there are over 2 million participants in this program. They have the opportunity to earn between 30 cents and $29.30 for every 1,000 views they receive.
- The chart presented above illustrates the number of YouTube Music and YouTube Premium Subscribers for the years 2020, 2021, and 2022.
- Given that this timeframe coincided with the COVID-19 pandemic, we can note a subsequent rise in both the graph and revenue.
- In 2020, nearly 30 million individuals purchased paid subscriptions, followed by almost 50 million in 2021, and close to 80 million in 2022.
- Approximately 70% of YouTube viewers report that YouTube has increased their awareness of innovations and new brands.
- The video that has received the most dislikes on YouTube is “YouTube Rewind 2018– Everyone Control Rewinds.”
Statistics of YouTube Live
- YouTube serves as a vast platform for video viewing. Each month, over 2 billion individuals engage with YouTube, allowing them to view videos on a wide array of topics.
- A significant volume of videos is uploaded to YouTube. In a mere minute, more than 500 hours of fresh content are added.
- Some users prefer to view live broadcasts on YouTube. In April 2020, nearly 8 million viewers tuned in to a live video simultaneously. That is a substantial audience!
- In 2020, a considerable number of individuals watched live events on YouTube. Approximately 71% of viewers engaged with live content such as concerts or sports events on the platform.
- Daily, a vast number of videos are consumed on YouTube. In just one day, users collectively watch 1 billion hours of video content.
- A large portion of YouTube viewership happens on mobile devices. About 70% of the time spent watching YouTube is done on smartphones.
- PewDiePie is a prominent YouTuber known for his video content. In October 2020, his live video attracted 6 million simultaneous viewers, highlighting his popularity!
- The trend of watching live videos on YouTube is on the rise. In 2020, the duration of time spent on live video content increased by 30% compared to the previous year.
- The peak number of viewers for a live video on YouTube reached 2.3 million at one time.
YouTube Monetization Statistics
- According to The Social Shepherd, YouTube’s advertising revenue reached $36.1 billion in 2024, representing a 14.6% increase compared to the previous year.
- Descript has indicated that creators receive approximately $0.18 for each view, equating to $18 for every 1,000 views.
- The Social Shepherd also reports that there are now 125 million subscribers to YouTube Premium, which provides access to ad-free content and exclusive features.
- Furthermore, 87% of viewers have purchased a brand on YouTube. These statistics highlight the platform’s effectiveness in converting views into sales.
YouTube Finance Statistics
- YouTube offers an average payment of $3 to $5 for every 1,000 views on each video.
- The platform pays $18 for every 1,000 views on advertisements.
- YouTube has distributed over $2 billion to its partners through Content ID.
- YouTube contributes to 11% of Google’s advertising revenue.
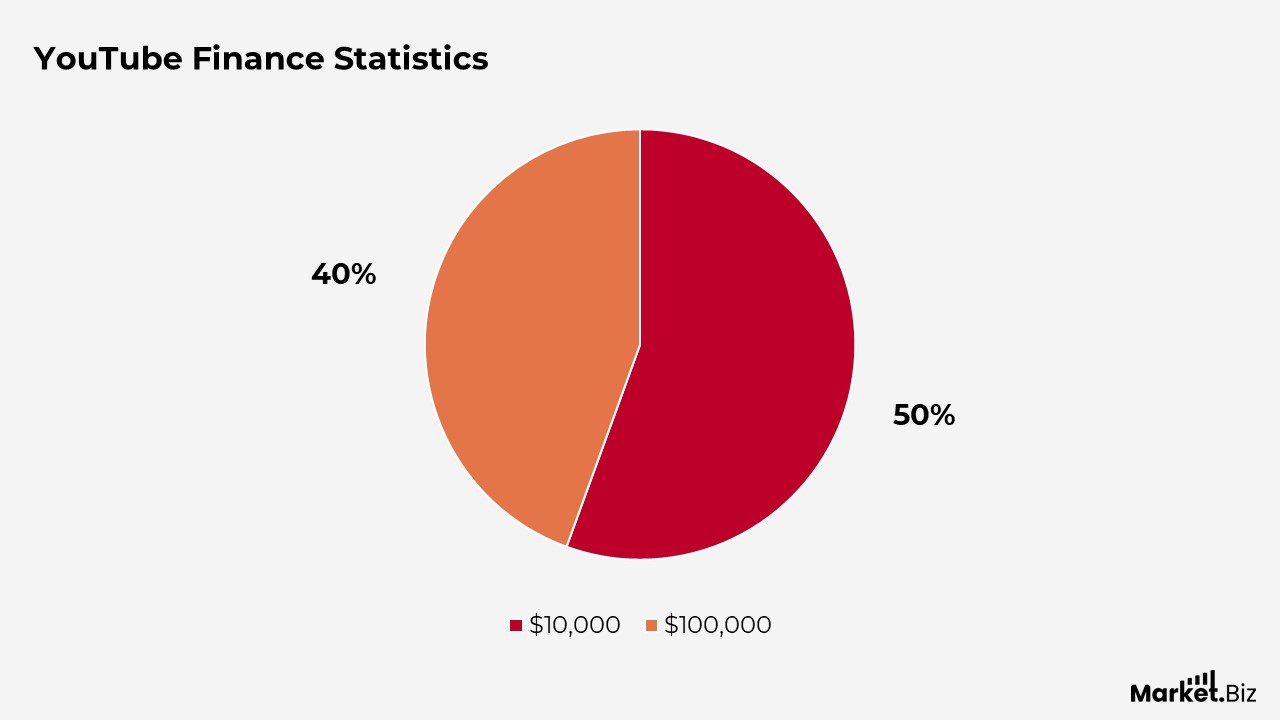
- Channels on YouTube that earn over $10,000 annually are projected to increase by more than 50% each year.
- YouTube channels with earnings exceeding $100,000 per year are anticipated to grow by over 40% annually.
- In 2023, YouTube’s global advertising revenue has surpassed $30.4 billion.
Conclusion
YouTube Ad Revenue Statistics: Despite the difficulties in profit growth over the past few years, YouTube generated nearly $9.2 billion in revenue in 2023. YouTube continues to be a dominant player in the online video industry and a valuable platform for both influencers and advertisers.
As an increasing number of individuals seek entertainment, baby sleep music, and information on YouTube, it is reasonable to assert that the platform will keep expanding.
In 2024, businesses and individuals must remain informed about the latest YouTube statistics and facts to improve their visibility and engagement on the platform.
FAQs
It also varies based on what you define as a full-time income. In 2025, a YouTuber may earn between $5 and $15 for every 1,000 ad views. The average view rate for YouTube ads ranges from 49% to 68%, influenced by factors such as the type of video ad or its creative elements.
Before exploring the various factors that affect a creator’s earnings from YouTube’s advertising program, allow me to provide an estimated range. Typically, YouTube compensates between $2,500 and $5,000 for one million views. However, in lucrative niches such as finance or technology, this amount can escalate to between $15,000 and $40,000.
10,000 views on YouTube can yield a diverse range of earnings, generally falling between ₹200 and ₹1,000 in India, although the actual earnings can vary significantly. Elements such as the content niche, the geographical location of the audience, and engagement rates play a crucial role in determining a creator’s income. For example, longer videos (over 8 minutes) that can include more advertisements may result in increased revenue.