
Introduction
E-waste Statistics: The rapid increase in electronic waste (e-waste) generation has made it one of the fastest-growing waste streams globally. With constant technological advancements, millions of tons of e-waste, such as old smartphones, computers, and household appliances, are discarded every year.
This rise in e-waste is fueled by the rapid obsolescence of electronic devices and the growing demand for newer models. E-waste poses serious environmental and health threats due to the presence of hazardous substances like lead, mercury, and cadmium. However, it also offers opportunities for recycling, resource recovery, and sustainable waste management.
Governments, industries, and consumers are increasingly aware of the need for effective strategies to tackle these challenges and harness the valuable materials within discarded electronics.
Editor’s Choice
- Plastics in e-waste can take up to 1 million years to decompose, whereas aluminium and other metals may take between 50 and 500 years. Certain e-waste components do not biodegrade but instead contribute to environmental pollution.
- According to a 2014 report by the Environmental Protection Agency, approximately 152 million mobile phones are discarded annually in the United States alone.
- A UN study reveals that producing a single computer and its screen requires at least 22kg of chemicals, 240kg of fossil fuels, and 1.5 tonnes of water, a total weight greater than that of a car.
- Around 42% of the world’s countries, or 81 nations, have implemented some form of e-waste management legislation.
- The UK has the 2nd maximum average e-waste per capita among all countries globally.
- In 2021, Asia led the world in e-waste production, generating 24.9 million metric tonnes.
- Europe holds the highest average e-waste per capita, with 16.2kg per person.
- Large household usages contribute approximately 167,000 tonnes of e-waste each year in the UK.
- The global recycling and collection rate for e-waste is expected to decline from 22.3% in 2022 to 20% by 2030.
- Europe boasts the highest e-waste recycling rate globally, reaching 42.8%.
General E-Waste Statistics
- In 2019, global e-waste generation reached nearly 53.6 million metric tons, with projections indicating it will exceed 74 million metric tons by 2030.
- The total value of global e-waste in 2019 was approximately US$57 billion, as reported by the International Solid Waste Foundation.
- Recycling just 1 million laptops can conserve enough energy to power 3,657 homes for an entire year.
- In the U.S., approximately 151 million cell phones are discarded annually.
- According to the EPA, recycling 1 million cell phones can recover significant quantities of materials, including 35,000 pounds of copper, 772 pounds of silver, 75 pounds of gold, and 33 pounds of palladium.
- The production of a single cell phone requires 48 pounds of chemicals and 1.5 tons of water, as stated by the Electronics TakeBack Coalition.
(Source: International Solid Waste Foundation, U.S. EPA, Electronics TakeBack Coalition, IDR Environmental Services)
Global E-Waste Crisis
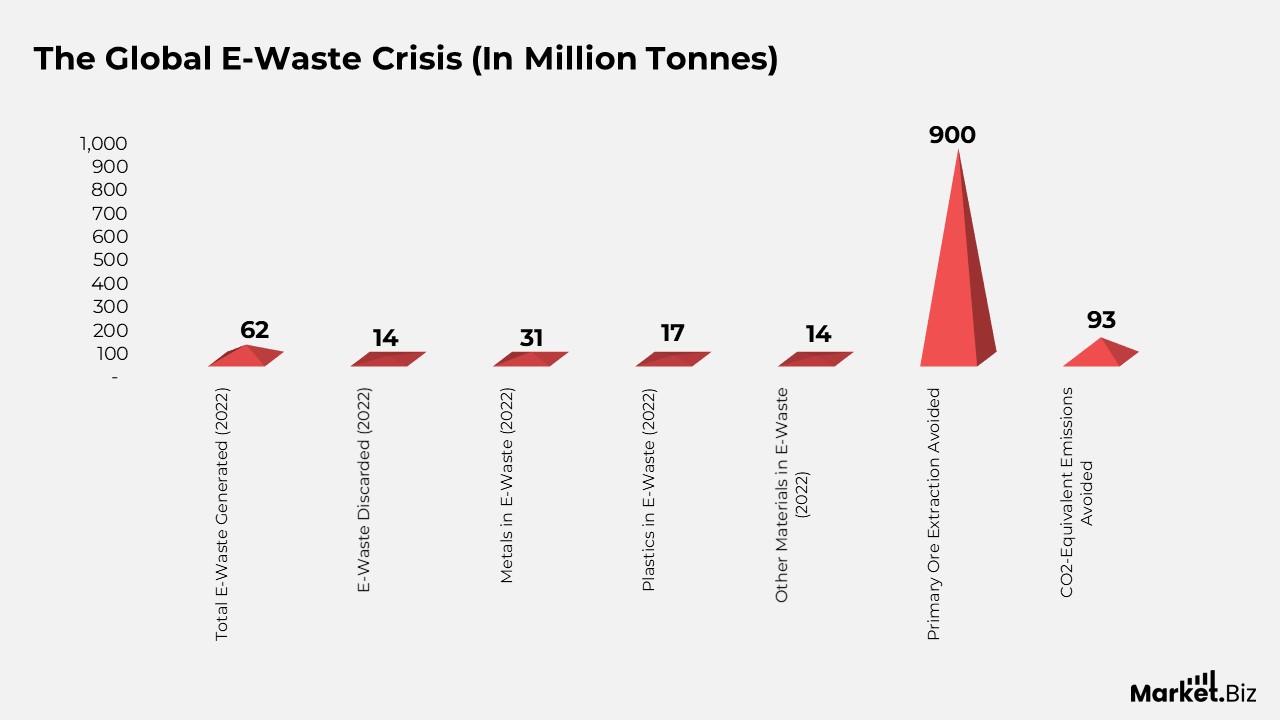
- 62 million tonnes of e-waste were generated in 2022, equivalent to the weight of 107,000 of the world’s largest and heaviest passenger aircraft. This amount could form an unbroken line stretching from New York to Athens, Hong Kong to Anchorage and Nairobi to Hanoi.
- 14 million tonnes (22.3%) of e-waste were discarded, mostly sent to landfills, in 2022.
- 31 million tonnes of metals, 17 million tonnes of plastics, and 14 million tonnes of other materials such as minerals, glass, and composites were embedded in e-waste in 2022.
- The value of metals in 2022 e-waste was US$91 billion, including US$19 billion in copper, US$15 billion in gold, and US$16 billion in iron.
- The value of secondary raw materials reclaimed through urban mining from e-waste in 2022 was US$28 billion.
- 900 million tonnes of primary ore removal were avoided through documented e-waste recycling.
- 93 million tonnes of CO2 corresponding emissions were avoided through formal e-waste management, including 41 million tonnes from recaptured refrigerants and 52 million tonnes from avoided metals mining.
(Source: United Nations Institute for Training and Research, Statista)
E-Waste Recycling Rates
- 42.8% of e-waste is formally collected and recycled in Europe.
- In African countries, less than 1% of e-waste is formally recycled.
- Around 50% (30 million tonnes) of global e-waste is produced by Asian countries, though only a small number of them have set clear e-waste collection targets or enacted relevant legislation.
- Europe generates an average of 17.6 kg of e-waste per capita, followed by 14.1 kg in the Americasand 16.1 kg in Oceania. These regions also have the highest per capita collection and recycling rates, with Oceania collecting 6.7 kg, Europe collecting 7.5 kg, and the Americas collecting 4.2 kg.
- 16 million tonnes of e-waste are collected and recycled outside formal systems in high- and upper-middle-income countries that have established e-waste management infrastructure.
- In low- and lower-middle-income countries, 18 million tonnes of e-waste are primarily handled by the informal sector, where no formal management systems exist. The benefits of material recovery are often offset by significant health and environmental costs.
- In 2022, 5.1 million tonnes (or 8.2% of the global total) of e-waste were shipped across restrictions, with approximately 3.3 million tonnes (65%) moved from high-income to middle- and low-income countries through uncontrolled and undocumented channels.
(Source: United Nations Institute for Training and Research, Statista)
E-Waste Management Systems Market Size
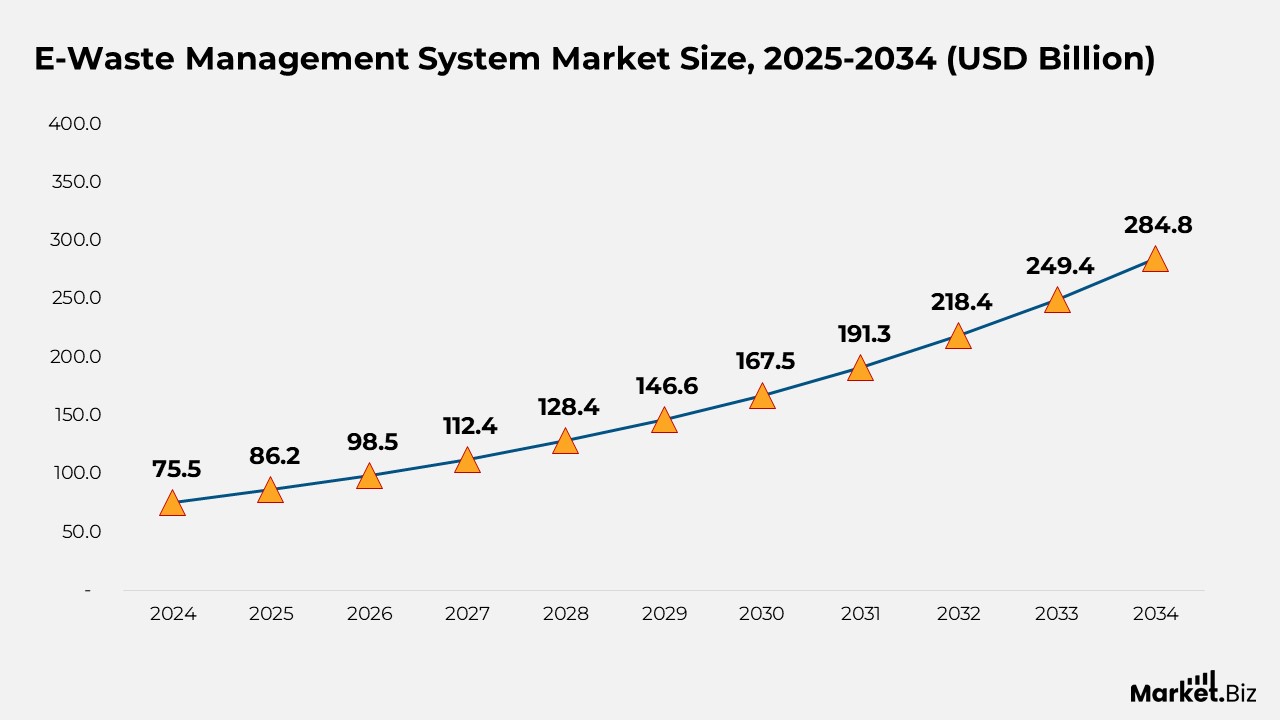
- According to Market.us, the global E-waste management systems market is expected to rise from $86.2 billion in 2025 to $284.8 billion by 2034, representing a compound annual growth rate (CAGR) of 14.2% from 2025 to 2034.
- The market growth is fueled by stricter regulations in developed countries and quick technological implementation in emerging markets, alongside rising consumer awareness about the environmental risks of improper disposal.
- In 2024, Consumer Electronics became the leading division in the E-Waste Management System market, holding over 49.9% of the complete market share.
- In 2024, Metal led the E-Waste Management System market, making up more than 65.8% of the total market share due to the high share of metals such as aluminium, copper, and gold in electrical waste.
- In 2024, disposal was the leading application in the E-Waste Management System market, taking more than 76.0% of the total market share, driven by the need for safe e-waste disposal.
- The E-Waste Management System market is significantly regionally diversified, with Asia Pacific holding the largest market share of 48.1% in 2024, valued at USD 36.3 billion.
- This dominant share in Asia Pacific is driven by rapid industrialization, high population density, and the increasing volume of electronic waste due to widespread adoption of digital technologies and consumer electronics.
(Source: Market.us)
E-Waste Recycling and Policy Developments
- The number of countries with e-waste policies grew from 61 in 2014 to 78 in 2019.
- By 2019, 71% of the global population was covered by a national e-waste policy, regulation, or legislation.
- In 2019, only 17.4% of global e-waste was officially documented as recycled, equating to 9.3 Mt. E-waste recycling increased at an annual rate of 0.4 Mt, with a 1.8 Mt rise in 2014. However, the global e-waste generation grew by 9.2 Mt annually, with a growth rate of 2 Mt, indicating that recycling is not keeping up with electronics production.
- Europe led the world in e-waste collection and recycling rates in 2019, reaching 42.5%, followed by the Americas at 9.4%, Asia at 11.7%, Oceania at 8.8%, and Africa at 0.9%.
- The recycling of e-waste components such as copper, iron, and aluminium resulted in a net savings of 15 Mt of Carbon Dioxide emissions in 2019, equivalent to the emissions from recycling secondary materials instead of using virgin materials.
(Source: United Nations Institute for Training and Research, Statista)
Global E-Waste Production
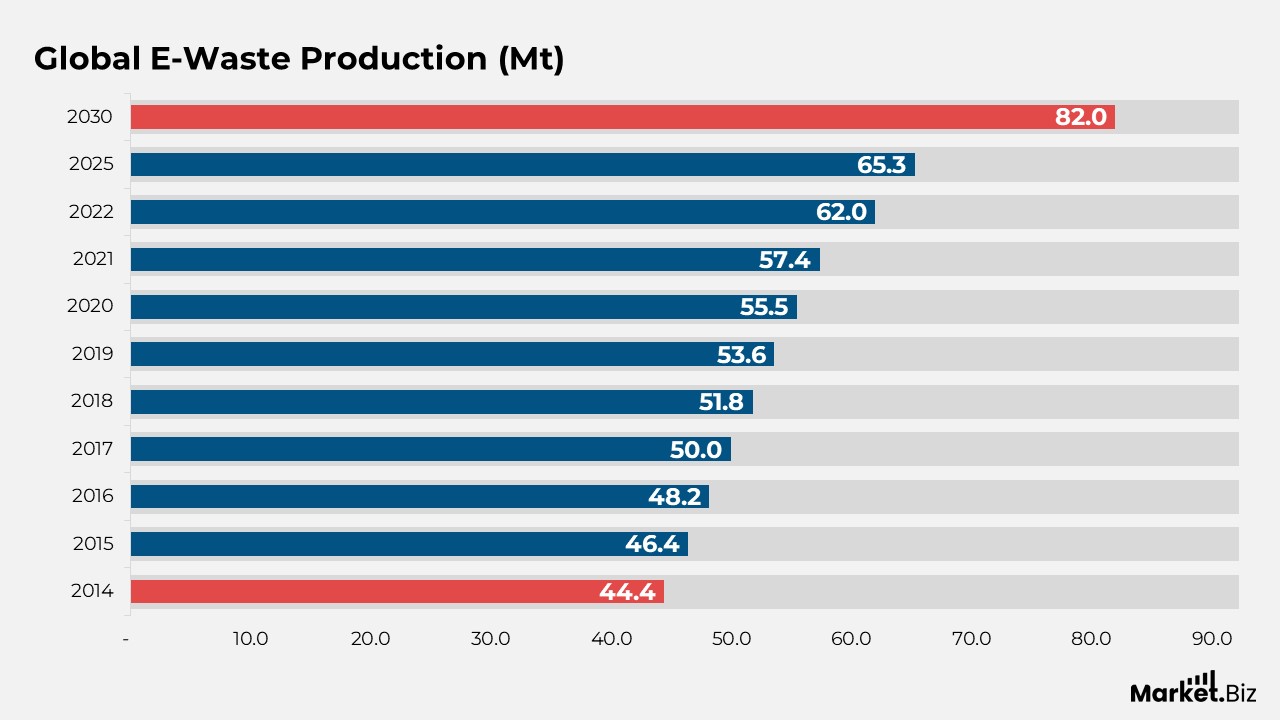
- In 2014, global e-waste production was recorded at 44.4 Mt.
- By 2015, this figure increased to 46.4 Mt.
- In 2016, e-waste production further grew to 48.2 Mt.
- The total e-waste generated in 2017 reached 50 Mt.
- 2018 saw a rise in e-waste production to 51.8 Mt.
- By 2019, global e-waste production had risen to 53.6 Mt.
- In 2020, the total e-waste produced climbed to 55.5 Mt.
- 2021 marked an increase in e-waste production to 57.4 Mt.
- In 2022, global e-waste production surged to 62 Mt.
- The expected e-waste production in 2025 is projected to be 65.3 Mt.
- By 2030, global e-waste production is anticipated to reach 82 Mt.
(Source: Desk Top Publishing Micro Systems Limited, UNITR, Statista, The Roundup.org)
E-Waste Generation by Equipment Type
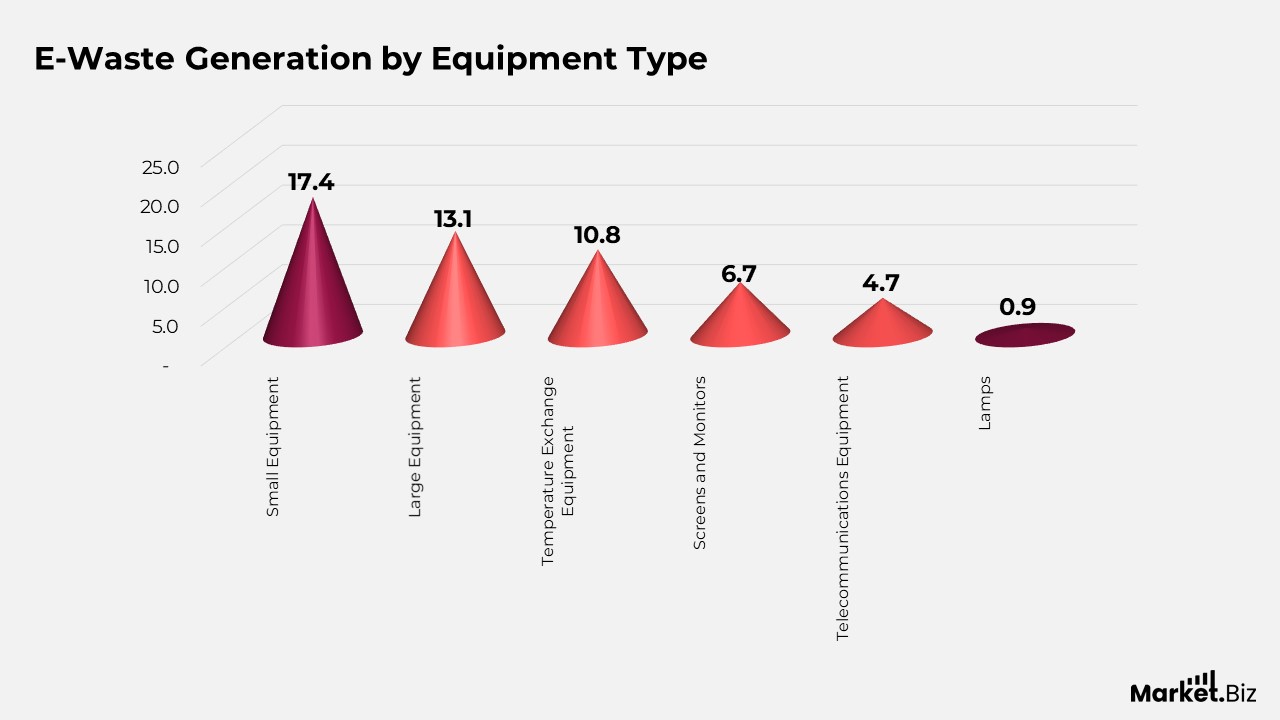
- Small equipment accounted for 17.4 Mt, representing 32.5% of global e-waste.
- Large equipment contributed 13.1 Mt, or 24.4% of the total e-waste.
- Temperature exchange equipment made up 10.8 Mt, which is 20.1% of global e-waste.
- Screens and monitors generated 6.7 Mt, representing 12.5% of the total e-waste.
- Telecommunications equipment produced 4.7 Mt, or 8.8% of the overall e-waste.
- Lamps contributed 0.9 Mt, comprising 1.7% of global e-waste.
(Source: Desk Top Publishing Micro Systems Limited, Global E-Waste Monitor)
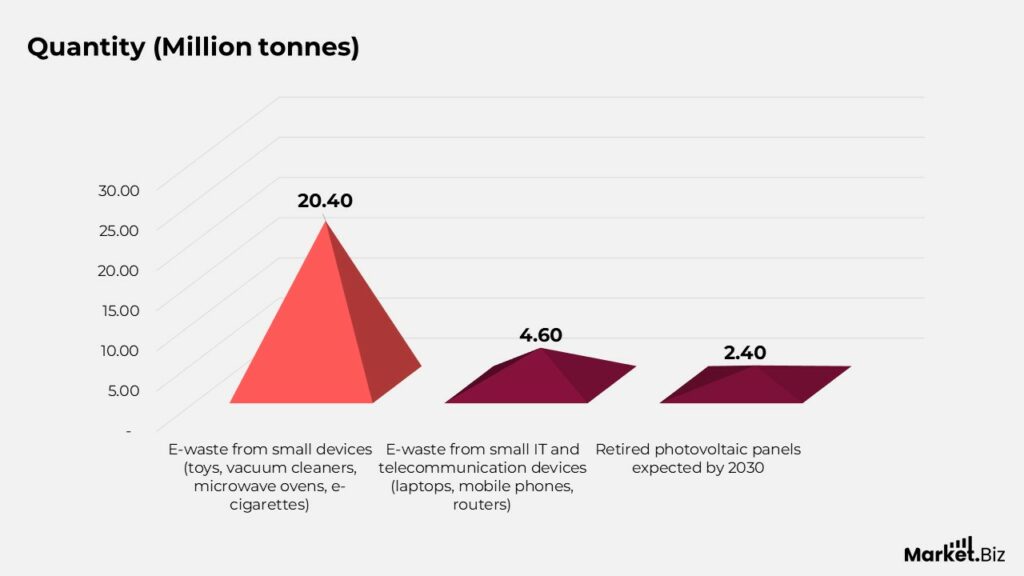
E-Waste Breakdown by Category
- 33% (20.4 million tonnes) of e-waste comes from small devices like toys, vacuum cleaners, microwave ovens, and e-cigarettes, with only 12% being recycled.
- 4.6 million tonnes of e-waste are generated by small IT and telecommunication devices such as laptops, mobile phones, and routers, with a 22% recycling rate.
- 2.4 million tonnes of retired photovoltaic panels are expected by 2030, a significant increase from the 600,000 tonnes in 2022.
(Source: United Nations For Training and Research)
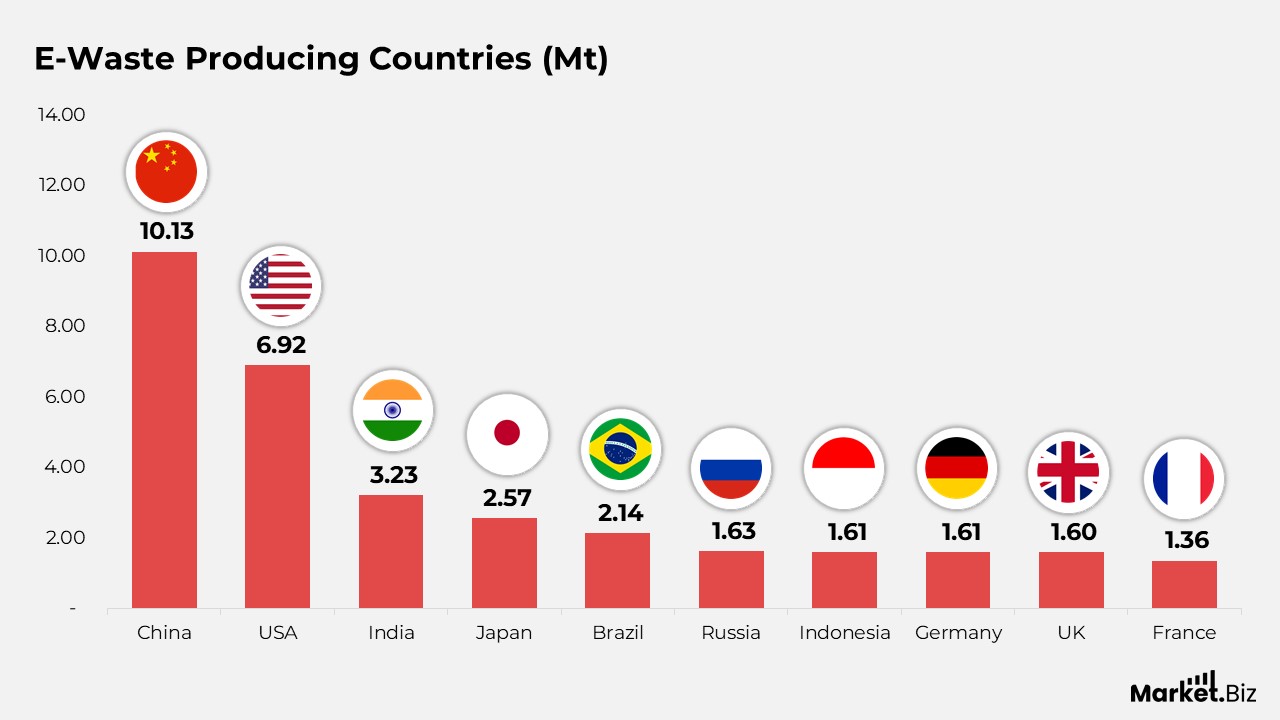
E-Waste Producing Countries
- China ranked first, producing 10.13 Mt of e-waste, with a recycling rate of 16%.
- The USA followed, generating 6.92 Mt of e-waste, with a recycling rate of 15%.
- India came third, producing 3.23 Mt of e-waste, but with a low recycling rate of 1%.
- Japan generated 2.57 Mt of e-waste and had a recycling rate of 22%.
- Brazil ranked fifth, producing 2.14 Mt of e-waste but reported no recycling efforts.
- Russia produced 1.63 Mt of e-waste, with a recycling rate of just 6%.
- Indonesia generated 1.61 Mt of e-waste, though its recycling rate was not available (n/a).
- Germany also produced 1.61 Mt of e-waste, boasting the highest recycling rate of 52%.
- The UK generated 1.6 Mt of e-waste, with a recycling rate of 57%.
- France ranked tenth, producing 1.36 Mt of e-waste, with a recycling rate of 56%.
(Source: Desk Top Publishing Micro Systems Limited, Global E-Waste Monitor)
Conclusion
The global e-waste market is experiencing robust growth, driven by rapid technological advancements, increased production of consumer electronics, and stricter regulations in developed regions. Growing awareness about the environmental and health hazards associated with improper e-waste disposal is further fueling demand for responsible recycling solutions.
Despite the challenges posed by hazardous materials in e-waste, there are significant opportunities for recycling and resource recovery. Asia Pacific stands out as a key region leading the market, emphasizing the need for effective e-waste management strategies to reduce risks and unlock the potential for sustainable growth.
As governments, industries, and consumers prioritize sustainable practices, the e-waste management market is set to evolve, paving the way for a more environmentally responsible approach to electronic waste disposal and recycling.
FAQ’s
E-waste refers to electronic devices that are no longer in use, including smartphones, computers, televisions, and household appliances, once they reach the end of their life cycle.
E-waste is becoming a major issue due to its rapid growth in volume, the hazardous substances it contains, such as lead, mercury, and cadmium, and the serious environmental and health risks associated with improper disposal.
The e-waste market is expanding due to rapid technological advancements, the growing production of consumer electronics, increasing demand for newer devices, and stricter regulations in developed countries.
Consumer electronics dominate the e-waste market, accounting for more than 49.9% of the total share, driven by the frequent obsolescence of devices like smartphones, laptops, and televisions.
Metals are the most prevalent materials in e-waste, making up over 65.8% of the total share, primarily due to the high concentrations of copper, aluminium, and gold in electronic devices.