
Introduction
Heat Pump Statistics: Globally, initiatives are underway to minimize our reliance on fossil fuels and advance towards net-zero emissions. Heat pumps have emerged as a crucial instrument in this endeavor, yet for many years, individuals have felt perplexed or uncertain about adopting this innovative technology. Due to financial considerations and concerns regarding accessibility, numerous homeowners have hesitated to transition.
Nevertheless, recent findings suggest a notable expansion in the market, with the most recent data indicating that worldwide heat pump sales rose by 11% in 2022. In this article, we will explore the global heat pump statistics projected for 2025-2026, delving into the factors contributing to this growth, regional patterns, costs, and savings, as well as the implications for the future of heating and cooling our residences across the globe.
Editor’s Choice
- Currently, heat pumps account for approximately 10% of global heating requirements. It is estimated that 1 in 10 households utilizes heat pumps.
- The global heat pump market was estimated at USD 66.5 billion in 2022 and is anticipated to experience steady growth in the upcoming years, with a compound annual growth rate (CAGR) of 8.80%.
- 94% of the air source heat pumps installed are air-based, while only 6% utilize energy sourced from the ground or water.
- Between 2019 and 2023, the sales of heat pumps across various regions displayed distinct trends.
- Between 2001 and 2022, the total shipments of air-source heat pumps in the United States exhibited a consistent upward trajectory.
- A water source heat pump boasts a Coefficient of Performance (CoP) of approximately 6 (refer to the ground source heat pumps section for additional details). In contrast, a gas boiler has a CoP of roughly 0.93.
- A ground source heat pump has the potential to reduce a household’s heating expenses by as much as £2500.
- Currently, Europe has approximately 20 million installed heat pump units.
- The United Kingdom presently has only 412 heat pumps for every 100,000 individuals.
General Heat Pump Statistics
- Currently, heat pumps account for approximately 10% of global heating requirements. It is estimated that 1 in 10 households utilizes heat pumps.
- Modern heat pump models are now 3 to 5 times more efficient compared to gas boilers.
- Gas boilers produce around 2,500 kg of CO2 annually, while heat pumps can limit their emissions to approximately 850 kg.
- In 2022, global sales of heat pumps rose by 11%, with further growth anticipated in the upcoming years.
- In February 2024, over 4,000 heat pumps were installed in the UK as part of the Government’s Boiler Upgrade Scheme (via MCS), marking a 26% increase compared to the average in 2023.
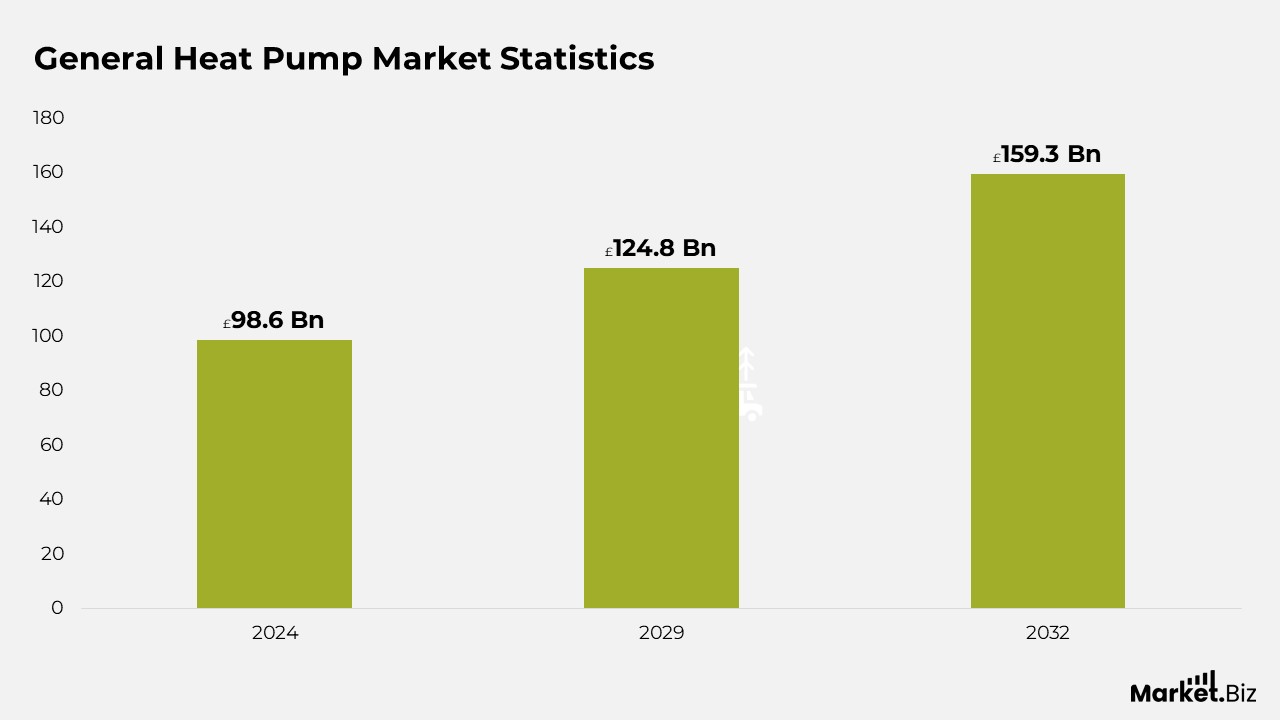
- The global market for heat pumps is projected to be valued at around £98.6 billion in 2024, with forecasts for future growth ranging from approximately £124.8 billion by 2029 to £159.3 billion by 2032. The estimated compound annual growth rate (CAGR) is between 8.2% and 11.1%.
- If these growth trends persist, the IEA indicates that heat pumps could be heating nearly double the number of buildings by 2030.
Moreover
- Sales in Europe increased in 2022, with nearly 3 million heat pumps sold. However, in 2023, the EHPA (European Heat Pump Association) reported a 5% decline in sales across 14 European nations, decreasing from 2.77 million to 2.64 million.
- The EHPA anticipates that the total stock of heat pumps in Europe will reach 23 million, including 27 EU countries, the UK, Norway, and Switzerland.
- The IEA estimates that heat pumps could help reduce global CO2 emissions by at least 500 million tonnes by 2030, which is equivalent to the annual emissions produced by all cars in Europe.
- In 2023, heat pump sales surpassed those of gas furnaces in the United States. While China continues to dominate the heat pump market with stable sales figures, even amidst a slowing economy.
- Despite the growth in the heat pump industry, reports indicate that global commitments to achieve net-zero targets remain highly ambitious, necessitating further governmental policy initiatives and international collaboration.
- Additionally, approximately 600 million more heat pumps will be needed by 2030 to meet just 20% of building heating demands.
Heat Pump Market Statistics
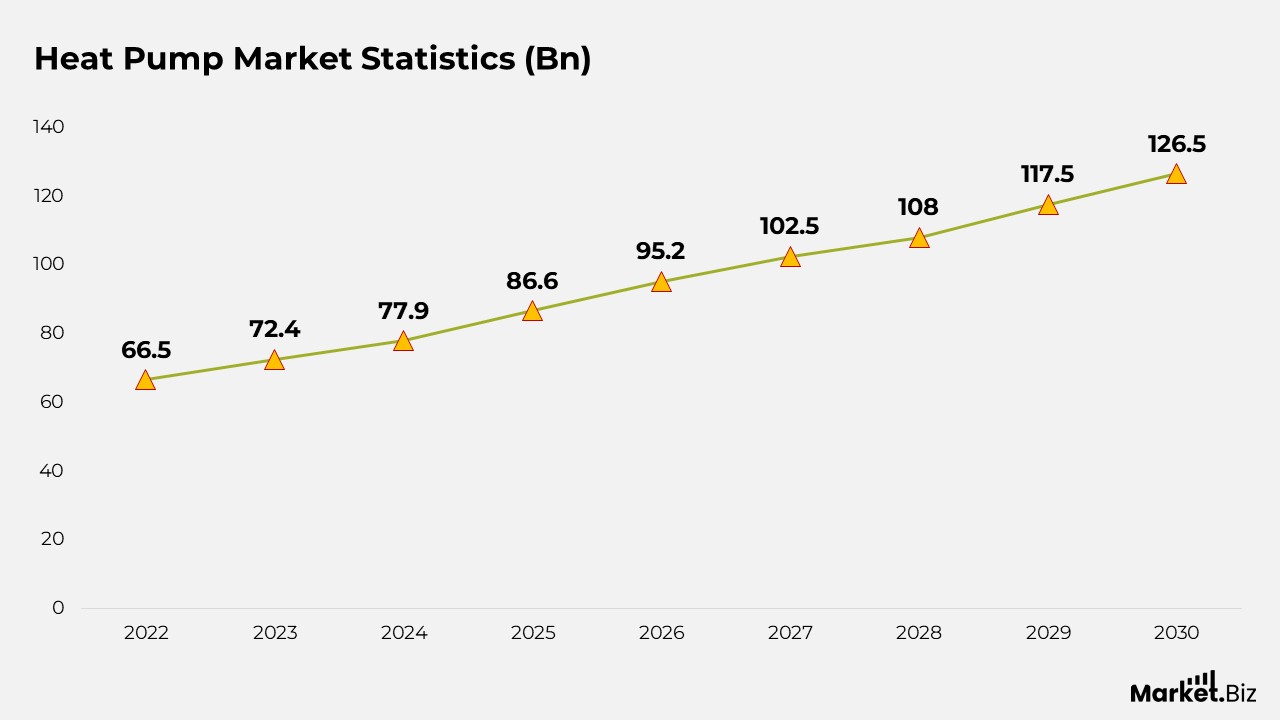
- The global heat pump market was estimated at USD 66.5 billion in 2022 and is anticipated to experience steady growth in the upcoming years, with a compound annual growth rate (CAGR) of 8.80%.
- In 2023, the market is projected to reach USD 72.4 billion, followed by an increase to USD 77.9 billion in 2024.
- By 2025, the market revenue is projected to further increase to USD 86.6 billion, culminating in USD 95.2 billion by 2026.
- The upward trajectory persists, with forecasts indicating that the market will reach USD 102.5 billion in 2027, USD 108.0 billion in 2028, and USD 117.5 billion in 2029.
- By 2030, the global heat pump market is predicted to generate USD 126.5 billion, and by 2031, it is expected to rise to USD 137.6 billion.
- Ultimately, by 2032, the market is projected to attain USD 151.3 billion, demonstrating consistent and strong growth throughout the forecast period.
Heat Pump Adoption Rates
- Sales of heat pumps in the European Union experienced a growth of approximately 35% from 2020 to 2021, resulting in over 2.2 million units becoming operational. The primary markets for heat pumps within the EU are France, Italy, and Germany.
- 94% of the air source heat pumps installed are air-based, while only 6% utilize energy sourced from the ground or water.
- As of April 2023, Europe has an average of 3,068 heat pumps for every 100,000 individuals.
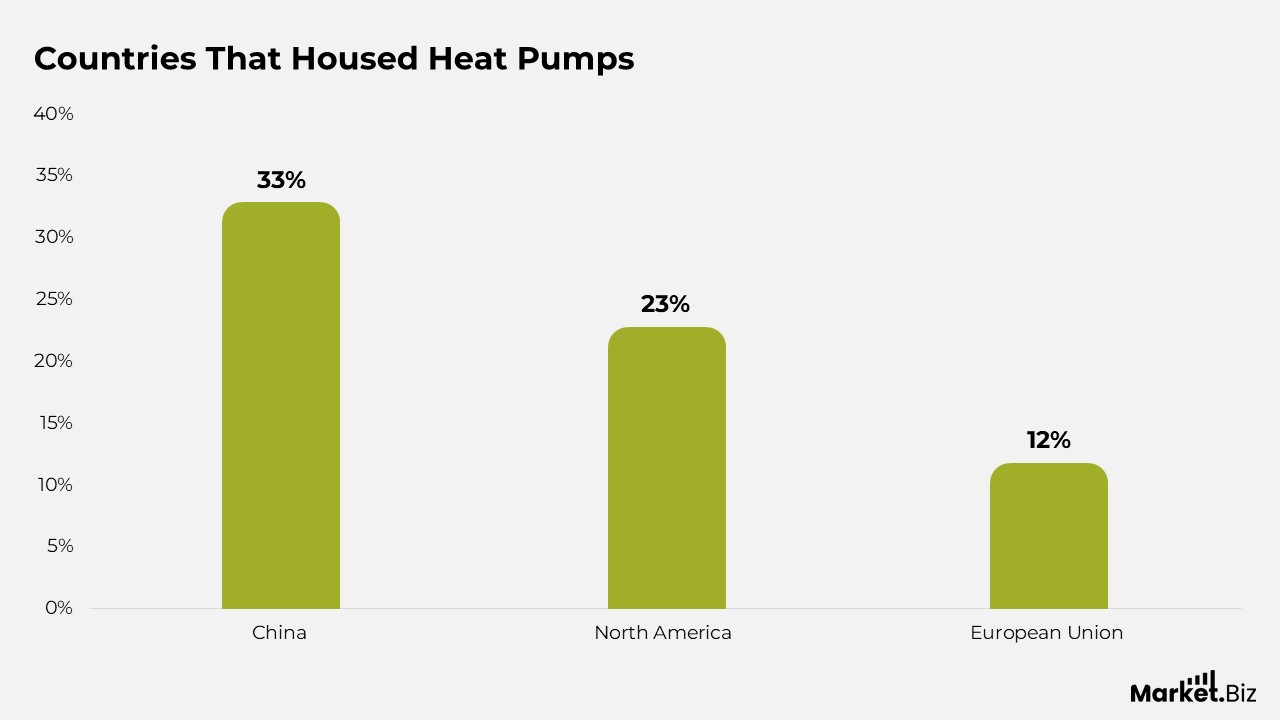
- In 2020, China housed 33% of the operational heat pumps, North America accounted for 23%, and the European Union represented 12%.
- In Finland, sales of air-to-air heat pumps surged by 120% in 2022.
- The overall quantity of heat pumps in Finland rose by 90% during the same year.
- Heat pumps typically have a lifespan that is approximately double that of a boiler.
- To meet Net Zero targets by 2050, it is essential to significantly increase investments in heat pump technology, reaching $160 billion annually by 2030.
- Manufacturers are set to invest around $4 billion to enhance heat pump production capacity, with the majority of this investment focused in Europe.
- The number of heat pump installations projected between 2021 and 2025 is expected to be roughly equivalent to the total number of heat pumps installed over the previous decade.
- From 2020 to 2021, heat pump sales in Poland saw a rise of 66%.
- During the same timeframe, Italy’s heat pump sales increased by 63%, while France experienced a growth of 36%.
Statistics of Heat Pumps and Global Warming
- Buildings account for over 40% of our energy consumption and contribute to more than a third (28%) of global emissions.
- The threats posed by global warming and climate change are significant; therefore, it is crucial to reduce energy consumption and emissions to keep the increase in global average temperatures to within 1.5°C.
- Conventional air conditioning systems contribute nearly 4% to global greenhouse gas emissions.
- More than one-sixth of the global demand for natural gas is attributed to heating buildings, which accounts for one-third of the total natural gas demand within the EU.
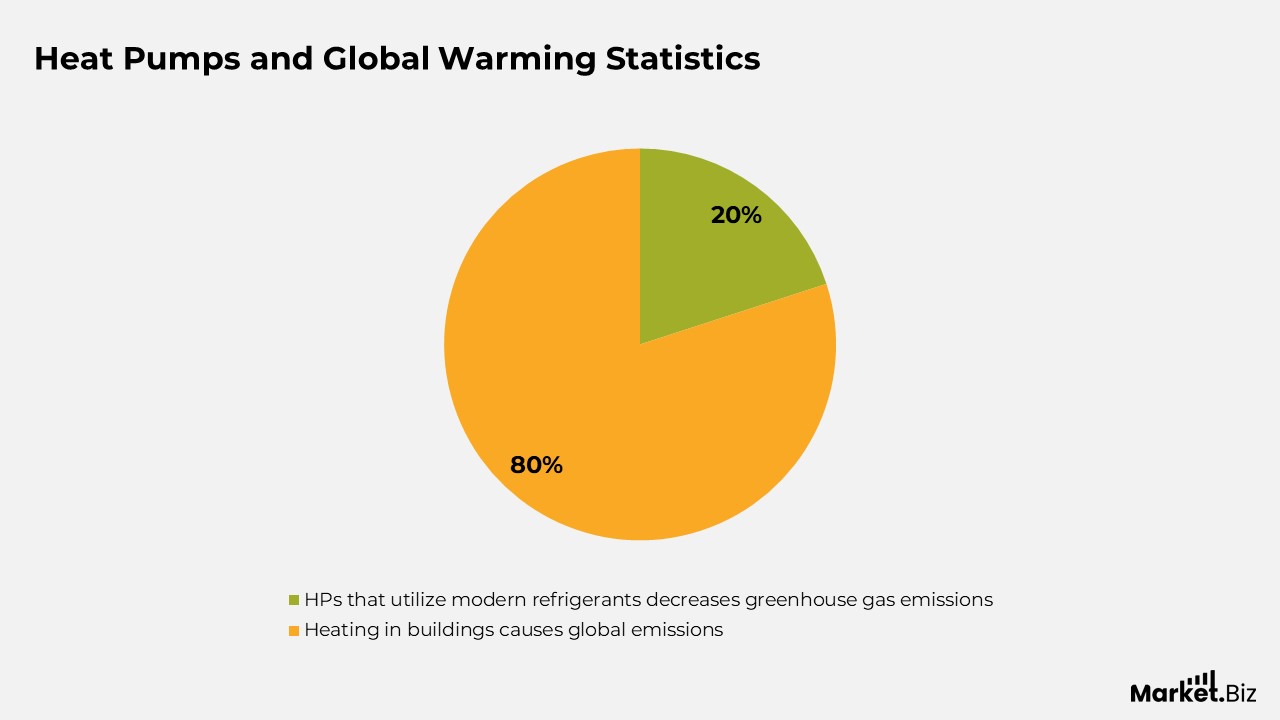
- Heating in buildings is responsible for 10% of global emissions.
- An average heat pump provides between 70% and 80% of its energy from renewable sources.
- Heat pumps that utilize modern refrigerants can decrease greenhouse gas emissions by 20% when compared to traditional gas boilers.
- In nations that rely on electricity from ‘clean’ sources, this reduction can reach as high as 80%.
Heat Pumps Sales Statistics
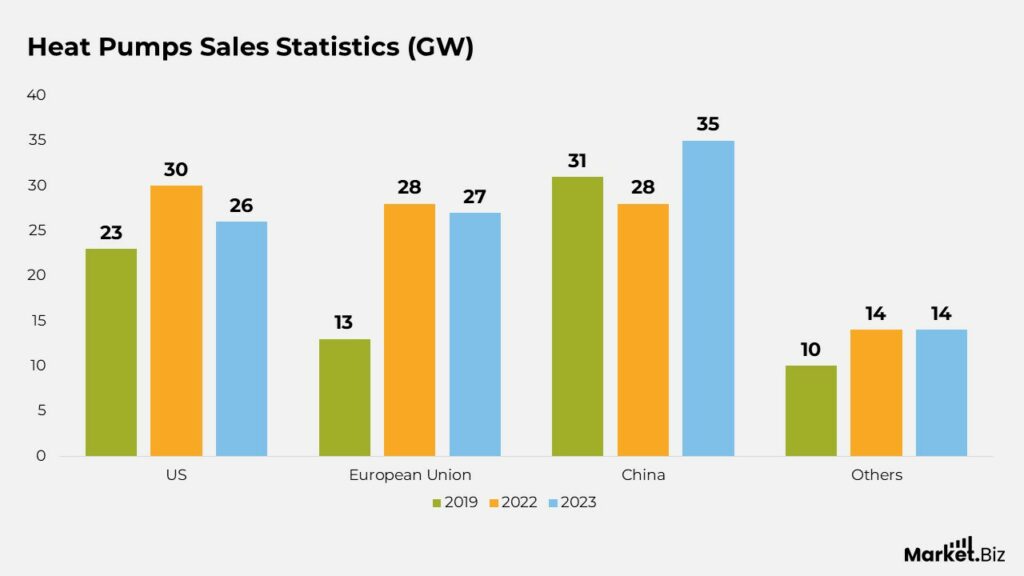
- Between 2019 and 2023, the sales of heat pumps across various regions displayed distinct trends.
- In the United States, sales rose from 23 GW in 2019 to 30 GW in 2022, before experiencing a slight decrease to 26 GW in 2023.
- The European Union experienced steady growth, with sales increasing from 13 GW in 2019 to a peak of 28 GW in 2022, followed by a minor decline to 27 GW in 2023.
- In China, sales were variable, beginning at 31 GW in 2019, dropping to 28 GW in 2020, and then rising to 35 GW by 2023.
- Japan exhibited relatively stable sales throughout this timeframe, with numbers remaining around 7 to 8 GW.
- Conversely, the rest of the world saw a consistent rise in heat pump sales, increasing from 10 GW in 2019 to 14 GW in both 2022 and 2023.
Heat Pump Air-Source statistics
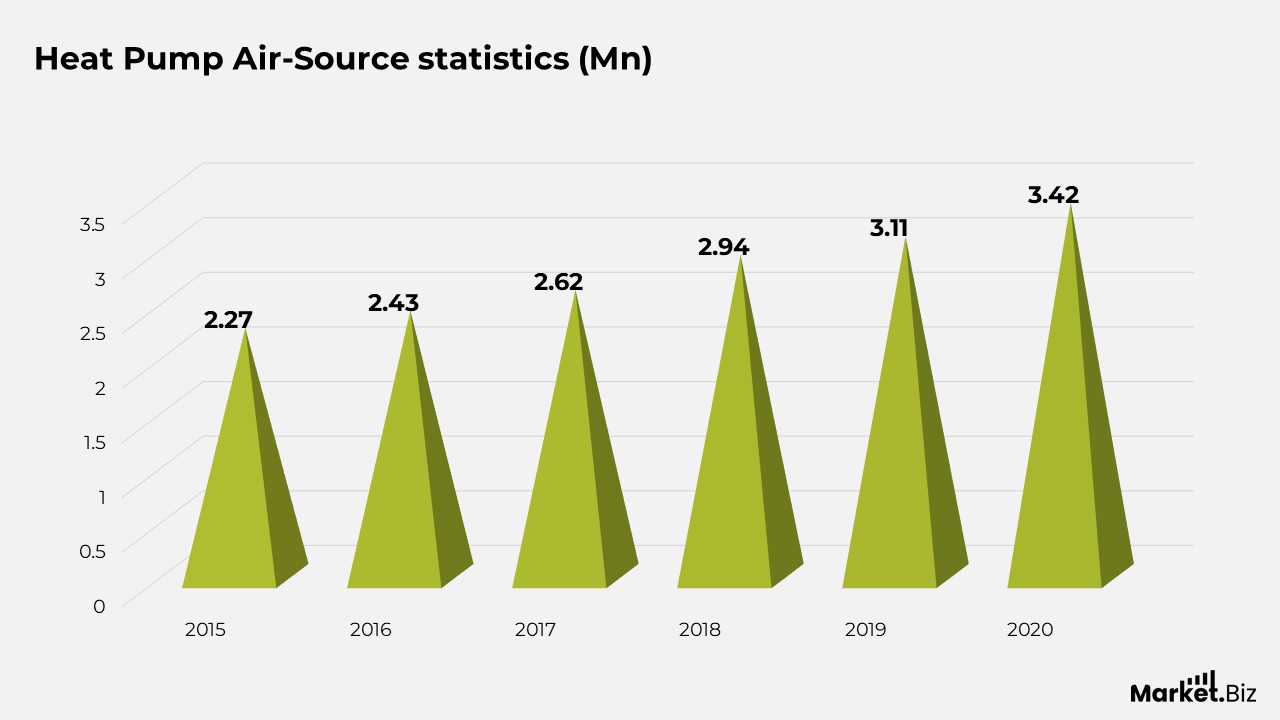
- Between 2001 and 2020, the total shipments of air-source heat pumps in the United States showed a consistent upward trajectory.
- In 2001, the total shipments amounted to 1.44 million units, which rose to 1.48 million in 2002 and 1.63 million in 2003.
- The market continued its expansion, achieving 1.89 million units in 2004 and exceeding 2 million shipments in 2005, with a total of 2.14 million units.
- A minor decline occurred thereafter, with shipments recorded at 2.12 million in 2006 and 1.9 million in 2007.
- This downward trend persisted through 2008 and 2009, with shipments falling to 1.87 million and 1.64 million, respectively.
- In 2010, the market began to rebound, with shipments reaching 1.75 million, followed by a gradual increase to 1.77 million in 2011 and a slight decrease to 1.7 million in 2012.
- By 2013, shipments had risen to 1.97 million, and growth accelerated in the subsequent years, reaching 2.35 million units in 2014 and 2.27 million in 2015.
- The upward trend continued, with 2.43 million units shipped in 2016, 2.62 million in 2017, and 2.94 million in 2018.
- From 2019 onwards, shipments surpassed 3 million units, with 3.11 million units shipped in 2019, increasing to 3.42 million in 2020.
Water Source Heat Pump Statistics
- A water source heat pump boasts a Coefficient of Performance (CoP) of approximately 6 (refer to the ground source heat pumps section for additional details). In contrast, a gas boiler has a CoP of roughly 0.93.
- Households could potentially save between £395 and £2000 with water source heat pumps, depending on the type of home and the system being replaced.
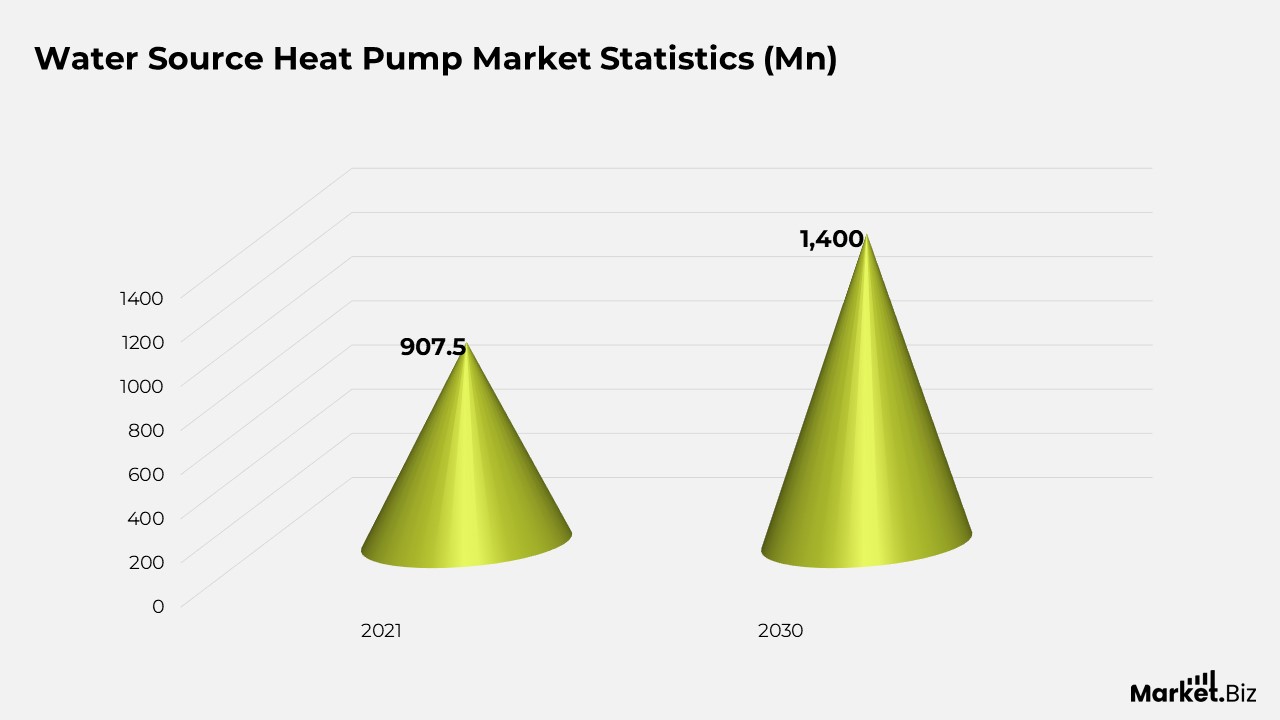
- In 2021, the market for water source heat pumps was valued at $907.5 million and is projected to expand at a Compound Annual Growth Rate of 5% from 2022 to 2030.
- By 2030, the global market for water source heat pumps is anticipated to reach approximately $1.4 billion.
Ground Source Heat Pump Statistics
- A ground source heat pump has the potential to reduce a household’s heating expenses by as much as £2500.
- However, it may also increase annual heating costs by up to £205, depending on the heating system being replaced by the pump.
- Ground source heat pumps can elevate water temperature from the ground to approximately 50ºC. Increasing the temperature beyond this point necessitates additional electricity and can impact efficiency.
- This type of heat pump can lead to a reduction of between 2300kg and 11,000kg of CO2 emissions annually, contingent upon the heating system it is substituting.
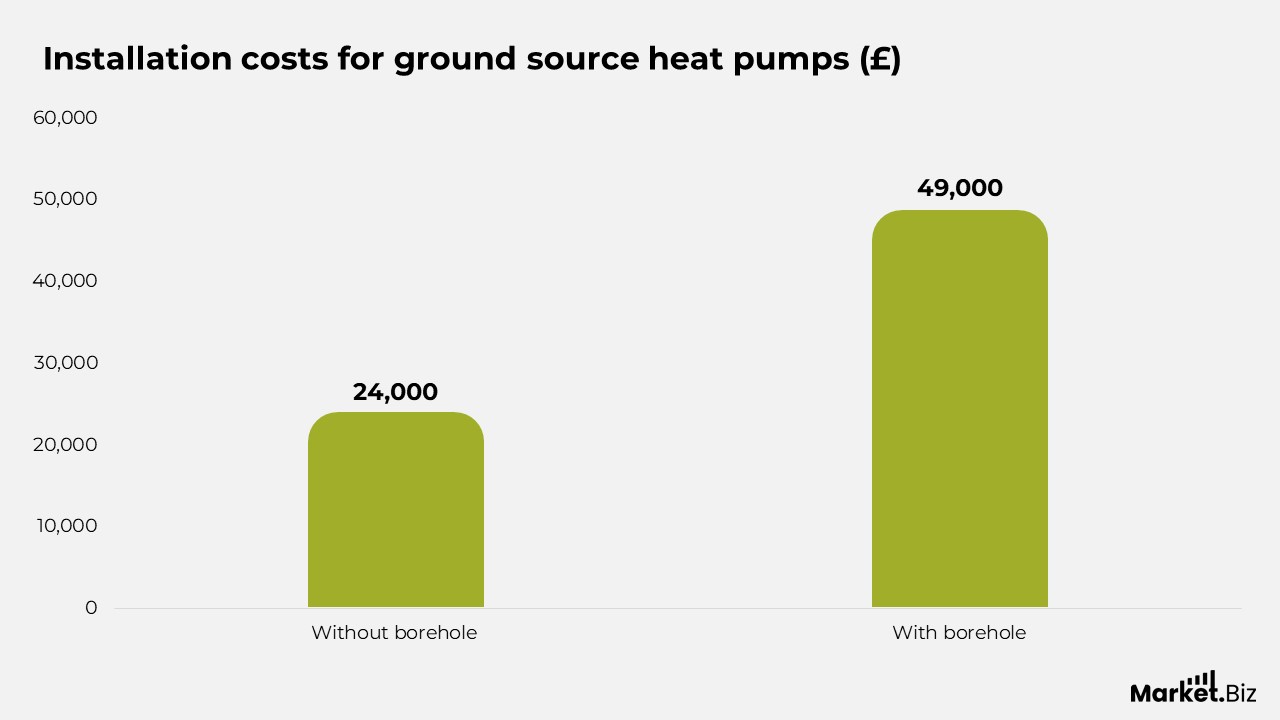
- The installation costs for ground source heat pumps can be around £24,000 if the loop is installed in trenches, and may reach up to £49,000 if a borehole is required.
- Ground source heat pumps possess a Coefficient of Performance (CoP) of 4.8. The CoP represents the ratio of heating output to the energy input. A higher CoP indicates a more efficient device, resulting in lower power consumption and, consequently, reduced energy costs. In comparison, a gas boiler typically has a CoP of about 0.93.
- Ground source heat pumps constitute only 2.5% of the total installed pumps within the EU.
- These heat pumps can generate 70% fewer carbon dioxide emissions than a gas boiler; if the electricity supplied is sourced from renewable energy, there are no carbon emissions.
- It is estimated that for every 100,000 homes equipped with ground source heat pumps, oil consumption will decrease by 2.15 million barrels annually.
Heat Pump Import Statistics
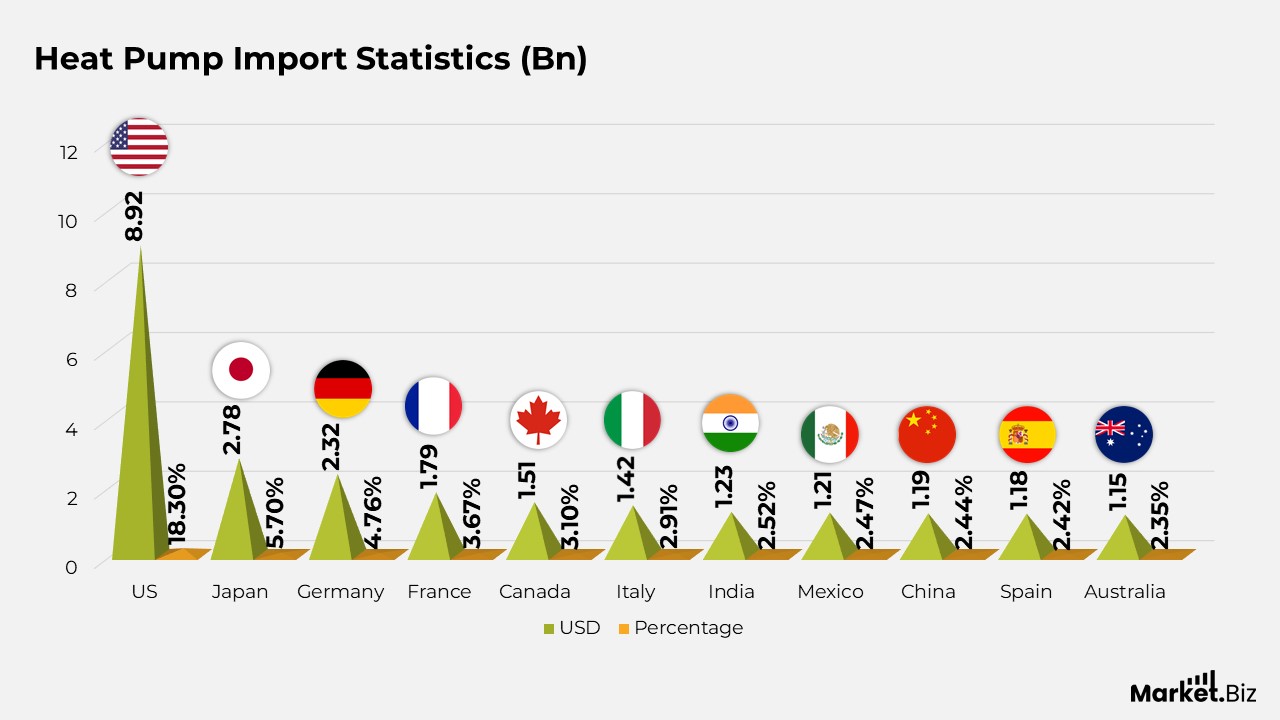
- In 2018, the United States emerged as the foremost importer of heating and cooling equipment and components, with an import value of USD 8.92 billion, which constituted 18.3% of the global market.
- Japan ranked second with imports valued at USD 2.78 billion, representing 5.7%, while Germany’s imports totaled USD 2.32 billion, accounting for 4.76% of the overall market.
- France’s imports reached USD 1.79 billion (3.67%), and Canada imported USD 1.51 billion (3.1%).
- Italy’s import figures stood at USD 1.42 billion, which is 2.91%, followed by India with USD 1.23 billion (2.52%).
- Both China and Mexico imported approximately USD 1.19 billion and USD 1.21 billion, corresponding to 2.44% and 2.47% of global imports, respectively.
- Australia and Spain imported USD 1.15 billion (2.35%) and USD 1.18 billion (2.42%), respectively.
- Additionally, other significant importers included Vietnam at USD 0.992 billion (2.03%), the United Arab Emirates with USD 1.01 billion (2.07%), Saudi Arabia with USD 0.905 billion (1.85%), and the United Kingdom with USD 0.957 billion (1.96%).
Export Statistics of Heat Pumps
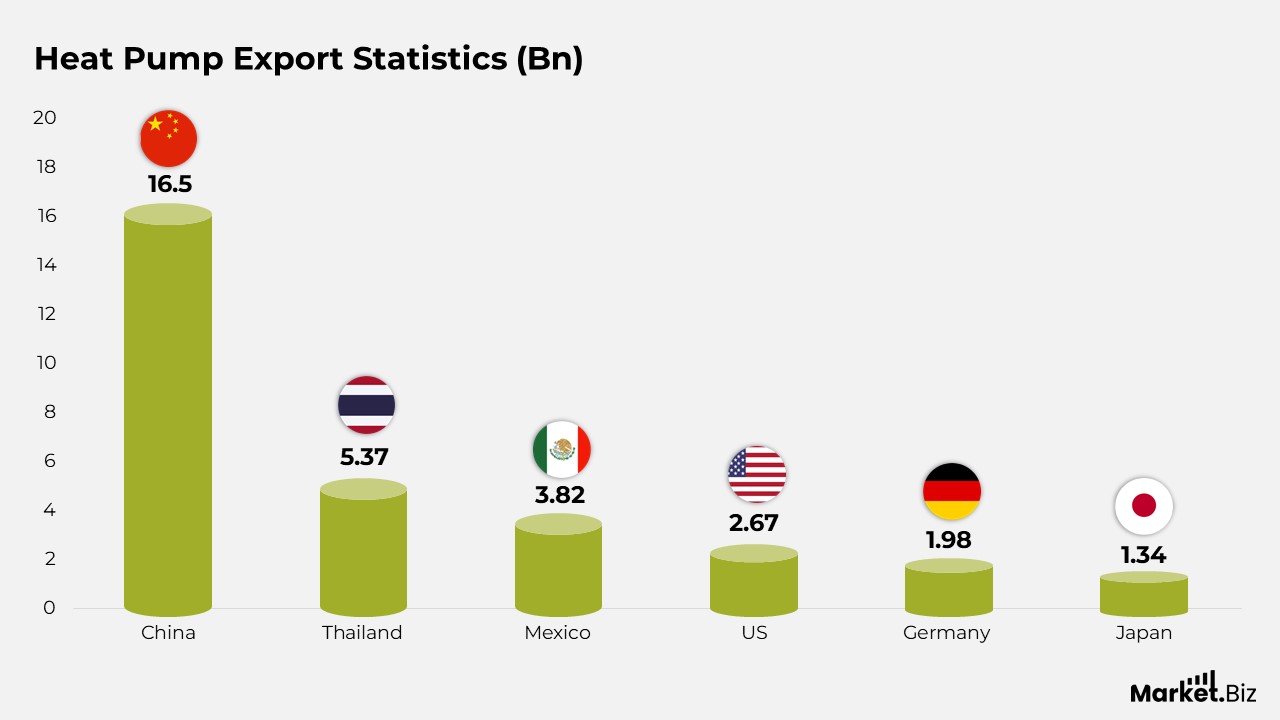
- In 2018, China emerged as the foremost exporter of heating and cooling equipment and components, achieving an export value of USD 16.5 billion, which constituted 33.7% of the worldwide market.
- Thailand ranked second with exports amounting to USD 5.37 billion, representing 11% of the overall total.
- Mexico secured the third position, with its exports reaching USD 3.82 billion, equivalent to 7.83%.
- The United States exported equipment valued at USD 2.67 billion, capturing 5.48% of the market share.
- Germany contributed USD 1.98 billion in exports, accounting for 4.06%, while Italy and Czechia each reported exports of approximately USD 1.83 billion, holding market shares of 3.76% and 3.72%, respectively.
- Japan’s exports were valued at USD 1.34 billion, representing 2.75%, closely followed by South Korea with exports of USD 1.29 billion, or 2.64%.
- Malaysia, the Netherlands, and Belgium each maintained market shares ranging from 1.91% to 2.61%.
- Simultaneously, the United Arab Emirates, Hong Kong, and Spain each contributed approximately 1.42% to 1.64% of the global export value.
Heat Pumps Cost Statistics
- In the South East of England, the price range for air-source heat pumps is between £10,000 and £14,000, whereas ground-source heat pumps are available at prices ranging from £15,000 to £35,000.
- In the South West, the cost of air-source heat pumps falls between £9,000 and £13,000, while ground-source heat pumps are priced from £14,000 to £34,000.
- In London, air-source heat pumps are priced higher, with costs ranging from £11,000 to £15,000, and ground-source heat pumps are available at prices between £16,000 and £36,000.
- In the Midlands, the costs for air-source heat pumps range from £9,500 to £13,500, while ground-source heat pumps are priced between £14,500 and £34,500.
- In the North West, air-source heat pumps are priced between £8,500 and £12,500, with ground-source heat pumps costing from £13,500 to £33,500.
- In the North East, air-source heat pumps are somewhat more affordable, with prices ranging from £8,000 to £12,000, while ground-source heat pumps are priced between £13,000 and £33,000.
- In Scotland and Wales, the pricing is comparable, with air-source heat pumps costing between £9,000 and £13,000 and ground-source heat pumps ranging from £14,000 to £34,000 in both areas.
Heat Pumps Investment Statistics
- From 2013 to 2015, investment amounts changed slightly, with USD 212 billion recorded in 2013, USD 313 billion in 2014, and USD 388 billion in 2015.
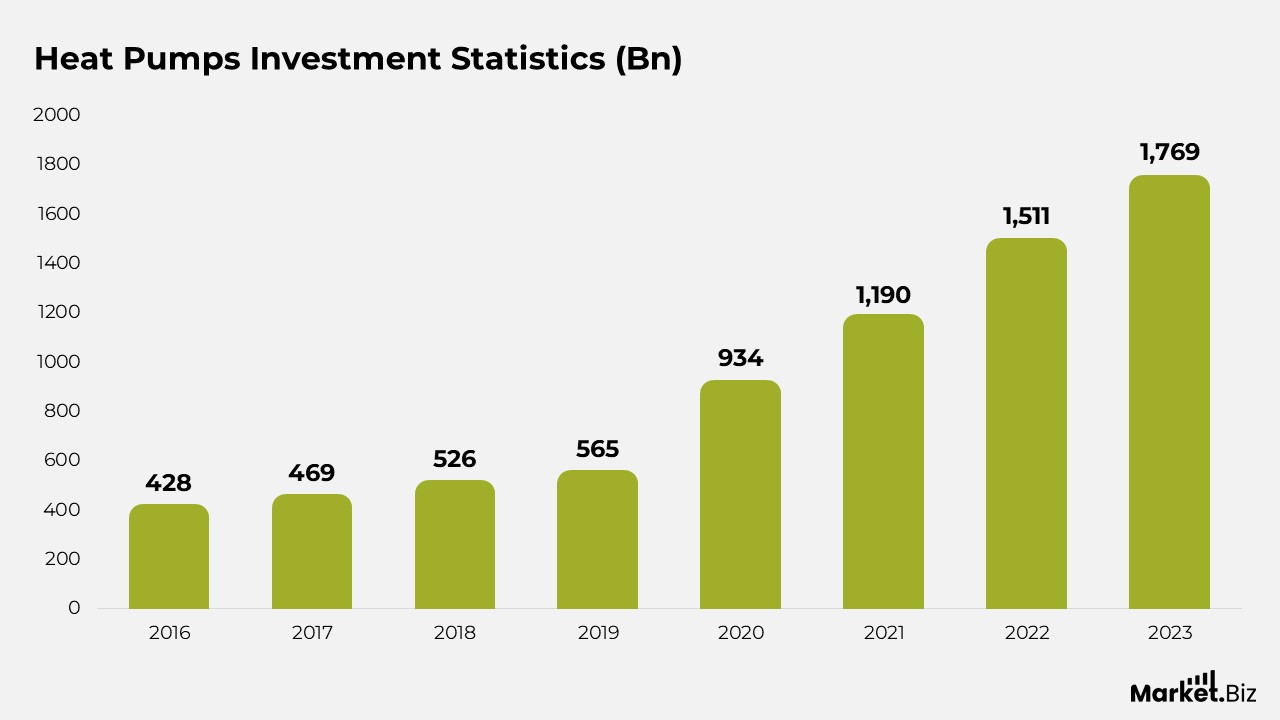
- At the same time, investments persisted in their upward trajectory over the subsequent years, attaining USD 428 billion, USD 469 billion, and USD 526 billion in 2016, 2017, and 2018. By the year 2019, the cumulative investments had risen to USD 565 billion.
- The most significant growth occurred in the 2020s. In 2020, investments soared to USD 934 billion, followed by a remarkable rise to USD 1,190 billion in 2021.
- This increasing trend continued, with USD 1,511 billion invested in 2022 and an expected USD 1,769 billion in 2023.
UK Heat Pump Statistics
- The United Kingdom presently has only 412 heat pumps for every 100,000 individuals.
- In 2021, the UK heat pump market experienced nearly a twofold increase.
- In 2022, 55,000 heat pumps were sold in the UK; in contrast, France saw sales exceeding 620,000 units.
- In 2022, 21 European nations recorded higher rates of heat pump installations than the UK.
- The UK aims to deploy 600,000 heat pumps annually by the year 2028.
- Enhancing the adoption rate of heat pumps in the UK could potentially generate up to 55,000 new employment opportunities, whereas the current workforce in the industry is approximately 2,000.
- From 2021 to 2022, there was a 40% increase in heat pump sales, which translates to over 17,000 additional heat pumps installed compared to the previous year.
EU Heat Pump Statistics
- Currently, Europe has approximately 20 million installed heat pump units.
- In 2022, around 3 million heat pumps were sold within the EU.
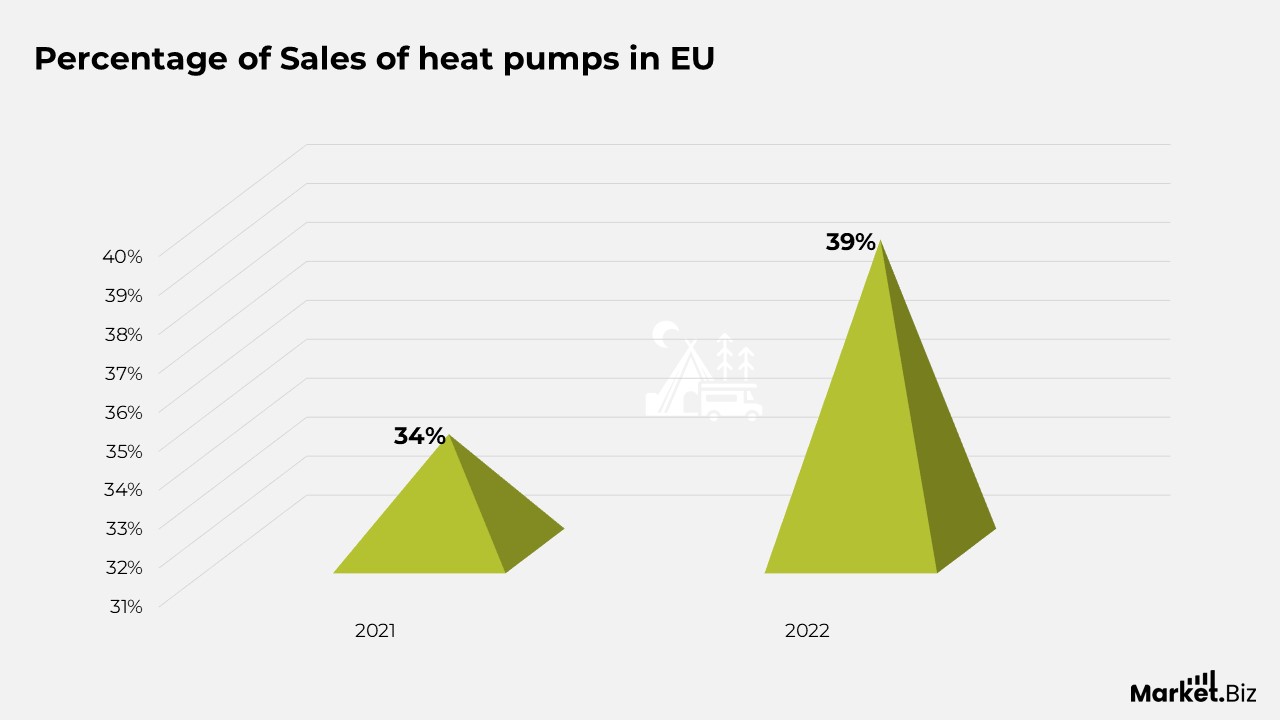
- Sales of heat pumps in 2022 experienced a growth of 39%, surpassing the 34% increase observed in 2021.
- France recorded the highest sales of heat pumps in 2022 among 21 European markets, with 621,776 units sold, while the UK reported sales of 55,168 units.
- If the installation rate of heat pumps in the EU were to double, it would lead to a reduction in gas consumption by 2 billion cubic metres in the first year.
- EU Member States have set a target to decrease greenhouse gas emissions by 55% by the year 2030.
- In 2022, heat pumps in Europe contributed to avoiding 54 megatonnes of CO2 emissions.
- Heat pumps represent approximately 16% of the heating for residential and commercial buildings across Europe.
Conclusion
Heat pumps represent a highly efficient and environmentally friendly alternative to conventional heating and cooling systems, delivering both heating and cooling while utilizing minimal energy.
They have the potential to greatly decrease carbon emissions, particularly in areas with clean electricity grids, and offer long-term financial savings despite their higher initial costs.
Furthermore, as the demand for energy-efficient solutions increases, heat pumps are becoming crucial for lowering building emissions and meeting climate objectives, positioning them as a vital technology in the worldwide transition towards sustainability.
FAQs
Heat pumps can achieve efficiencies of 300% to 400% because they transfer heat rather than create it. This indicates that for each unit of energy consumed, they generate three to four units of heat. Although the efficiency of heat pumps tends to decrease in colder weather, they frequently maintain efficiencies exceeding 100%.
The four categories of heat pumps include air-source, ductless, ground-source, and advanced heat pump systems.
Typically, both heat pumps and air conditioning systems have an average lifespan of approximately 15 years. In moderate climates, heat pumps function throughout the year as they provide both heating and cooling, whereas air conditioning systems generally operate for only about six months annually. The longevity of both systems is influenced by several factors, including usage patterns and maintenance practices.