
Introduction
Office Furniture Statistics: Office furniture encompasses vital components such as desks, chairs, storage units, conference tables, and reception furniture, all crafted to enhance productivity and organization.
Desks and ergonomic chairs address individual work requirements. Meanwhile, storage units like file cabinets and bookshelves assist in keeping a tidy workspace. Conference tables enable meetings, and reception furniture fosters a hospitable atmosphere for guests.
The office furniture sector represents a multi-billion-dollar industry propelled by urbanisation, hybrid work models, and the demand for ergonomic and sustainable solutions. Prominent trends include the incorporation of smart technology.
A significant demand for chairs and flexible workstations, and the increasing impact of organised players and global brands. In spite of challenges, the market is anticipated to experience consistent growth worldwide. Driven by both corporate office demands and the emergence of remote and hybrid work arrangements.
Editor’s Choice
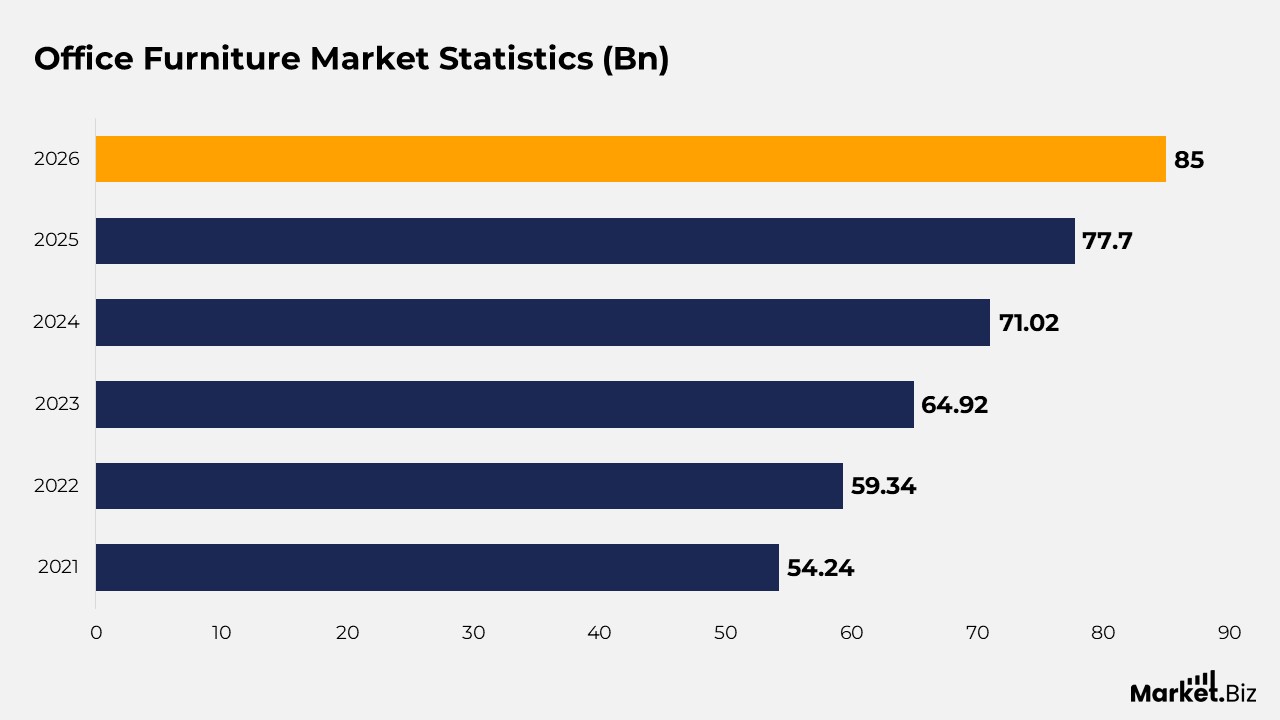
- By the year 2026, it is projected that the global office furniture market will reach a valuation of USD 85 billion.
- In 2021, the market was estimated to be worth around USD 54.24 billion, rising to USD 59.34 billion in 2022.
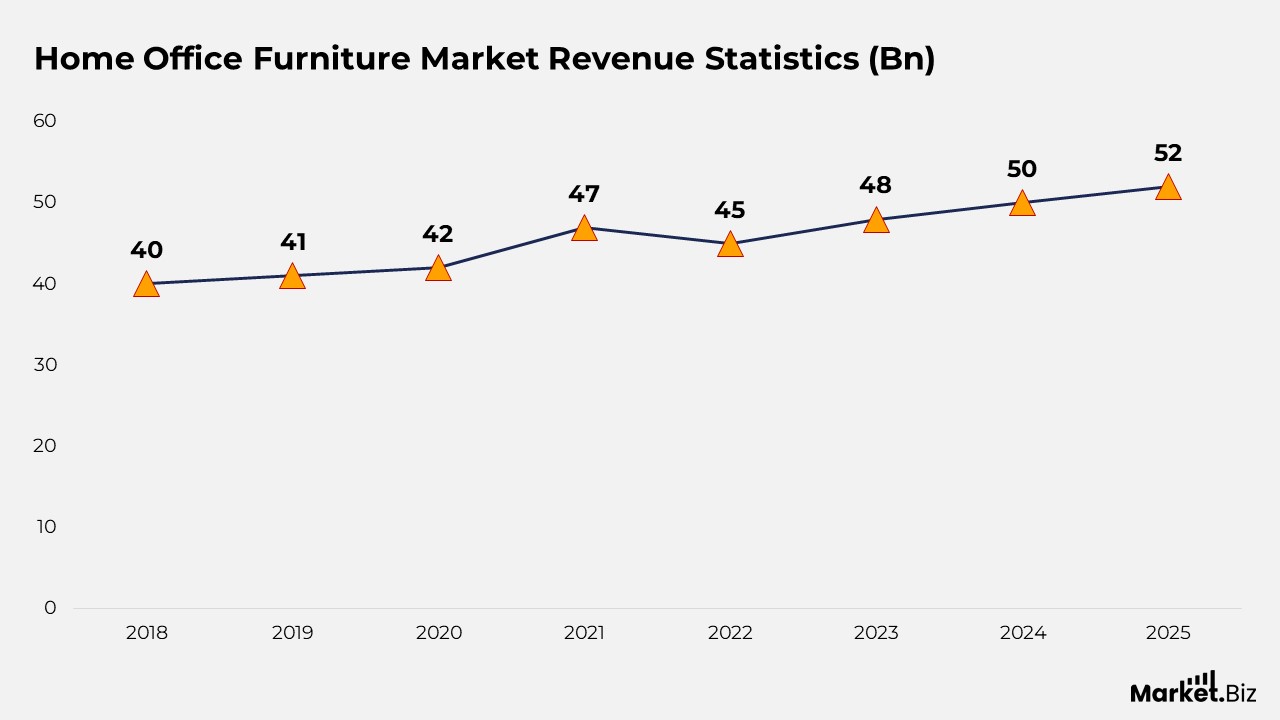
- In 2018, the market revenue was recorded at USD 40 billion. It experienced a slight increase to USD 41 billion in 2019 and further to USD 42 billion in 2020.
- In 2009, revenue was recorded at USD 1,108 million, which rose to USD 1,170 million in 2010.
- In 2015, the total value of imports was USD 964.02 million, which saw a steady increase to USD 1,036.53 million in 2016, ultimately reaching a peak of USD 1,147.85 million in 2017.
- In 2015, the value of exports was recorded at USD 156 million, which subsequently fell to USD 134.77 million in 2016.
General Office Furniture Statistics
- By the year 2026, it is projected that the global office furniture market will reach a valuation of USD 85 billion.
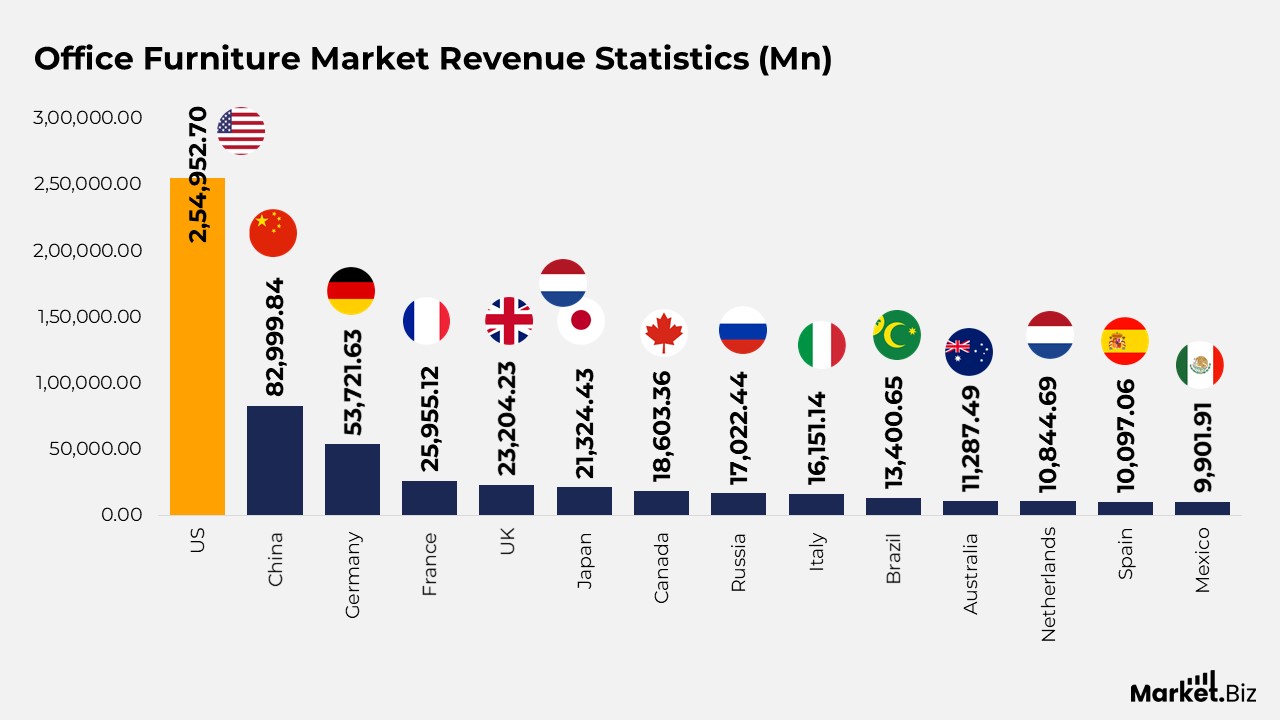
- In 2023, the United States was at the forefront of the global office furniture market, generating a revenue of USD 254,952.7 million.
- In 2023, Herman Miller was recognised as the top office furniture company globally, achieving a revenue of USD 3.63 billion.
- In 2020, U.S. consumers showed a preference for particular categories of home office furniture, with chairs and desks being the most favoured, each chosen by 27% of survey participants.
- In 2020, 34% of U.S. consumers indicated intentions to buy home office furniture within the following month, while 43% planned to purchase within 2-3 months, indicating robust short-term demand.
- In 2023, the value of wooden office furniture imports into the United States decreased to USD 838.25 million.
- Innovations within the office furniture sector in 2023 have concentrated on developing dynamic, environmentally sustainable, and technologically advanced workspaces.
Office Furniture Market Statistics
- In 2021, the market was estimated to be worth around USD 54.24 billion, rising to USD 59.34 billion in 2022.
- This positive trend persisted into 2023, with the market value climbing to USD 64.92 billion.
- Forecasts suggest continued significant growth, with the market projected to reach USD 71.02 billion in 2024 and USD 77.70 billion in 2025.
- By 2026, the global office furniture market is expected to attain a valuation of USD 85 billion.
Office Furniture Market Revenue Statistics
- The United States dominated the market with a remarkable revenue of USD 254,952.7 million. This was followed by China, which generated USD 82,999.84 million, and Germany, with revenues of USD 53,721.63 million.
- Other significant contributors included France, which reported USD 25,955.12 million, the United Kingdom with USD 23,204.23 million, and Japan with USD 21,324.43 million.
- Canada produced USD 18,603.36 million, while Russia and Italy achieved revenues of USD 17,022.44 million and USD 16,151.14 million, respectively.
- Brazil’s contribution was USD 13,400.65 million, and Australia generated USD 11,287.49 million.
- Additional notable markets comprised the Netherlands, which generated USD 10,844.69 million, Spain with USD 10,097.06 million, and Mexico with USD 9,901.91 million.
- Sweden, South Korea, and Saudi Arabia reported revenues of USD 8,778.53 million, USD 9,339.27 million, and USD 8,154.09 million, respectively.
- Turkey contributed USD 7,290.36 million, while Hong Kong generated USD 5,788.19 million, and Switzerland reported USD 5,637.54 million.
- Argentina, India, and Indonesia had revenues of USD 5,037.69 million, USD 5,484.89 million, and USD 3,145.36 million, respectively.
- Smaller markets included Thailand, which reported USD 2,626.73 million, and the Philippines, with revenues of USD 791.4 million.
Home Office Furniture Market Revenue Statistics
- In 2018, the market revenue was recorded at USD 40 billion. It experienced a slight increase to USD 41 billion in 2019 and further to USD 42 billion in 2020.
- A notable rise took place in 2021, with revenue climbing to USD 47 billion. This was followed by a minor decline to USD 45 billion in 2022.
- Growth resumed in 2023, with the market estimated at USD 48 billion.
- Forecasts suggest a steady upward trajectory, with revenues projected to reach USD 50 billion in 2024, USD 52 billion in 2025, and USD 55 billion in 2026.
- By 2027, the market is expected to generate USD 57 billion, ultimately reaching USD 60 billion by 2028.
Office Furniture Revenue by Countries
Canada
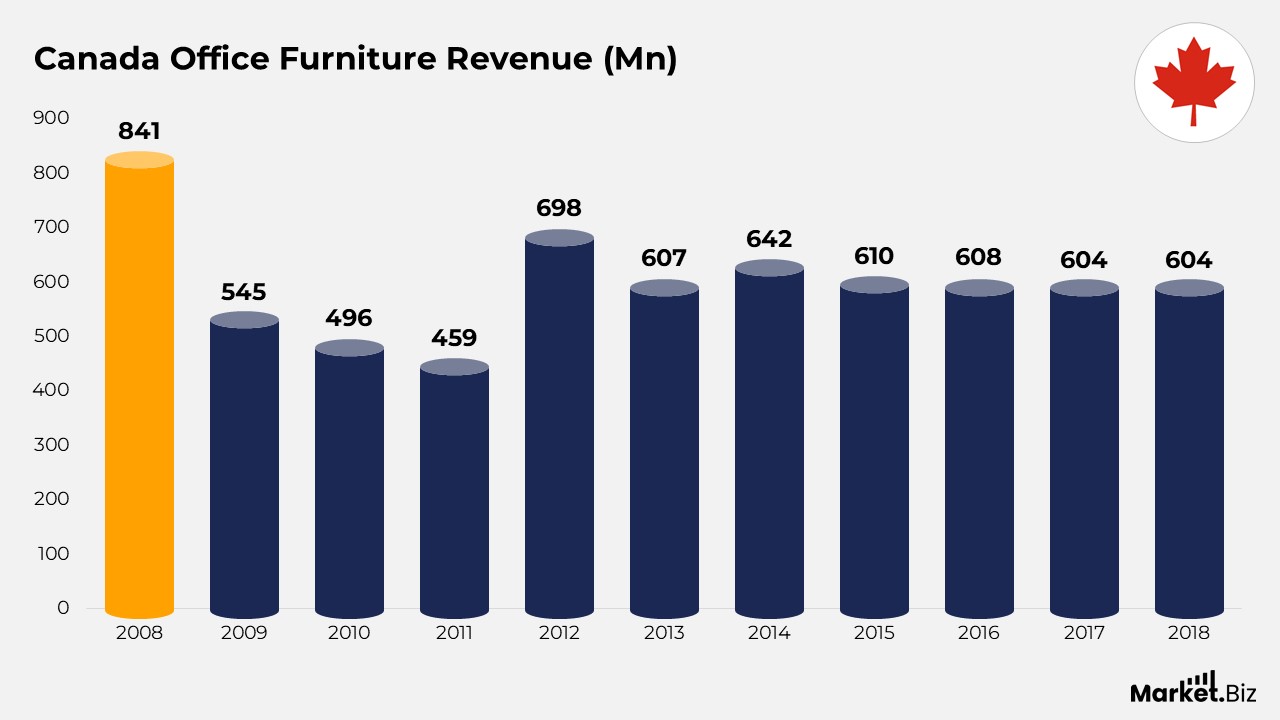
- In 2008, the revenue peaked at USD 841 million; however, it saw a significant decline to USD 545 million in 2009 and further decreased to USD 496 million in 2010.
- The downward trend persisted into 2011, with revenue falling to USD 459 million.
- A robust recovery commenced in 2012, as revenues bounced back to USD 698 million, followed by USD 607 million in 2013.
- In 2014, revenues rose to USD 642 million before becoming stable at USD 610 million in 2015 and USD 606 million in 2016.
- During the last two years of this period, 2017 and 2018, revenues remained steady at USD 604 million.
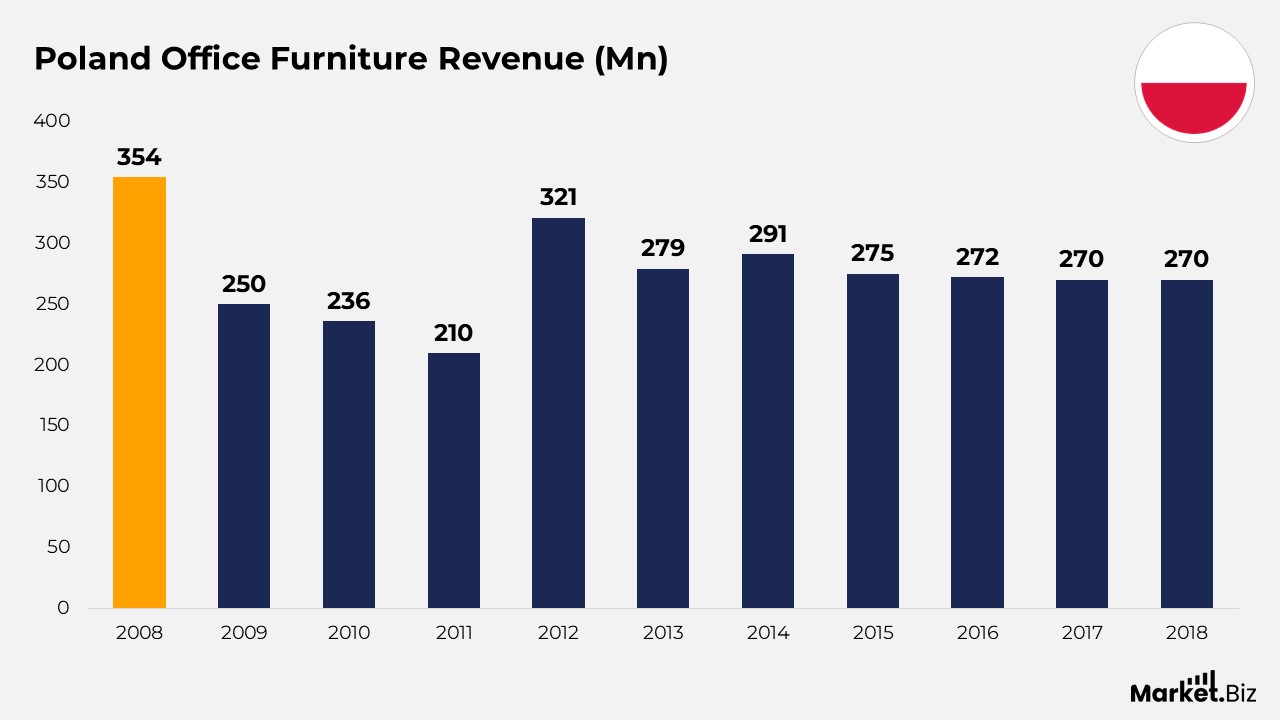
Poland
- In 2008, the revenue amounted to USD 354 million; however, it experienced a significant decline to USD 250 million in 2009 and further decreased to USD 236 million in 2010.
- The downward trend persisted into 2011, with revenue falling to USD 210 million.
- A robust recovery took place in 2012, as revenues bounced back to USD 321 million.
- Nevertheless, this was succeeded by a minor decline to USD 279 million in 2013, before rising again to USD 291 million in 2014.
- From 2015 onward, the market exhibited stability, with revenues recorded at USD 275 million in 2015, USD 272 million in 2016, and USD 270 million in both 2017 and 2018.
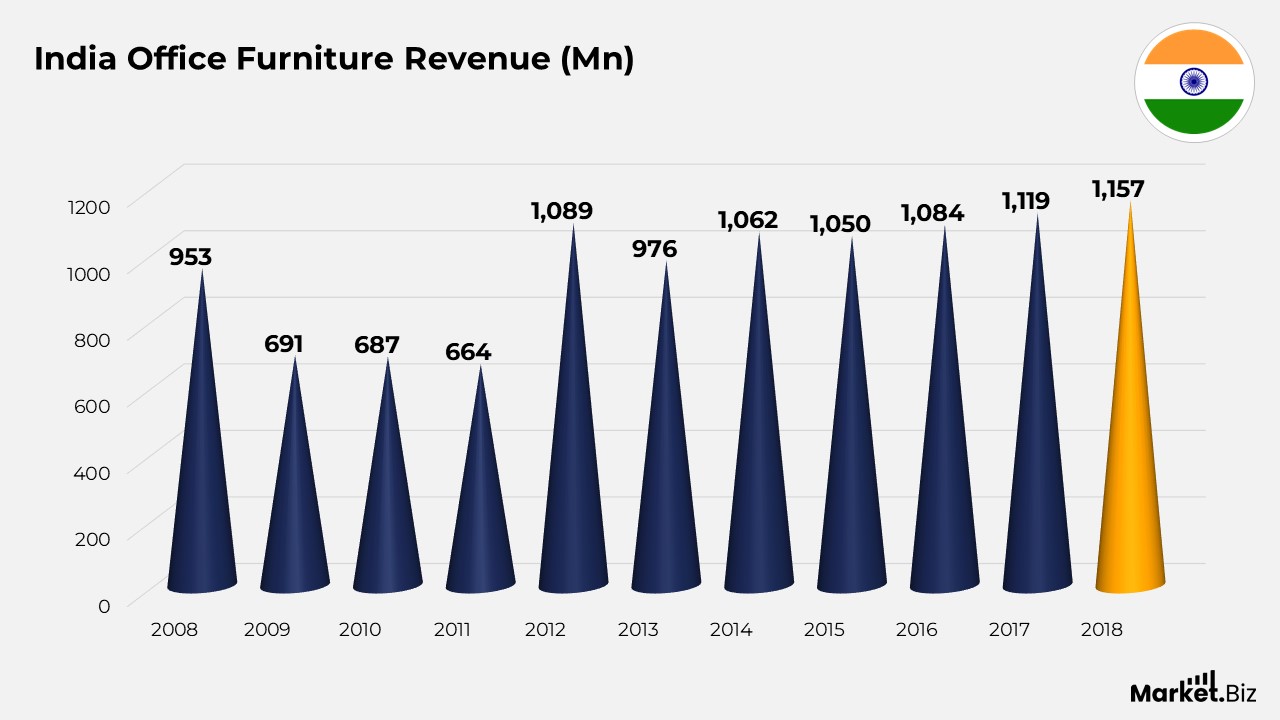
India
- In 2008, the revenue was assessed at USD 953 million; however, it faced a significant downturn in the following years, dropping to USD 691 million in 2009 and USD 687 million in 2010, ultimately hitting its lowest level at USD 664 million in 2011.
- A strong recovery took place in 2012, with revenue increasing to USD 1,089 million.
- This was succeeded by a minor decline to USD 976 million in 2013, before climbing once more to USD 1,062 million in 2014.
- In the subsequent years, the market exhibited steady growth, with revenues of USD 1,050 million in 2015, USD 1,084 million in 2016, USD 1,119 million in 2017, and ultimately reaching USD 1,157 million in 2018.
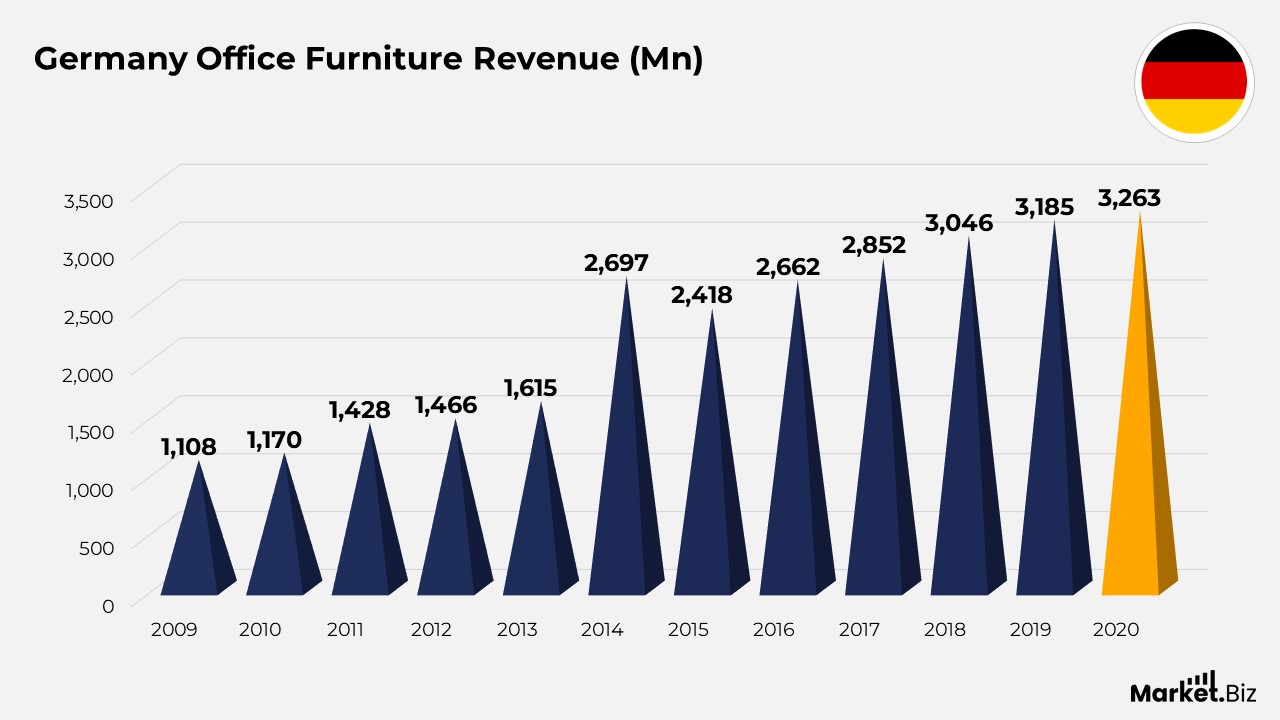
Germany
- In 2009, revenue was recorded at USD 1,108 million, which rose to USD 1,170 million in 2010.
- A significant increase was noted in 2011, reaching USD 1,428 million. This was followed by consistent growth to USD 1,466 million in 2012 and USD 1,615 million in 2013.
- A remarkable surge was seen in 2014, with revenue soaring to USD 2,697 million. However, it experienced a slight decline to USD 2,418 million in 2015.
- A recovery took place in 2016 with revenue at USD 2,662 million, followed by ongoing growth to USD 2,852 million in 2017 and USD 3,046 million in 2018.
- The upward trend persisted with USD 3,185 million in 2019, increasing further to USD 3,263 million in 2020.
Office Furniture Sales by Country Statistics
US
- In 1992, there was a 6.7% increase in sales, which was followed by a slight decrease to 5.8% in 1993.
- Growth reached its highest point at 8.5% in 1994 and then stabilized at approximately 6.6% and 6.4% in 1995 and 1996, respectively.
- A significant rise to 14.1% was recorded in 1997, before it settled at 7.8% in 1998.
- However, in 1999, growth was minimal at 0.9%, followed by a recovery to 8.5% in 2000.
- The years 2001 and 2002 saw strong growth rates of 17.4% and 19%, respectively.
- In 2003, growth slowed to 4.3%, then gradually increased to 5.1% in 2004 and 12.7% in 2005.
- Sales rose by 7.4% and 5.5% in 2006 and 2007, respectively, but then sharply declined to 2.3% in 2008.
- The financial crisis of 2009 caused a significant drop, with sales falling by 29.7%.
- Recovery commenced in 2010 with a 5.8% increase, followed by a robust growth of 17.6% in 2011 and 7.5% in 2012.
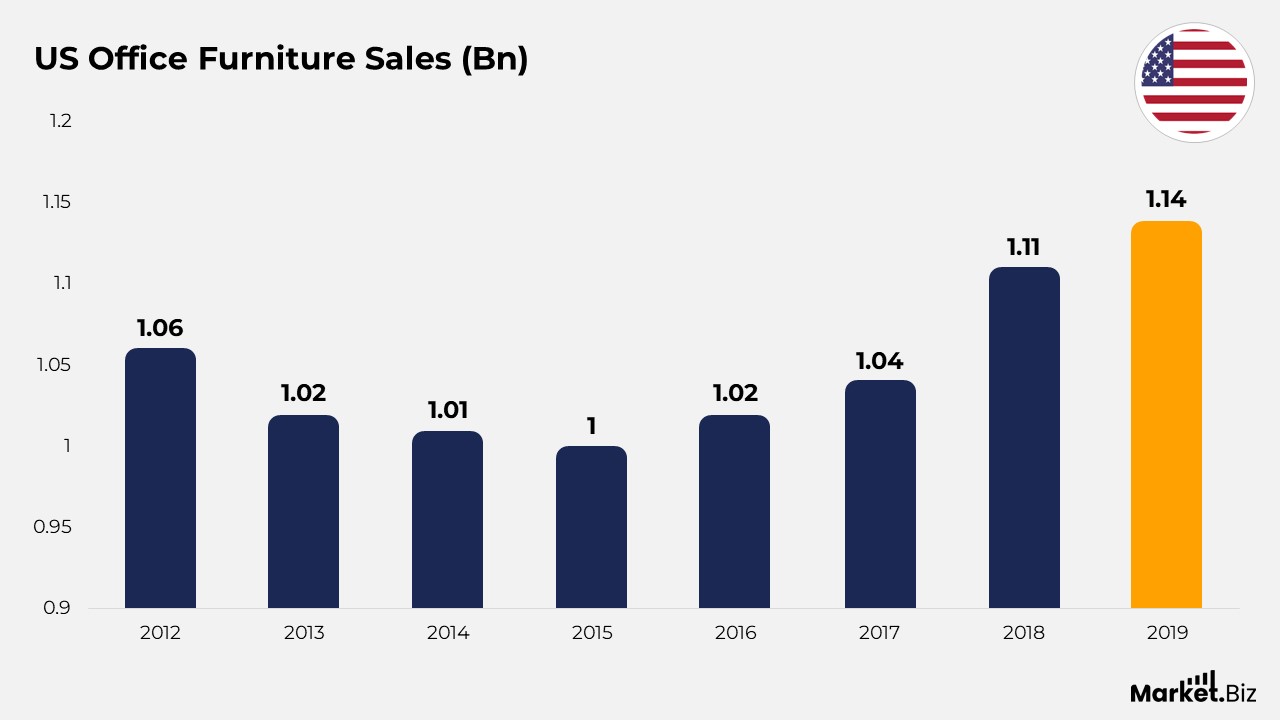
- In 2012, retail sales were recorded at USD 1.06 billion, but this figure decreased to USD 1.02 billion in 2013 and further to USD 1.01 billion in 2014.
- By 2015, sales had slightly decreased to USD 1 billion before rebounding to USD 1.02 billion in 2016 and USD 1.04 billion in 2017.
- An upward trend was notably observed in 2018, with sales rising to USD 1.11 billion and reaching USD 1.14 billion in 2019.
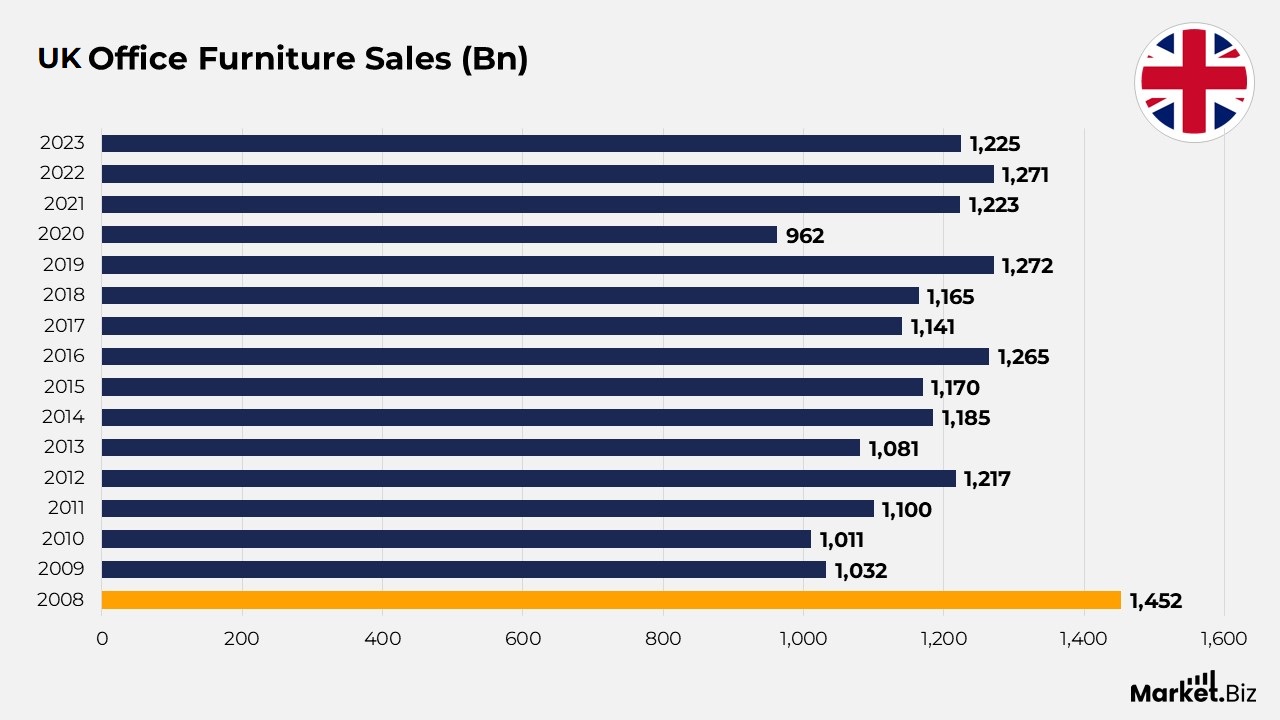
UK
- In 2008, sales were recorded at £1,452 million; however, the subsequent year witnessed a significant decrease to £1,032 million, followed by an additional decline to £1,011 million in 2010.
- A recovery commenced in 2011, with sales increasing to £1,100 million and further rising to £1,217 million in 2012.
- Nevertheless, in 2013, there was a decrease to £1,081 million before a rebound to £1,185 million in 2014.
- The market exhibited relative stability, with sales at £1,170 million in 2015, escalating to £1,265 million in 2016.
- In 2017, sales decreased to £1,141 million, succeeded by a modest rise to £1,165 million in 2018 and £1,272 million in 2019.
- A notable decline transpired in 2020, as sales fell to £962 million, likely influenced by the COVID-19 pandemic.
- The market recovered to £1,223 million in 2021 and maintained its strength, achieving £1,271 million in 2022 and £1,225 million in 2023.
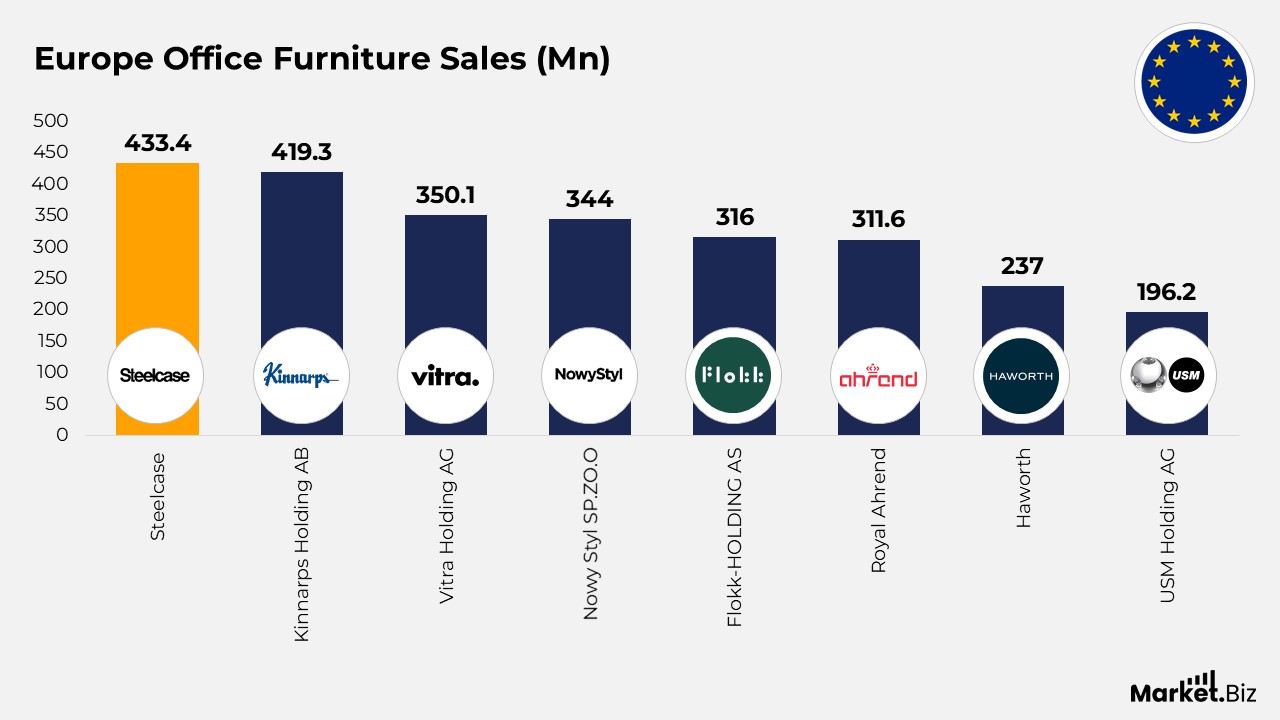
Europe
- Steelcase topped the rankings with sales totaling €433.4 million, closely trailed by Kinnarps Holding AB at €419.3 million.
- Vitra Holding AG announced sales of €350.1 million.
- Nowy Styl SP.ZO.O reached €344 million.
- Royal Ahrend and Flokk-HOLDING AS followed with sales figures of €311.6 million and €316 million, respectively.
- Haworth made €237 million.
- USM Holding AG accomplished €196.2 million.
- Sedus Stoll AG recorded €189.3 million, whereas Senator International produced €185.22 million.
- Interstuhl contributed €169.4 million, and Konig+Neurath reported sales of €152.6 million.
- Dauphin Office Interiors attained €140.2 million.
- Lienhard Office Group rounded out the list with €129 million in sales.
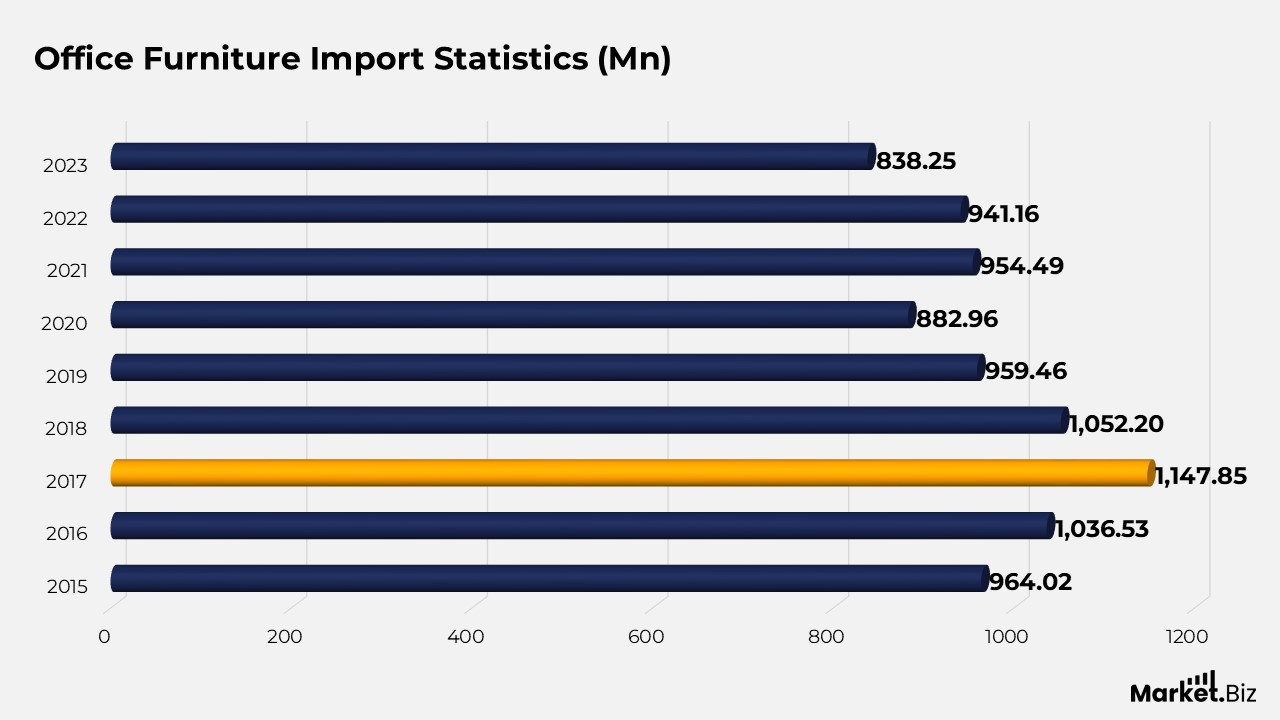
Office Furniture Import Statistics
- In 2015, the total value of imports was USD 964.02 million, which saw a steady increase to USD 1,036.53 million in 2016, ultimately reaching a peak of USD 1,147.85 million in 2017.
- However, in 2018, there was a slight decline in value to USD 1,052.2 million, which further decreased to USD 959.46 million in 2019.
- A notable decrease occurred in 2020, as imports dropped to USD 882.96 million, likely due to the impact of the global COVID-19 pandemic.
- The market experienced a slight recovery in 2021, with imports amounting to USD 954.49 million, followed by a small decline to USD 941.16 million in 2022.
- In 2023, the import value decreased further to USD 838.25 million.
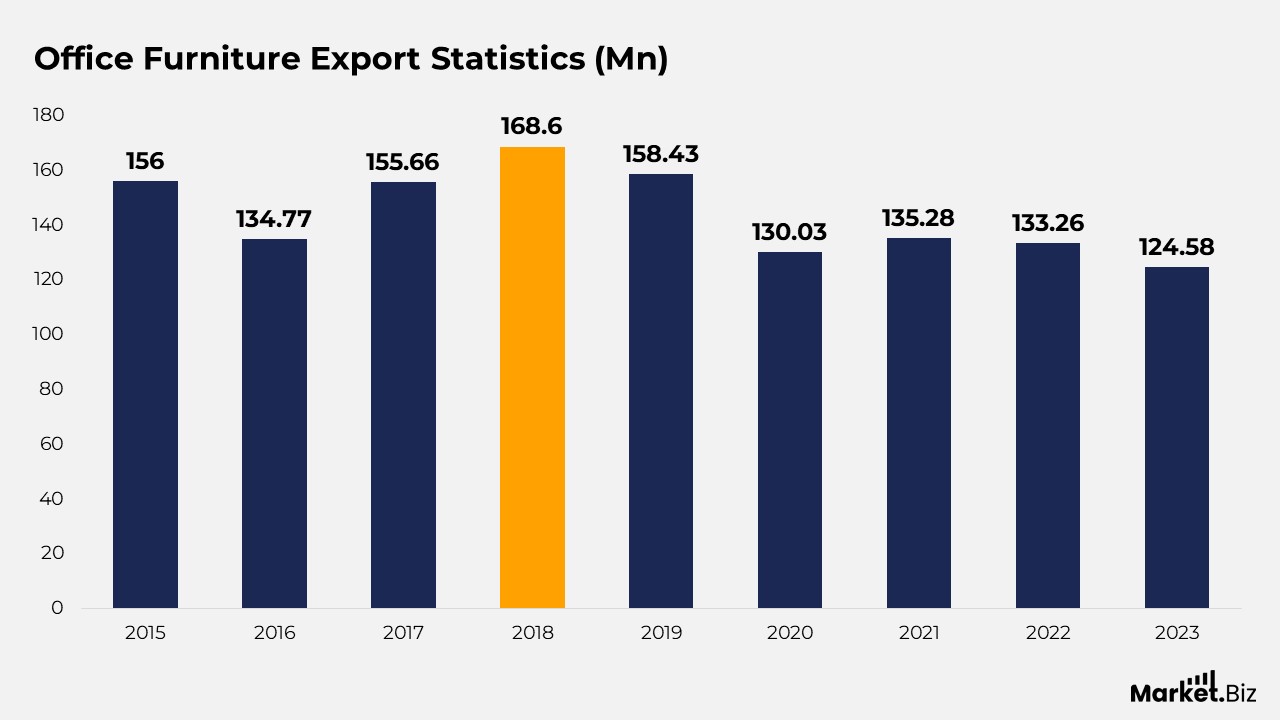
Office Furniture Export Statistics
- In 2015, the value of exports was recorded at USD 156 million, which subsequently fell to USD 134.77 million in 2016.
- The export value saw a recovery, reaching USD 155.66 million in 2017 and achieving a peak of USD 168.6 million in 2018.
- Nevertheless, this increase was not sustained, as exports fell to USD 158.43 million in 2019.
- A notable decline took place in 2020, with the export value dropping to USD 130.03 million, likely influenced by global disruptions stemming from the COVID-19 pandemic.
- Although there was a minor rebound in 2021 with exports amounting to USD 135.28 million, the figures once again decreased to USD 133.26 million in 2022 and further declined to USD 124.58 million in 2023.
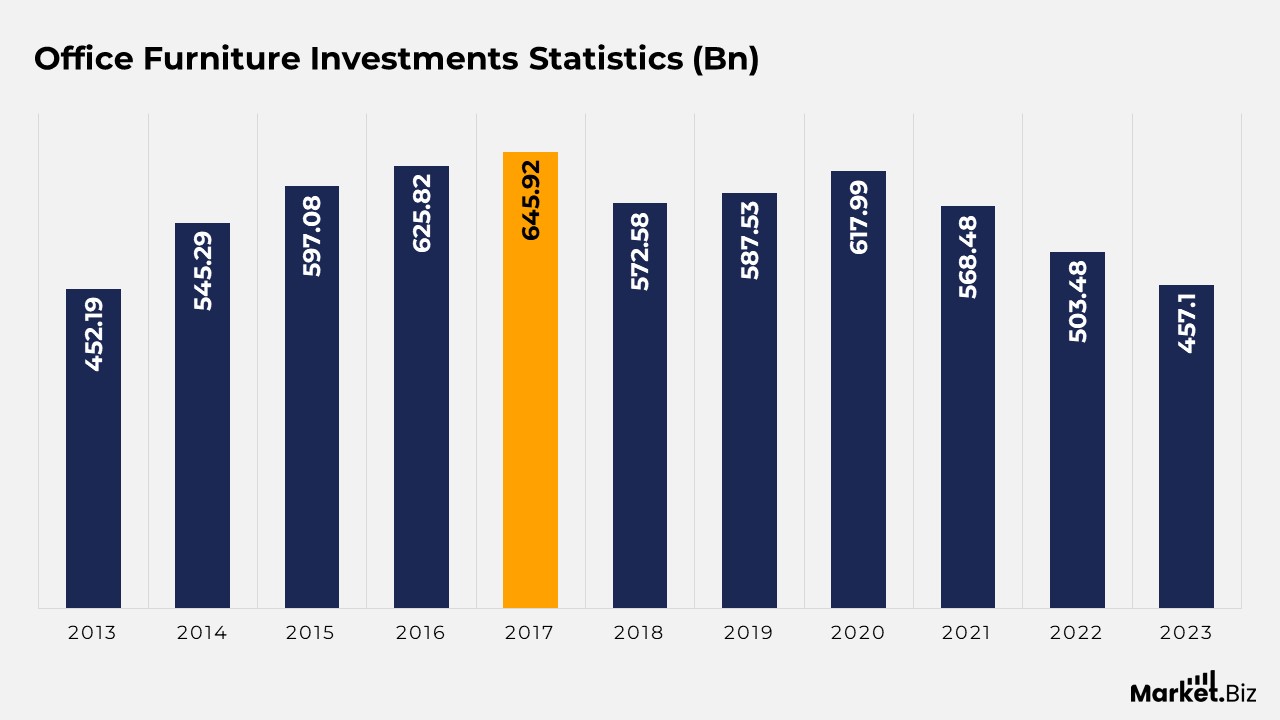
Investments in Office Furniture Statistics
- In 2013, the total amount of investments was 452.19 billion yuan, which saw a consistent increase to 545.29 billion yuan in 2014 and 597.08 billion yuan in 2015.
- The upward trajectory persisted, with investments climbing to 625.82 billion yuan in 2016 and reaching a peak of 645.92 billion yuan in 2017.
- Nevertheless, a downturn commenced in 2018, as investments decreased to 572.58 billion yuan, followed by a modest recovery to 587.53 billion yuan in 2019.
- In 2020, investments experienced another rise to 617.99 billion yuan but subsequently fell to 568.48 billion yuan in 2021.
- The downward trend continued into 2022, with investments declining to 503.48 billion yuan and further dropping to 457.1 billion yuan in 2023.
Office Furniture Recent Development
- In February 2022, Godrej and Boyce, a leading company within the Godrej group, revealed the introduction of Move Up, an ergonomic office desk aimed at individuals working from home through its division, Godrej Interior.
- In September 2022, Steelcase Inc. unveiled its latest ergonomic chair, named Steelcase Karman, which is engineered to adapt to the body’s movements and offer natural comfort, constructed with a new proprietary mesh fabric and an ultra-light, flexible frame.
Office Furniture Future Prediction
- The Office Furniture Market is anticipated to expand at a compound annual growth rate (CAGR) of 8.2% from 2024 to 2035, propelled by trends in remote work, advancements in ergonomic design, and initiatives focused on sustainability.
- By the year 2035, the market is predicted to be strong, mirroring the changing dynamics of the workplace and the preferences of consumers.
Conclusion
In summary, the global office furniture market has demonstrated steady growth, influenced by transforming work environments and shifting consumer preferences.
Although demand has varied across different regions, major markets, including the United States, China, and Europe, have consistently played a vital role. The transition to remote and hybrid work arrangements has intensified the demand for functional and ergonomic office furniture, particularly in categories such as office chairs and desks.
Despite the challenges presented by economic disruptions, the industry is anticipated to maintain its upward trend, propelled by innovation and an emphasis on enhancing workspaces for flexibility and comfort.
FAQs
The outlook for the Commercial Office Furniture Market appears optimistic, propelled by changing workplace dynamics, sustainability efforts, and advancements in technology. The market is anticipated to expand from USD 75 billion in 2024 to USD 110 billion by 2033, indicating a compound annual growth rate (CAGR) of 5.2% from 2026 to 2033.
The curved furniture style has emerged as a favoured design trend, characterised by soft, rounded edges and shapes, in contrast to the sharp lines typical of modern designs. This style provides a fluid and organic aesthetic, distinguishing itself from the straight lines and geometric forms of traditional designs.
The profit margins in the furniture industry generally range from 40% to 60%, varying based on the quality and category of the furniture sold; premium products often enjoy higher margins as consumers are more inclined to invest in them.