
Introduction
Digital twin statistics show that virtual replicas of physical assets and systems are becoming essential tools across industries, enabling organisations to simulate real-world conditions, monitor performance, and optimise decision-making using live data and analytics.
What began as a technology mainly used in manufacturing and aerospace now supports use cases in healthcare, smart cities, energy, automotive, construction, and supply chains, reflecting its rapid expansion and practical value.
These statistics help quantify adoption trends, operational benefits, efficiency improvements, and the growing influence of AI and IoT, showing how digital twins are shifting from experimental concepts to strategic, data-driven solutions for modern businesses.
Editor’s Choice
- Around 30% of real estate industry experts reported that their organizations are currently piloting digital twin solutions, making this the most common stage of adoption.
- Nearly 26% of respondents stated that they are in the research phase, indicating strong interest and evaluation activity before implementation.
- About 22% of experts said their companies have reached early-stage implementation. In which digital twin tools are applied to limited assets or projects.
- Only 15% confirmed that digital twin technology is fully in production use, indicating that large-scale deployment is still developing.
- Just 8% expressed no interest in adopting digital twins, highlighting low resistance and growing awareness across the industry.
(Sources: Statista, Electro IQ)
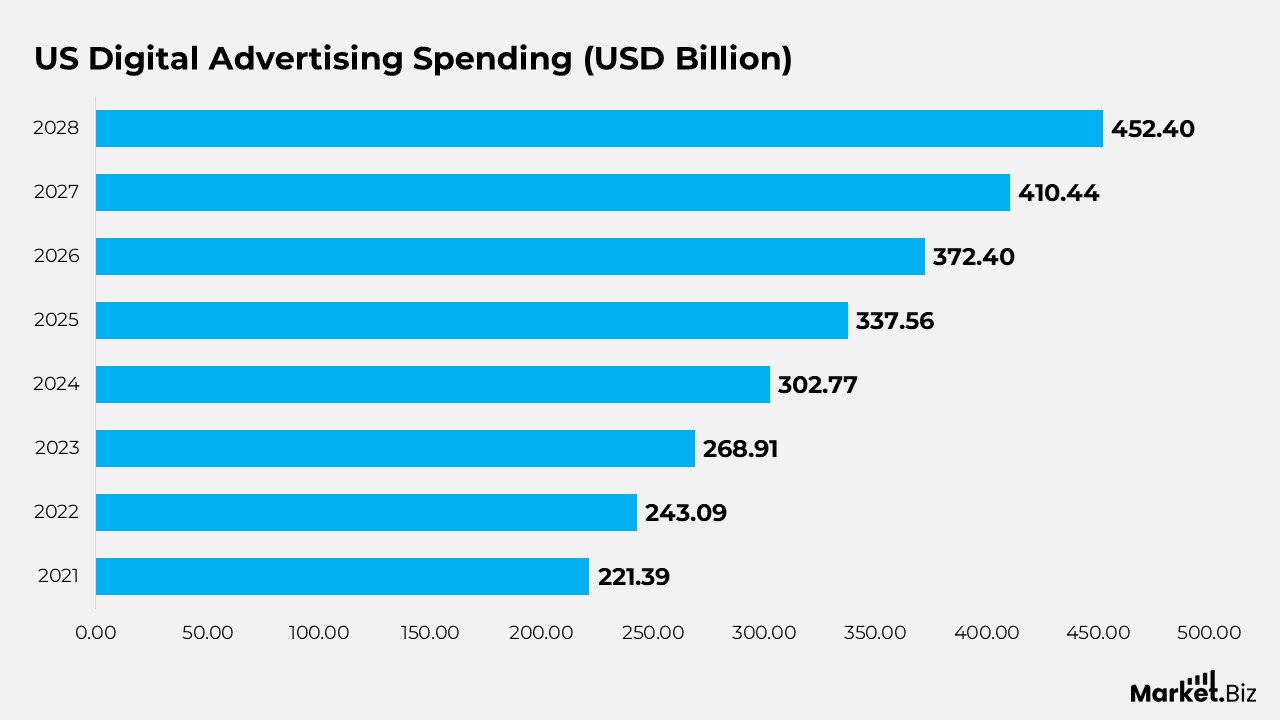
Growth of Digital Advertising Spend in the United States
- Digital advertising spending in the United States totalled USD 221.39 billion in 2021, reflecting a strong shift by brands toward online channels.
- In 2022, spending increased to USD 243.09 billion, driven by higher investments in social media, search, and video advertising.
- The market continued its upward trend in 2023, with digital ad expenditure reaching USD 268.91 billion as businesses expanded digital-first strategies.
- By 2024, spending rose further to USD 302.77 billion, supported by the growing use of data-driven, performance-based advertising models.
- Digital advertising outlays climbed to USD 337.56 billion in 2025, highlighting sustained confidence in digital platforms for audience reach.
- In 2026, spending is projected to touch USD 372.4 billion, reflecting increased adoption of advanced targeting and automation tools.
- The market is expected to reach USD 410.44 billion in 2027, driven by continued growth in mobile and connected media advertising.
- By 2028, US digital advertising spending is expected to reach USD 452.4 billion, underscoring the long-term dominance of digital channels in advertising budgets.
(Sources: Statista, Electro IQ)
How Brands Plan to Adjust Digital Media Spending
- In 2024, advanced TV and connected TV budgets are expected to rise, with 63% of marketers planning a slight increase and 22% indicating a significant increase, while only 1% anticipate a major cut.
- Moreover, digital video continues to attract higher spending: 63% expect a slight increase, and 20% plan a stronger budget expansion. Showing sustained confidence in video formats.
- Paid social media budgets show moderate optimism: 52% forecast slight growth, 14% a notable increase, and 7% a small decline.
- Digital out-of-home advertising remains stable, with 51% of respondents planning slight budget increases and 29% planning to maintain spending at 2023 levels.
- Digital audio sees cautious growth, led by 60% expecting slight increases, though 31% plan to keep budgets unchanged, and 6% foresee minor reductions.
- Retail media stands out for strong momentum, with 35% planning slight increases and 25% expecting significant budget growth. Reflecting rising advertiser interest in point-of-sale channels.
- Influencer marketing sends mixed signals: 42% expect slight growth, 32% plan no change, and 11% anticipate modest budget cuts.
- Paid search budgets lean toward stability, with 44% expecting slight increases and 42% maintaining current spending levels.
- Digital display advertising reflects caution, as 50% plan to hold budgets steady, while 31% expect slight increases and 13% anticipate reductions.
- Further, gaming, metaverse, and esports budgets remain conservative, with 50% maintaining current spend and 33% planning modest increases.
- In app advertising budgets show resilience, with 29% expecting slight growth and 57% maintaining existing budgets despite 9% anticipating small declines.
(Sources: Statista, Electro IQ)
Quarterly Distribution of XR Headset Shipments by Vendor Worldwide
- Meta steadily strengthened its position in the XR headset market over the period, growing from 34% in Q1 2020 to a peak of 87% in Q4 2022, demonstrating strong dominance in multiple quarters.
- In 2020, the market appeared more fragmented, with Meta holding around 29% to 34%, while other vendors together accounted for more than 50%, indicating early-stage competition.
- Sony’s presence became more visible in 2023, capturing 33% in Q1 2023 and remaining close to 29%-30% in the following quarters, driven by renewed interest in console-based XR experiences.
- Pico showed moderate but consistent participation, generally ranging between 6% and 15%, reflecting stable demand in select regions and enterprise use cases.
- HTC maintained a relatively small but steady share, mostly below 3%, suggesting a niche focus rather than mass-market expansion.
- Xreal and DPVR contributed marginal shipment volumes, typically below 5%, highlighting their limited scale compared to leading vendors.
- Moreover, the “Others” category declined over time, dropping from above 50% in early 2020 to below 20% in most 2022 and 2023 quarters, signaling market consolidation around major brands.
(Sources: Statista, Electro IQ)
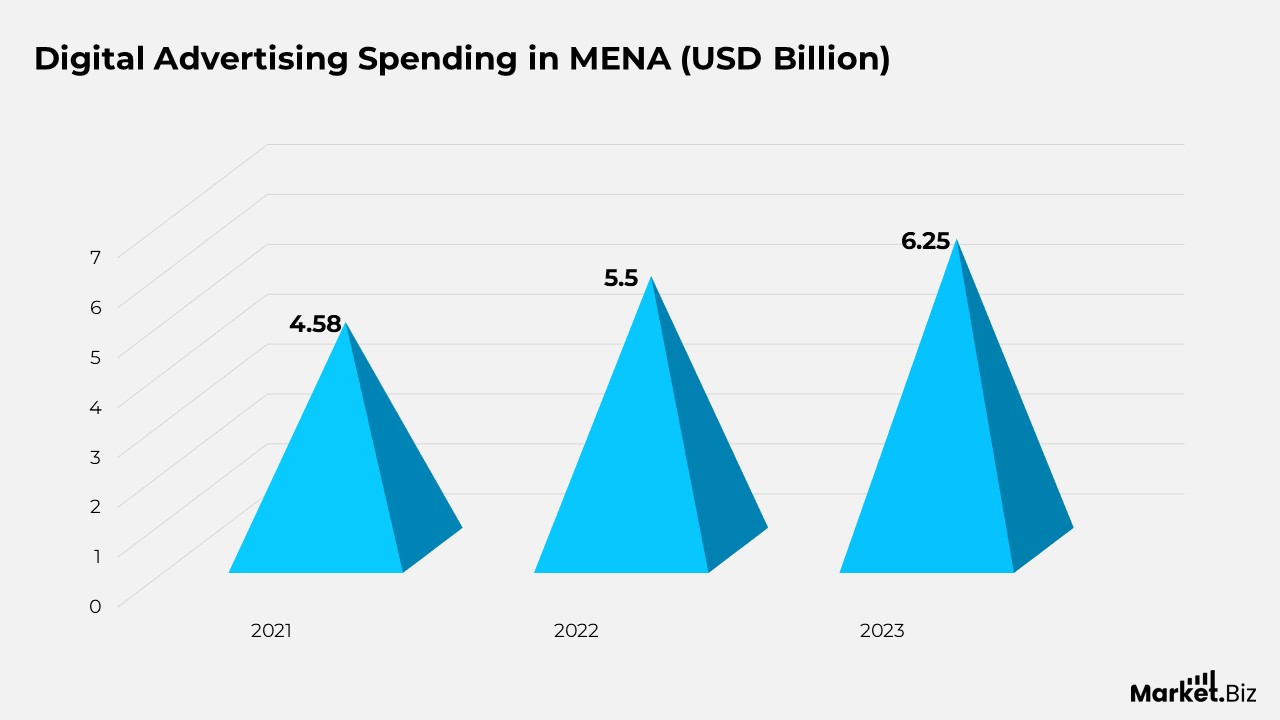
Rising Digital Ad Spending Across the Middle East and North Africa
- Digital advertising spending in the Middle East and North Africa reached USD 4.58 billion in 2021, reflecting early momentum in the adoption of online and mobile advertising across the region.
- In 2022, ad spending increased to USD 5.5 billion, supported by higher brand investment in social media, search, and video platforms.
- By 2023, digital advertising expenditure rose further to USD 6.25 billion, reflecting steady year-on-year growth as businesses expanded their digital presence and customer engagement efforts.
(Sources: Statista, Electro IQ)
How Digital Advertising Budgets Are Split Across Formats in Europe
- Further, display advertising accounted for the largest share of digital ad spending in Europe in 2023, reaching €48.3 billion, as brands continued to invest heavily in visual and programmatic campaigns.
- Search advertising followed closely, with spending of €41.7 billion, driven by strong demand for performance-based and intent-focused marketing strategies.
- Classified and directory advertising remained a smaller segment, generating €6.8 billion, reflecting its more niche role compared with display and search formats.
(Sources: Statista, Electro IQ)
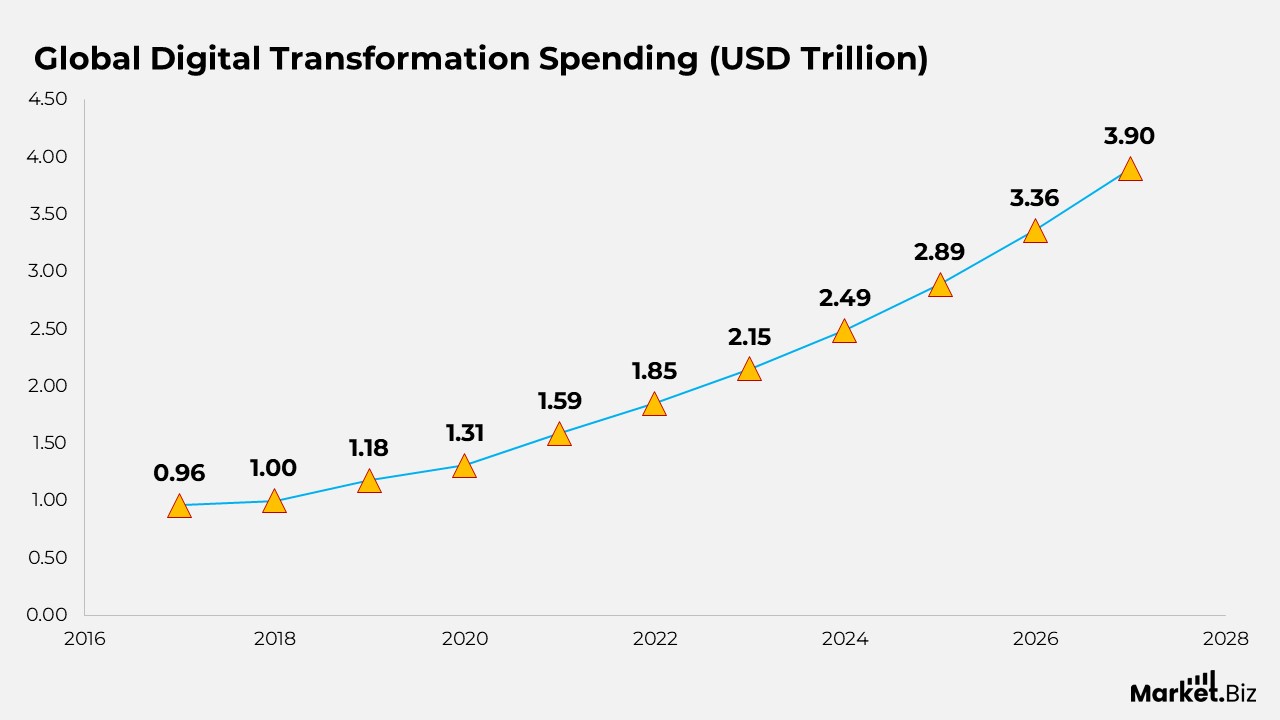
Global Spending Trends on Digital Transformation Technologies
- Global spending on digital transformation technologies and services reached USD 0.96 trillion in 2017, marking the early phase of large-scale enterprise digitisation efforts.
- In 2018, spending crossed USD 1 trillion, reflecting growing confidence among organizations in cloud computing and digital infrastructure upgrades.
- By 2019, investment increased to USD 1.18 trillion, supported by the wider adoption of data analytics, automation, and digital customer platforms.
- Digital transformation spending rose further to USD 1.31 trillion in 2020, as businesses accelerated technology adoption to maintain operational continuity.
- In 2021, global expenditure expanded to USD 1.59 trillion, driven by long-term digital strategies across industries.
- Spending reached USD 1.85 trillion in 2022, highlighting continued focus on scalability, resilience, and digital efficiency.
- By 2023, investments climbed to USD 2.15 trillion, reflecting deeper integration of AI-driven and cloud-based solutions.
- In 2024, global digital transformation spending stood at USD 2.49 trillion, supported by enterprise-wide modernisation programs.
- Expenditure increased to USD 2.89 trillion in 2025, as organizations prioritized automation and advanced digital services.
- Spending reached USD 3.36 trillion in 2026, showing sustained momentum across both developed and emerging markets.
- By 2027, global investment in digital transformation technologies and services is projected to reach USD 3.9 trillion, underscoring the central role of digital initiatives in long-term business growth.
(Sources: Statista, Electro IQ)
Global Digital Music Revenue Trends Over Time
- Global digital music revenue stood at USD 0.4 billion in 2004, reflecting the early stage of paid digital music adoption.
- Revenue increased steadily to USD 2.0 billion by 2006, driven by the growing use of digital downloads and online music platforms.
- Between 2007 and 2009, revenue rose from USD 2.7 billion to USD 3.7 billion as consumers increasingly shifted away from physical formats.
- Further, digital music earnings continued to climb, reaching USD 4.2 billion in 2011 and peaking at USD 4.4 billion in 2012, marking the strongest period for download-based revenue.
- After 2013, revenue began to decline, falling from USD 4.3 billion to USD 3.7 billion by 2015 as consumer behaviour changed.
- The downward trend continued through 2016 and 2017, with revenue decreasing from USD 3.2 billion to USD 2.6 billion.
- From 2018 onward, global digital music revenue dropped more sharply, reaching USD 1.7 billion in 2018 and USD 1.2 billion in 2020.
- By 2021 and 2022, revenue stabilized at around USD 0.9 billion, reflecting the reduced role of traditional digital sales as streaming became dominant.
(Sources: Statista, Electro IQ)
Top Digital Ad Selling Companies by Advertising Revenue Worldwide
- Google led the global digital advertising market in 2024, generating USD 190.5 billion in ad revenue, reflecting its dominant position in search and display advertising.
- Meta followed closely with advertising revenue of USD 146.3 billion, driven by strong demand across its social media and video advertising platforms.
- Amazon recorded USD 52.7 billion in ad revenue, highlighting the growing importance of retail media and sponsored product listings.
- ByteDance generated USD 39.9 billion in advertising revenue, supported by global expansion and high engagement on short-form video platforms.
(Sources: Statista, Electro IQ)
Global Digital Advertising Spend Growth Over Time
- Global digital advertising expenditure reached USD 108.47 billion in 2014, reflecting the early acceleration of online marketing adoption worldwide.
- Spending increased steadily to USD 131.67 billion in 2015 and USD 155.18 billion in 2016, driven by the growing use of mobile and social media advertising.
- By 2017, global digital ad spending rose to USD 187.2 billion, highlighting stronger brand reliance on digital channels.
- Moreover, expenditure expanded further to USD 218.28 billion in 2018 and USD 244.67 billion in 2019, supported by advances in data-driven advertising and automation.
- In 2020, digital advertising spending reached USD 257.51 billion, as businesses shifted budgets toward online platforms.
- A sharp increase followed in 2021, with expenditure jumping to USD 340.67 billion, reflecting accelerated digital engagement across industries.
- Moreover, spending continued to grow in 2022 and 2023, reaching USD 390.9 billion and USD 415.5 billion, respectively.
- In 2024, global digital ad expenditure reached USD 442.6 billion, demonstrating sustained momentum in digital marketing investments.
- Further, spending is projected to rise further to USD 470 billion in 2025 and USD 499.7 billion by 2026, underscoring the long-term dominance of digital advertising in global media budgets.
(Sources: Statista, Electro IQ)
Top Digital Payment Platforms by Brand Awareness in the UK
- PayPal ranked as the most recognized digital payment brand in the UK in 2023, with brand awareness reaching 96%. Reflecting its long-standing presence and broad acceptance.
- Barclays followed closely, achieving 88% awareness, supported by its strong domestic banking footprint and digital services.
- Apple Pay recorded 87% brand awareness, driven by widespread iPhone usage and seamless integration across Apple devices.
- Google Pay reached 80% awareness, benefiting from Android adoption and integration with Google Wallet.
- Klarna achieved 78% recognition, reflecting strong visibility in online shopping and flexible payment offerings.
- Amazon Pay posted 77% awareness, supported by Amazon’s extensive ecommerce ecosystem.
- Visa Checkout registered 72% brand awareness, highlighting trust in established card-based digital payments.
- Clearpay reached 66% awareness, showing growing consumer familiarity with instalment-based payments.
- Samsung Pay stood at 60%, reflecting moderate visibility tied to Samsung device users.
- Masterpass recorded 45% awareness, indicating lower consumer exposure than leading wallets.
- Fitbit Pay achieved 27% awareness, reflecting its niche use within wearable technology.
- Skrill reached 24% brand recognition, supported mainly by specific online payment use cases.
- BitPay recorded 22% awareness, showing limited mainstream recognition of crypto-based payments.
- Garmin Pay and Trustly both stood at 21%, reflecting niche but stable awareness levels.
- AstroPay and NETELLER recorded the lowest awareness at 17%, indicating limited penetration in the UK market.
(Sources: Statista, Electro IQ)
Retail Media Ad Revenue Performance of E-Commerce Platforms in Latin America
- Mercado Libre dominated digital retail media advertising in Latin America in 2023. Generating USD 625.33 million, far surpassing all other platforms due to its scale and advertiser reach.
- Amazon.com.br ranked second with advertising revenue of USD 132.22 million. Reflecting strong brand presence and growing retail media adoption in Brazil.
- Magazine Luiza recorded USD 110.67 million, supported by its expanding digital marketplace and omnichannel retail strategy.
- Amazon.com.mx generated USD 104.3 million, highlighting steady advertiser demand within Mexico’s online retail ecosystem.
- Americanas achieved USD 103.19 million in retail media ad revenue, showing continued advertiser interest despite competitive pressure.
- Falabella reported USD 24.66 million, reflecting a more regional and selective advertising footprint.
- Cencosud and its Paris.cl platform generated USD 19.88 million, indicating moderate retail media activity.
- Walmart.com.mx posted USD 16.65 million, supported by its strong physical retail base as it transitions into digital advertising.
- Carrefour.com.br recorded USD 12.39 million in revenue, showing gradual growth in retail media monetisation.
- Raia Drogasil generated USD 5.83 million, reflecting niche advertising demand within health and pharmacy retail.
- Linio achieved USD 5.18 million in revenue, indicating limited but stable retail media adoption.
- Éxito and Sodimac recorded USD 3.65 million and USD 3.32 million, respectively, reflecting smaller-scale ad operations.
- Carrefour.com.ar reported the lowest figure at USD 2.14 million, suggesting early-stage development of retail media.
(Sources: Statista, Electro IQ)
Conclusion
Digital twin statistics indicate that the technology is steadily evolving from a testing concept into a practical solution with real-world impact. The data points to growing adoption across sectors such as manufacturing, real estate, healthcare, smart infrastructure, and urban planning, driven by wider use of IoT data, cloud computing, and advanced analytics.
Although many organizations remain in the evaluation or pilot phase, the increasing move toward active implementation reflects rising trust in digital twins for performance monitoring, scenario testing, and predictive insights. Overall, the statistics suggest that digital twins are becoming an essential part of data-driven strategies to improve operational efficiency, minimise risk, and support long-term decision-making.
FAQ’s
A digital twin is a virtual model of a physical object, system, or process that reflects real-world behaviour using live or historical data. It allows organizations to analyze performance, simulate conditions, and predict outcomes without directly interacting with the physical asset.
Digital twin statistics help show how widely the technology is being adopted, where it is being used, and what impact it is having. These insights support a better understanding of industry trends, adoption stages, and the real value digital twins deliver.
Digital twins are commonly applied in manufacturing, healthcare, real estate, energy, automotive, smart cities, and infrastructure management. Their use continues to expand as organizations rely more on data-driven planning and operational optimization.
Digital twins are supported by technologies such as IoT sensors, cloud platforms, data analytics, artificial intelligence, and simulation tools. Together, these technologies enable accurate modeling, real-time updates, and predictive insights.
Digital twins help organizations improve efficiency, reduce downtime, manage risks, and plan future actions more effectively. By enabling virtual testing and continuous monitoring, they support informed decision-making without disrupting real-world operations.