Introduction
Electric Vehicle Charging Infrastructure Statistics: The growth of electric vehicle (EV) charging infrastructure has become a defining measure of global readiness for large-scale electrification.
As EV ownership rises worldwide, the demand for accessible, efficient, and widespread charging networks has intensified, prompting accelerated investment from both public and private sectors. In the past few years, charging deployment has expanded at unprecedented rates, reshaping transportation systems and supporting the transition away from combustion-engine vehicles.
These statistics help illustrate regional progress, highlight disparities in charger availability, and reveal how quickly fast and ultra-fast technologies are being adopted. Collectively, EV charging infrastructure data provides a clear snapshot of how well different markets are equipping themselves to accommodate millions of current and future electric vehicles.
Editor’s Choice
- Public EV charging stations have more than doubled since 2022, surpassing 5 million units worldwide.
- In 2024, over 1.3 million new public chargers were installed, marking a 30% year-on-year increase.
- The number of chargers added in 2024 alone matches the entire global stock available in 2020.
- China has contributed nearly two-thirds of all public charger growth since 2020.
- China hosts about 65% of the world’s public charging stations and supports 60% of the world’s electric light-duty vehicles.
- Europe expanded its public charging network by more than 35% in 2024, bringing the total to more than 1 million chargers.
- Charger installations in 11 out of 27 EU countries rose by more than 50% in 2024.
- By the end of 2024, the Netherlands deployed over 180,000 public chargers, Germany 160,000, and France 155,000.
- Austria added approximately 8,000 chargers in 2024, held by a subsidy that ended in 2025.
Moreover
- AFIR mandates require 150 kW charging stations every 60 km by 2025, with station capacity increasing from 400 kW to 600 kW by 2027.
- In the United States, public charger installations grew 20% in 2024, reaching nearly 200,000 units.
- Of the USD 5 billion allocated for the national fast-charging rollout, only USD 30 million had been spent by the end of 2024.
- India added close to 40,000 chargers in 2024, maintained by an allocation of INR 20 billion (USD 240 million) under the PM E-DRIVE program.
- Brazil surpassed 12,000 public chargers by December 2024.
- Public charging points increased by 60% in Colombia and 20% in Mexico since 2022.
- Indonesia, Thailand, Malaysia and Viet Nam collectively reached over 24,000 chargers, marking a 9× increase since 2022.
- China now provides more than 1 public charger for every 10 electric cars.
- The EU averages 1 charger for every 13 electric cars, improving availability by over 10%.
- Global fast-charging stock reached 2 million units in 2024, while ultra-fast chargers grew 50%, accounting for nearly 10% of all fast chargers.
- Ultra-fast charger costs dropped 20% between 2022 and 2024.
- EUR 4 billion to increase ultra-fast chargers from 17,000 to 40,000 by 2028.
Global Expansion of Public EV Charging Infrastructure
- Global public charging stations have expanded rapidly, doubling since 2022 and now exceeding 5 million units worldwide.
- In 2024, more than 1.3 million additional public chargers were installed, representing a robust 30% increase over the previous year.
- The number of chargers added in 2024 alone equals the entire global stock of 2020, highlighting an exceptional pace of deployment.
- China has contributed to nearly two-thirds of all public charger growth since 2020, reinforcing its leadership in global EV infrastructure.
- China hosts about 65% of the world’s public chargers and supports 60% of electric light-duty vehicles globally, emphasizing its dominant market position.
- Public charging infrastructure in Europe expanded strongly, growing by over 35% in 2024, pushing the regional total to slightly above 1 million chargers.
- Growth across EU nations varied significantly, with 11 of the 27 member countries recording increases of more than 50% in their public charging stock during 2024.
- By the end of 2024, the Netherlands led Europe with more than 180,000 public chargers, followed by Germany with 160,000 and France with 155,000.
- Austria added approximately 8,000 public charging points in 2024, largely supported by a subsidy scheme that concluded in early 2025.
- The EU’s Alternative Fuels Infrastructure Regulation (AFIR) is set to accelerate charger deployment, requiring 150 kW fast-charging stations every 60 km on major TEN-T routes by 2025, with mandated station power increasing from 400 kW to 600 kW by 2027.
Moreover
- Additional growth is expected through the revised Energy Performance in Buildings Directive, which mandates pre-cabling in residential and commercial buildings to reduce future retrofitting expenses.
- In the United States, public charging installations rose by 20% in 2024, bringing the total to nearly 200,000 chargers nationwide.
- Although the National EV Infrastructure Program earmarked USD 5 billion for the rollout of fast chargers, only USD 30 million had been utilised by the end of 2024, reflecting slow progress.
- In January 2025, Executive Order 14154 halted further disbursement of these funds pending a federal-level review, creating uncertainty around the rollout timeline.
- India continued expanding its EV charging ecosystem, adding close to 40,000 public chargers during 2024.
- Under the PM E-DRIVE initiative, the government allocated INR 20 billion (about USD 240 million) in October 2024 to strengthen charging infrastructure across major cities and high-traffic transport corridors.
- Brazil’s charging network expanded rapidly, surpassing 12,000 public charging points by December 2024.
- Public charger installations rose sharply in emerging markets, with Colombia up 60% and Mexico up 20% since 2022.
Further
- Across Indonesia, Thailand, Malaysia and Viet Nam, public chargers exceeded 24,000 units in 2024, marking a 9× increase from 2022.
- China now maintains more than 1 public charger for every 10 electric cars, indicating strong charging accessibility.
- The European Union averages 1 charger for every 13 electric cars, improving charger availability by over 10% compared to 2023.
- Global fast-charging stock reached 2 million units in 2024, while ultra-fast chargers grew by 50%, now representing nearly 10% of all fast chargers.
- The cost of ultra-fast chargers decreased by 20% between 2022 and 2024.
- China accounted for 80% of global fast-charging expansion, increasing its fast chargers from 1.2 million in 2023 to 1.6 million in 2024, achieving over 3 kW of public charging capacity per electric LDV.
- The United States increased its fast-charger stock from 40,000 in 2023 to over 50,000 in 2024, but public charging capacity remains below 1.5 kW per EV \
- The European Union expanded fast chargers by nearly 50%, reaching 71,000 in 2024, while ultra-fast chargers grew 60% to more than 77,000 units.
- Denmark, France, Finland and Germany recorded ultra-fast charger growth of 70–95% in 2024.
- France’s “Charge France” initiative plans to invest EUR 4 billion to expand ultra-fast chargers from 17,000 to 40,000 by 2028.
- About 20% of EU ultra-fast chargers now deliver 350 kW or more, with installations of this segment nearly doubling in 2024.
(Source: International Energy Agency)
Global Number of Electric Charging Stations
- By the end of 2022, the world recorded an estimated 2.8 million publicly accessible EV charging stations, a significant jump from 1.77 million in 2021, reflecting rapid infrastructure growth.
- Global charging infrastructure consists primarily of slow and fast chargers; Europe ranked second globally for slow chargers in 2022, reaching 460,000, marking a 50% rise from 2021.
- Within Europe, the Netherlands led with 117,000 slow chargers, followed by France at 74,000 and Germany at 64,000. Fast-charging installations in Europe exceeded 70,000 units by late 2022, growing nearly 55% year-on-year.
- Germany led fast-charging deployment with around 12,000 units, while France hosted about 9,700 and Norway approximately 9,000.
- In 2015, China operated around 67,000 public chargers, Europe had about 59,000, the United States had roughly 32,000, and other countries held close to 26,000.
- By 2016, China and Europe saw steady expansion, while the U.S. and other global markets recorded moderate increases in public charger deployment.
- In 2017, China’s public charging network rose sharply, widening the gap between its infrastructure and that of Europe, the U.S., and other regions.
- By 2021, China reached an exceptional 1,147,000 public chargers, far ahead of Europe at 356,000, other countries at 160,000, and the U.S. at 114,000.
(Source: KORE Wireless)
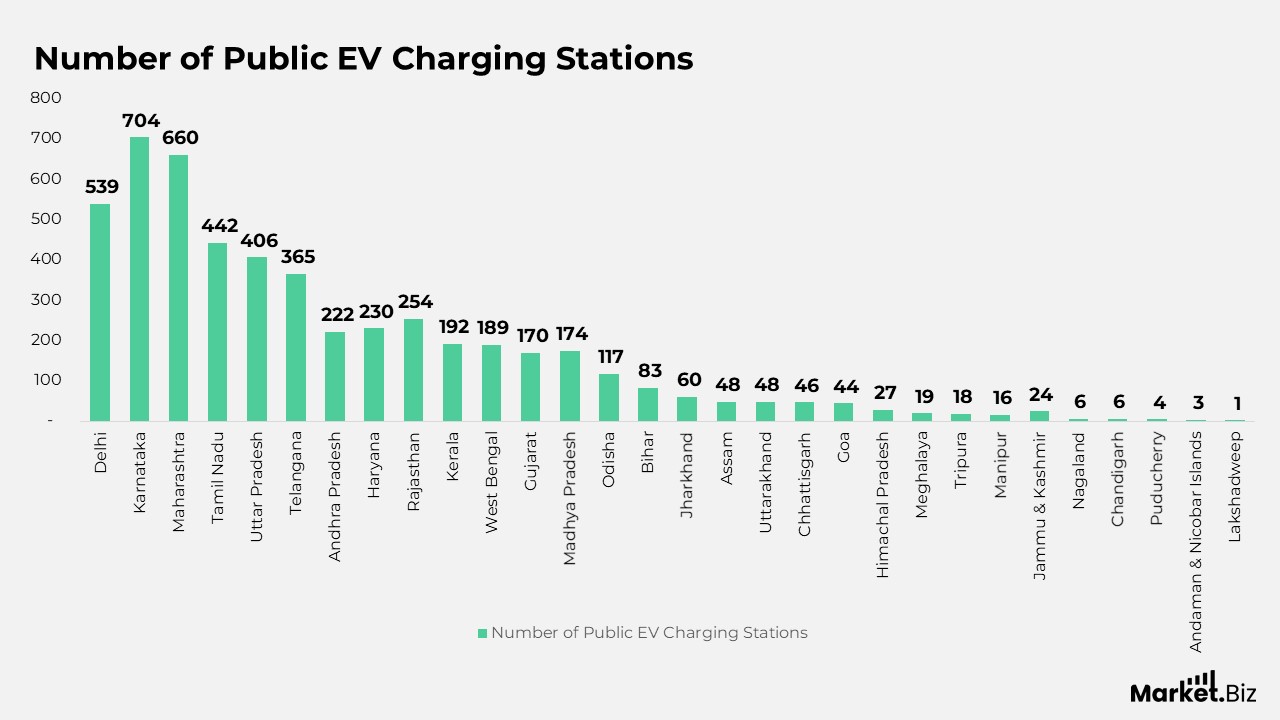
Public EV Charging Stations in India
- Delhi hosts 539 public EV charging stations, making it one of the most developed EV hubs in the country.
- Karnataka leads with 704 chargers, supported by strong EV adoption in Bengaluru.
- Maharashtra operates 660 charging stations across major cities and highways.
- Tamil Nadu has 442 charging stations, driven by its growing EV manufacturing ecosystem.
- Uttar Pradesh has 406 stations, indicating rapid expansion of EV infrastructure.
- Telangana provides 365 public charging points across the state.
- Andhra Pradesh has 222 charging stations, improving intercity EV connectivity.
- Haryana operates 230 stations, boosted by its proximity to the NCR region.
- Rajasthan records 254 chargers distributed across key districts.
- Kerala maintains 192 public charging stations throughout the state.
- West Bengal operates 189 chargers, reflecting steady EV adoption.
- Gujarat has 170 public charging stations in its rapidly growing EV market.
- Madhya Pradesh offers 174 charging points across multiple cities.
- Odisha has 117 chargers supporting early-stage EV adoption.
- Bihar operates 83 public charging stations in major zones.
- Jharkhand has 60 charging stations across its developing EV corridors.
- Assam provides 48 public charging stations.
- Uttarakhand also maintains 48 chargers across urban and semi-urban areas.
- Chhattisgarh supports 46 public charging stations.
- Goa operates 44 chargers, aligned with its tourism-driven transport needs.
- Himachal Pradesh has 27 public charging stations.
- Meghalaya has 19 chargers, while Tripura has 18.
- Manipur hosts 16 charging stations as part of its emerging EV network.
- Jammu & Kashmir operates 24 chargers across key routes.
- Nagaland has 6 public chargers, similar to Chandigarh, with 6 as well.
- Puducherry has 4 public charging points.
- The Andaman & Nicobar Islands operate 3 chargers.
- Lakshadweep has 1 public charging station, marking the early stage of EV infrastructure development.
(Source: Griden Technologies Pvt. Ltd.)
EV AC–DC Charging Mix Trends Across Major Markets
- In China, the share of DC chargers increased from 44% in 2022 to 52% in 2024, indicating a consistent shift toward faster charging, while AC chargers decreased from 56% to 48% over the same period.
- Europe maintained a strong preference for AC chargers, though the share of DC units gradually increased from 13% in 2022 to 19% in 2024, with AC remaining dominant at 81% by 2024.
- The United States saw DC charging adoption rise from 19% in 2022 to 24% in 2024, while AC charger share declined from 81% to 76%, reflecting a moderate but steady transition toward faster charging networks.
- China remains the largest and fastest mover toward high-power DC charging. At the same time, Europe and the U.S. continue to rely heavily on AC charging but are gradually increasing DC deployment each year.
- By 2024, all 3 markets showed upward momentum in DC charger share, signaling a global advancement toward faster, long-distance-friendly charging solutions.
- The global stock of public DC chargers surged from 708,000 in 2022 to nearly 2 million in 2024, reflecting an impressive 66% CAGR.
- China recorded the largest growth, expanding its DC charger network from 560,000 in 2022 to 1.53 million in 2024, achieving a 65% CAGR.
- Europe also saw significant progress, with public DC chargers rising from 77,000 in 2022 to 198,000 in 2024, marking a 60% CAGR.
- The United States experienced moderate expansion, increasing its DC charger stock from 28,000 in 2022 to 53,000 in 2024, corresponding to a 38% CAGR.
- By 2024, China accounted for 78% of the world’s public DC chargers, followed by Europe with 10% and the United States with 2.7%.
(Source: The International Council On Clean Transportation, ICCT Research Brief)
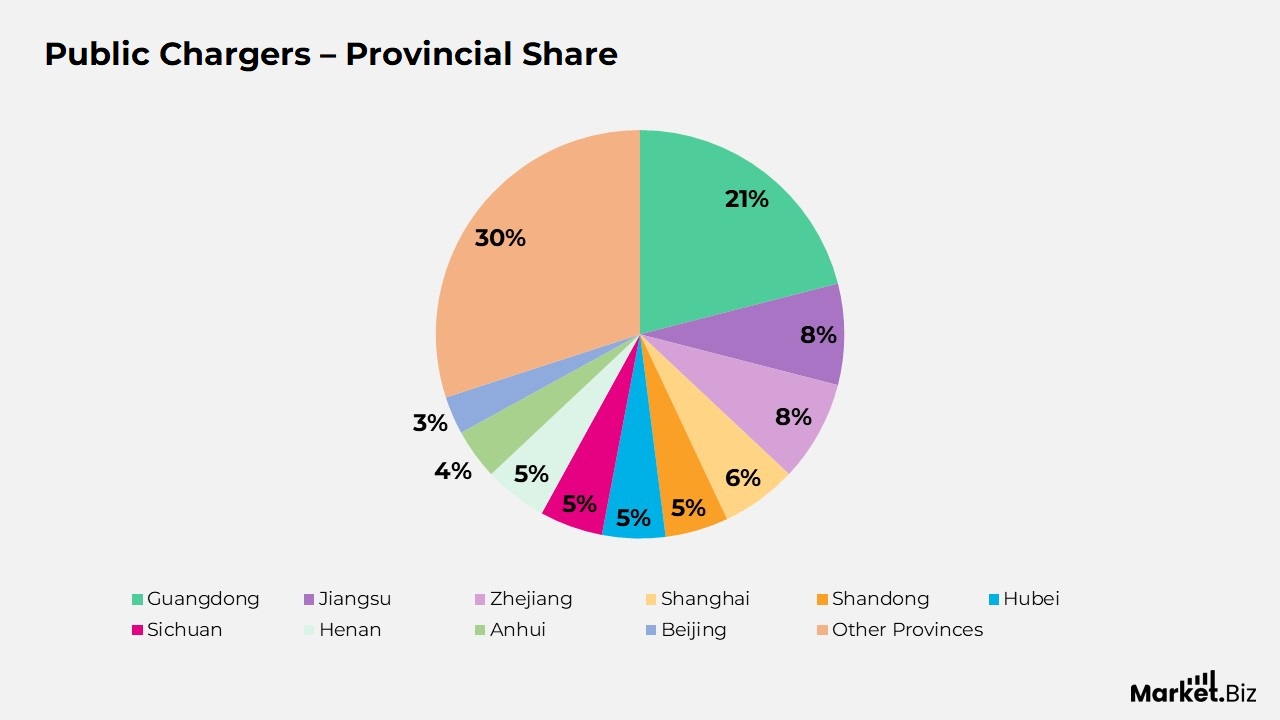
Provincial Distribution of Public and Public DC Chargers in China, 2024
Public Chargers – Provincial Share
- Guangdong holds 21% of China’s public chargers, the highest among all provinces.
- Jiangsu accounts for 8%, indicating strong regional infrastructure growth.
- Zhejiang also contributes 8%, reflecting steady charger deployment.
- Shanghai accounts for 6%, supported by dense urban EV use.
- Shandong follows with 5%, aligning with growing mobility demand.
- Hubei, Sichuan, and Henan each hold 5%, indicating balanced central-region expansion.
- Anhui contributes 4%, while Beijing accounts for 3%.
- Other provinces collectively make up 30% of the national public charging stock.
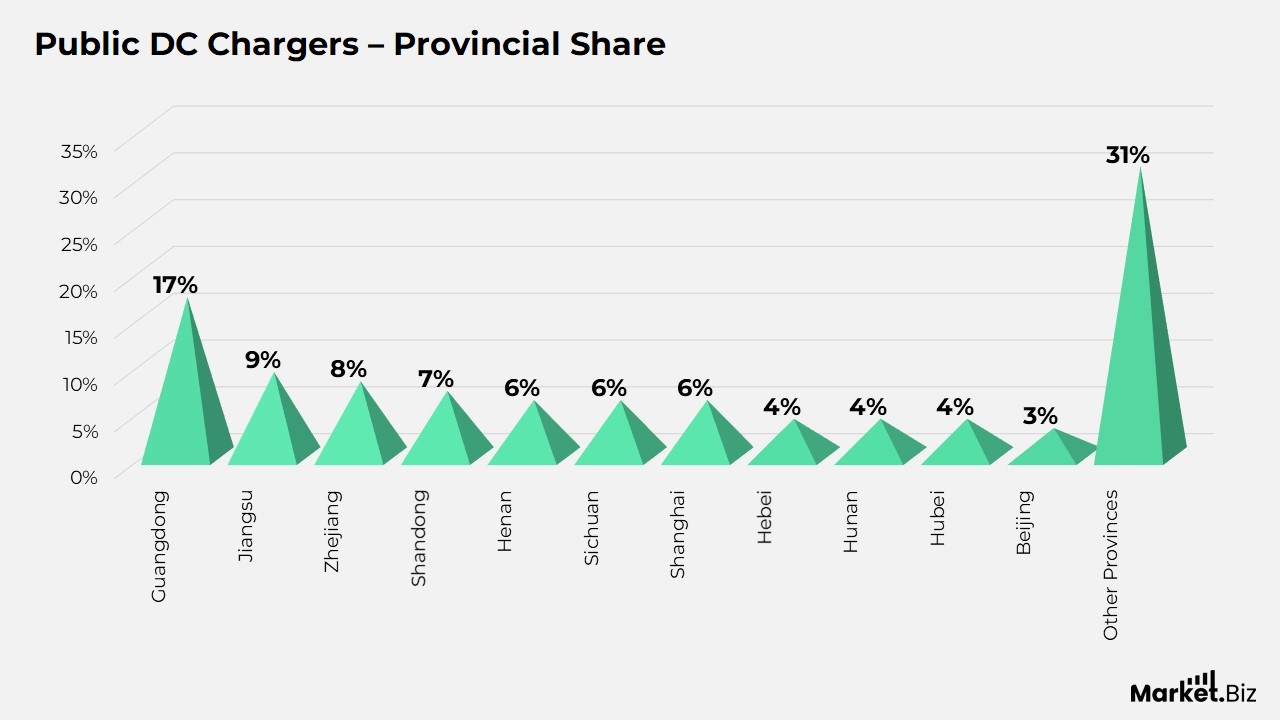
Public DC Chargers – Provincial Share (Right Chart)
- Guangdong leads with 17% of all DC chargers nationwide.
- Jiangsu makes up 9%, reflecting sustained infrastructure investment.
- Zhejiang accounts for 8% and maintains a strong position in fast-charging deployment.
- Shandong represents 7%, driven by rising EV penetration.
- Henan, Sichuan, and Shanghai each contribute 6%, showing consistent regional rollout.
- Hebei holds 4%, while Hunan and Hubei each contribute 4%.
- Beijing accounts for 3% of the DC charger share.
- The remaining provinces together account for 31% of total DC charger installations.
Share of Public and DC Chargers by Country in Europe, 2024
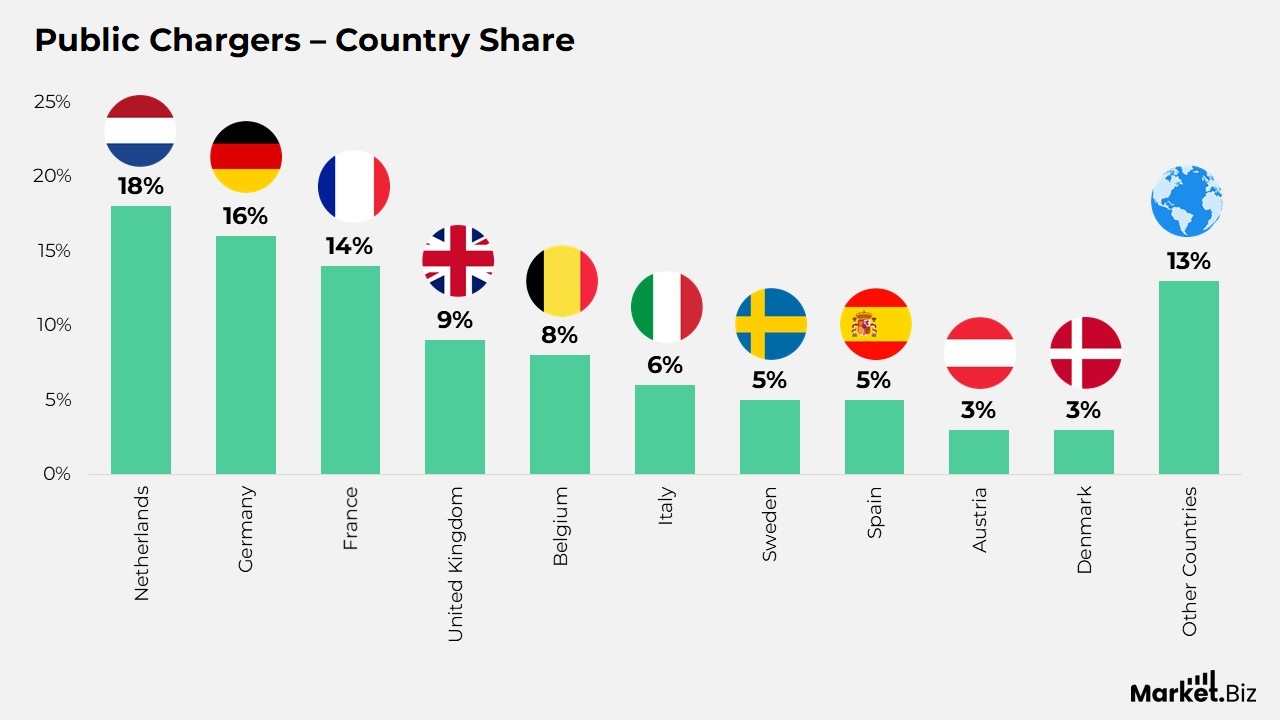
Public Chargers – Country Share (Left Chart)
- The Netherlands accounts for 18% of Europe’s public charging points, the largest share in the region.
- Germany follows with 16%, reflecting the strong nationwide expansion of charging.
- France contributes 14%, supported by wide deployment across cities and highways.
- The United Kingdom holds 9%, showing continued infrastructure scaling.
- Belgium represents 8%, while Italy accounts for 6%.
- Sweden captures 5%, indicating steady but moderate rollout.
- Spain holds 5%, demonstrating expanding EV adoption.
- Austria and Denmark each contribute 3% to the public charger network.
- All other countries collectively represent 13% of Europe’s public charging stock.
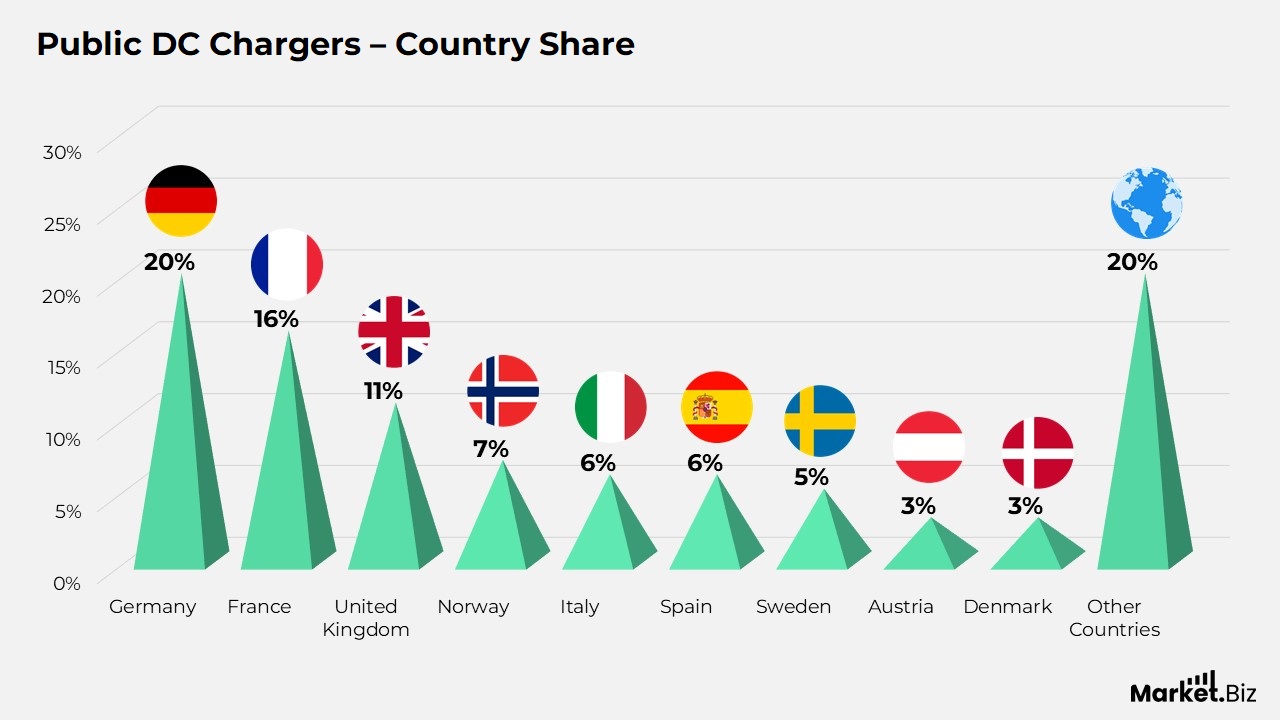
Public DC Chargers – Country Share
- Germany leads Europe in DC fast chargers, accounting for 20% of the total.
- France follows with 16%, reflecting strong investments in ultra-fast networks.
- The United Kingdom accounts for 11%, driven by motorway corridor installations.
- Norway holds 7%, consistent with its high EV penetration levels.
- Italy and Spain each contribute 6%, showing balanced adoption of fast charging.
- Sweden represents 5%, highlighting continued infrastructure strengthening.
- Austria and Denmark each make up 3% of the DC fast-charging distribution.
- The remaining European countries collectively account for 20% of total DC charger capacity.
Share of Public and DC Chargers by Country in the United States, 2024
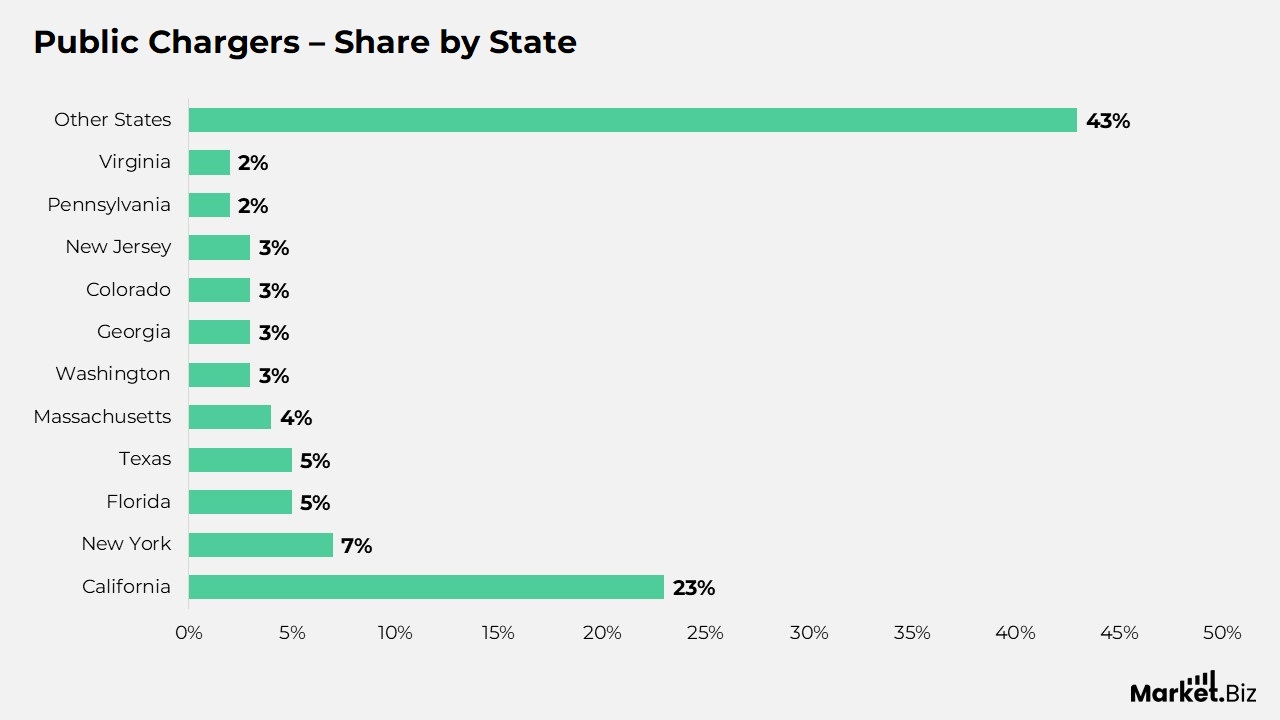
Public Chargers – Share by State
- California contributes 23% of all public charging points in the U.S., maintaining its lead in national EV infrastructure.
- New York accounts for 7%, reflecting strong urban charging expansion.
- Florida holds 5%, supported by rapid EV adoption across major cities.
- Texas represents 5%, indicating steady infrastructure growth.
- Massachusetts makes up 4%, driven by state-backed clean-mobility programs.
- Washington contributes 3%, aligning with its EV-friendly policies.
- Georgia, Colorado, and New Jersey each hold 3%, showing balanced infrastructure rollout.
- Pennsylvania and Virginia each represent 2% of the national public charger share.
- All remaining U.S. states account for 43% of public charging points.
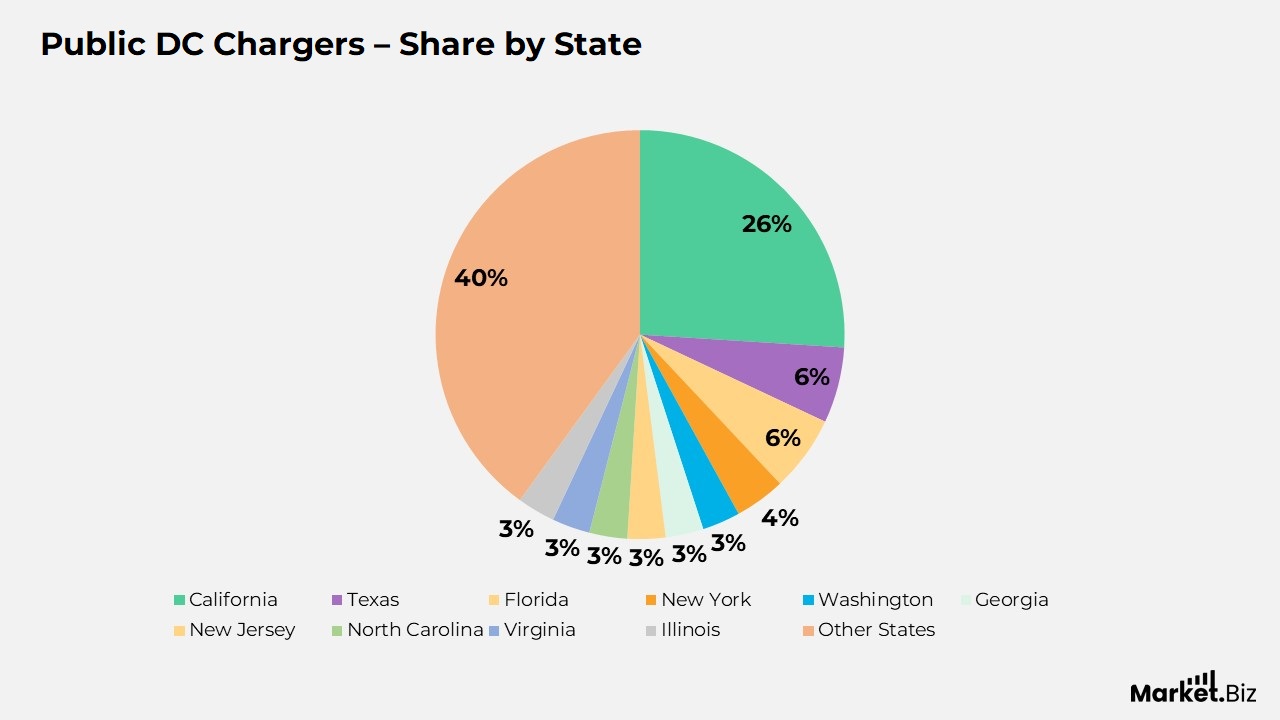
Public DC Chargers – Share by State (Right Chart)
- California strengthens its dominance, accounting for 26% of all U.S. DC fast chargers.
- Texas captures 6%, reflecting the expansion of long-distance EV travel corridors.
- Florida accounts for 6%, boosted by tourism-driven charging demand.
- New York contributes 4%, highlighting the ongoing growth of urban fast charging.
- Washington and Georgia each hold 3%, indicating rising regional adoption.
- New Jersey, North Carolina, and Virginia also contribute 3% each to the DC fast-charging market.
- Illinois follows with 3%, reflecting Midwest infrastructure progress.
- The remaining states together represent 40% of all DC fast chargers nationwide.
(Source: The International Council On Clean Transportation, ICCT Research Brief)
Conclusion
Electric Vehicle Charging Infrastructure Statistics: The rapid growth of electric vehicle charging infrastructure signals a major global transition toward cleaner and more sustainable transportation systems.
With installations rising sharply each year, public charging networks are evolving from limited early-stage availability to widespread coverage capable of supporting mass EV adoption. China continues to dominate global expansion, while Europe and the United States strengthen their networks through regulatory requirements, funding programs and coordinated infrastructure strategies.
Meanwhile, emerging economies across Asia and Latin America are accelerating deployment through policy incentives and strong private-sector participation. The increasing rollout of fast and ultra-fast chargers is improving charging convenience, reducing wait times and making long-distance EV travel more practical. At the same time, the changing ratio of EVs to available public chargers underscores the need for balanced growth to avoid future infrastructure strain.
Despite regional variations in scale and deployment speed, the overall global trend points to a clear commitment to building reliable, accessible and future-oriented charging networks. As EV adoption rises, continued policy support, technological progress and strategic planning will be crucial to sustaining infrastructure readiness and ensuring equitable access for all users.
FAQ’s
EV charging statistics offer insight into how prepared regions are for large-scale EV adoption. They help reveal whether charging availability is keeping pace with the growing number of electric vehicles on the road, indicating overall readiness for transport decarbonization.
Rapid increases in public charging installations generally mirror rising EV ownership and stronger government support. When charger deployment expands faster than vehicle growth, it signals an ecosystem capable of supporting long-term electrification.
Differences in charger density affect user convenience and adoption rates. Regions with higher urban density or fewer private parking spaces rely more on public charging, underscoring the critical role of infrastructure development in enabling EV accessibility.
This ratio reflects whether infrastructure is scaling adequately. A low ratio suggests sufficient availability. While a high ratio may indicate congestion at charging points, slower charging access and potential barriers to EV adoption.
Fast-charging deployment highlights advancements in charging technology and traveler convenience. Growth in high-power chargers shows that regions are preparing for long-distance travel needs and reducing dependence on slow, time-intensive charging.