
Introduction
Digital Currency Statistics: Digital currencies are rapidly redefining the global financial system, influencing how individuals and institutions manage money, transfer value, and participate in digital finance. As the presence of blockchain platforms, central bank digital currencies (CBDCs), stablecoins, and decentralised finance (DeFi) grows, adoption is rising across both consumer and enterprise segments.
Digital currency statistics offer a clear view of this evolution, revealing patterns in usage, transaction activity, regulatory momentum, market expansion, and security challenges. These insights help organizations, regulators, and investors track shifting behaviors, assess risks, and identify new digital opportunities. As digital currency ecosystems continue to expand, the data highlights how digital money is reshaping payments, financial inclusion, and the broader economy.
Editor’s Choice
- Cryptocurrency ownership in the U.S. has nearly doubled since late 2021, with 28% of American adults, roughly 65 million people, holding digital assets in 2025.
- Around 14% of non-owners plan to purchase cryptocurrency in 2025, while 67% of existing holders intend to increase their investments this year.
- Among individuals planning to buy crypto in 2025, the most preferred choices are Bitcoin, Ethereum, and Dogecoin.
- About 60% of adults familiar with crypto expect its value to rise during Donald Trump’s second presidential term, and 46% believe he will help expand mainstream adoption in the U.S.
- Despite growing interest, 40% of current crypto owners remain unsure about the technology’s safety and security.
- As of 2025, there are 17,151 cryptocurrencies in existence, although most hold minimal market relevance.
- Bitcoin and Ethereum together account for nearly 75% of the cryptocurrency market capitalization, underscoring how concentrated the market is.
- Bitcoin continues to stand as a high-cap digital asset in 2025, maintaining a market value exceeding $10 billion.
- There are 217 operational cryptocurrency exchanges worldwide in 2025.
- The total global cryptocurrency market capitalization has reached $2.96 trillion, demonstrating strong growth alongside ongoing volatility.
- Worldwide cryptocurrency revenue is projected to reach $45.3 billion in 2025, with an estimated 11.02% penetration rate by year-end.
- By 2025, more than 50% of all cryptocurrencies created to date will have failed or become inactive.
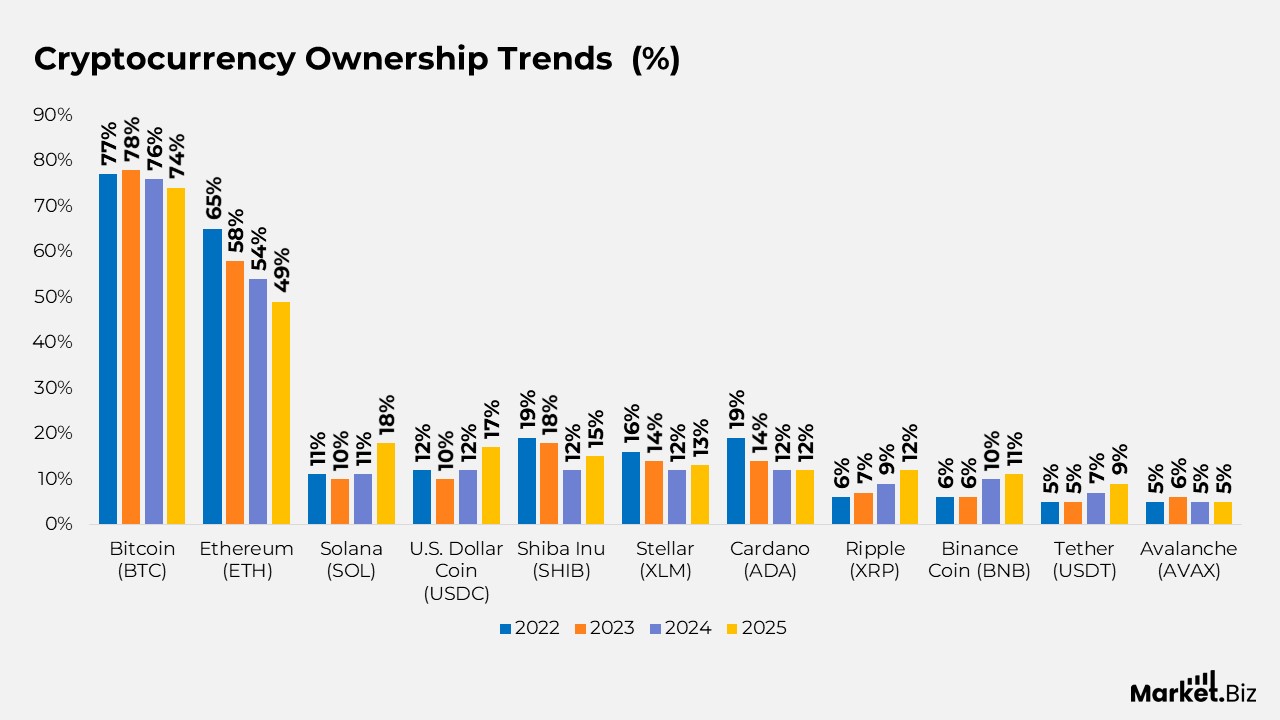
Leading Digital Currencies
- Ownership of Bitcoin (BTC) declined gradually, from 77% in 2022 to 78% in 2023, 76% in 2024, and 74% in 2025.
- Ethereum (ETH) saw a steady decrease in holders, dropping from 65% in 2022 to 58% in 2023, 54% in 2024, and 49% in 2025.
- Dogecoin (DOGE) gained traction later in the period, rising from 26% in 2024 to 31% in 2025.
- Solana (SOL) experienced upward momentum, increasing from 11% in 2022 to 10% in 2023, 11% in 2024, and reaching 18% in 2025.
- U.S. Dollar Coin (USDC) saw increased adoption, rising from 12% in 2022 to 10% in 2023, 12% in 2024, and 17% in 2025.
- Shiba Inu (SHIB) fluctuated over time, moving from 19% in 2022 to 18% in 2023, 12% in 2024, and rebounding to 15% in 2025.
- Stellar (XLM) saw a gradual decline, shifting from 16% in 2022 to 14% in 2023, 12% in 2024, and 13% in 2025.
- Cardano (ADA) consistently decreased, falling from 19% in 2022 to 14% in 2023, 12% in 2024, and staying at 12% in 2025.
- Ripple (XRP) showed improvement, rising from 6% in 2022 to 7% in 2023, 9% in 2024, and reaching 12% in 2025.
- Binance Coin (BNB) displayed steady growth, increasing from 6% in 2022 to 6% in 2023, 10% in 2024, and 11% in 2025.
- Tether (USDT) expanded gradually, moving from 5% in 2022 to 5% in 2023, 7% in 2024, and 9% in 2025.
- Avalanche (AVAX) remained stable throughout, recording at 5% in 2022, 6% in 2023, 5% in 2024, and 5% in 2025.
(Source: Security.org)
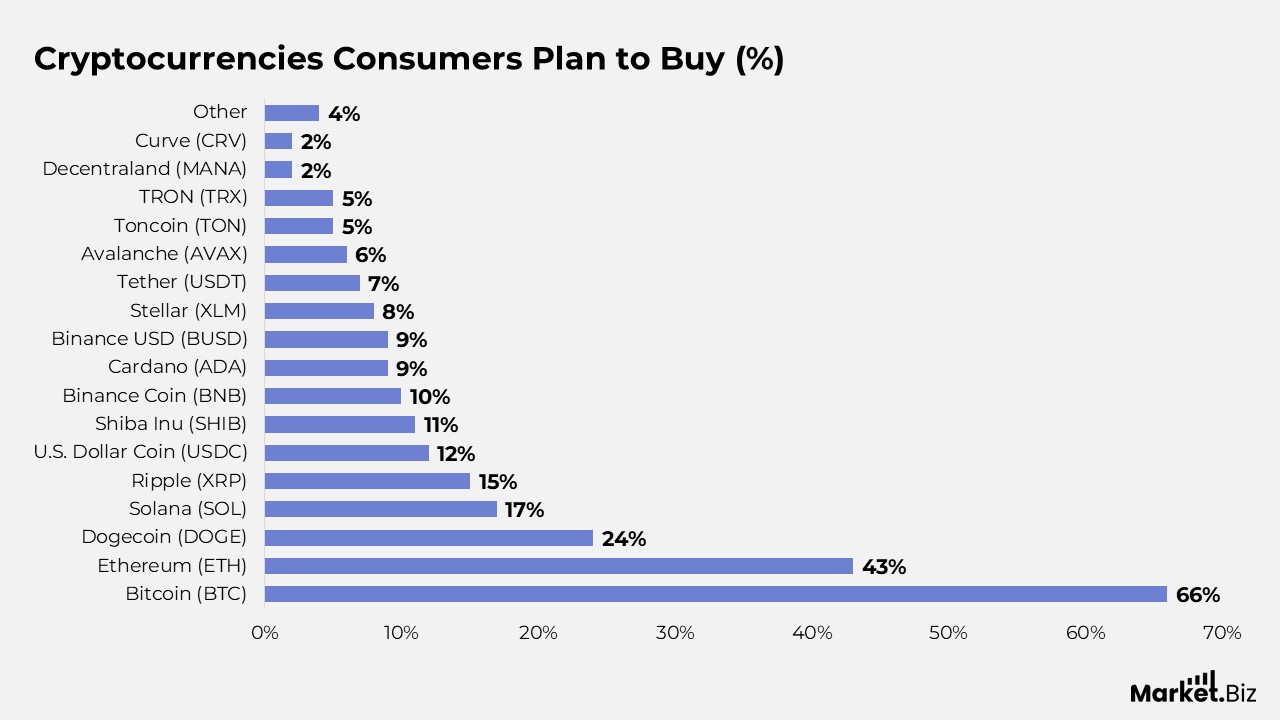
Top Cryptocurrencies Consumers Plan to Purchase
- 66% of respondents intend to buy Bitcoin (BTC), making it the most anticipated crypto purchase of 2025.
- 43% plan to invest in Ethereum (ETH), keeping it among the top preferred digital assets.
- 24% show interest in Dogecoin (DOGE), reflecting its continued mainstream popularity.
- 17% are considering buying Solana (SOL) this year.
- 15% plan to buy Ripple (XRP), indicating growing confidence in its market position.
- 12% are open to acquiring U.S. Dollar Coin (USDC) in 2025.
- 11% plan to invest in Shiba Inu (SHIB), keeping demand for meme tokens active.
- 10% show interest in Binance Coin (BNB) as a potential buy.
- 9% plan to purchase Cardano (ADA), and another 9% are interested in Binance USD (BUSD).
- 8% of respondents are considering Stellar (XLM).
- 7% plan to buy Tether (USDT) in the coming year.
- 6% are looking toward Avalanche (AVAX) as an investment option.
- 5% plan to invest in Toncoin (TON), while another 5% are open to TRON (TRX).
- 2% are interested in buying Decentraland (MANA).
- 2% plan to purchase Curve (CRV).
- 4% intend to buy other cryptocurrencies not listed above.
(Source: Security.org)
Global Cryptocurrency Adoption
- By 2025, the number of global crypto users will have surpassed 510 million, with the fastest expansion seen in Latin America, Africa, and Southeast Asia.
- Vietnam remains the world leader in per-capita adoption, with 19.2% of its population actively holding or using digital assets.
- In the United States, cryptocurrency ownership among adults reached 15% in 2025, continuing its steady upward trend.
- El Salvador reports that 35% of its citizens now use Bitcoin, supported by government incentives and national wallet programs.
- Nigeria’s crypto adoption has climbed to 41% among adults in 2025, driven largely by inflationary pressures and the need for efficient cross-border transfers.
- Among U.S. millennials, ownership has reached 43%, keeping them the most engaged generation in digital asset markets.
- Across Africa, 84% of all crypto transactions are processed on mobile devices, underscoring the role of mobile wallets in accelerating mainstream adoption.
(Source: Security.org)
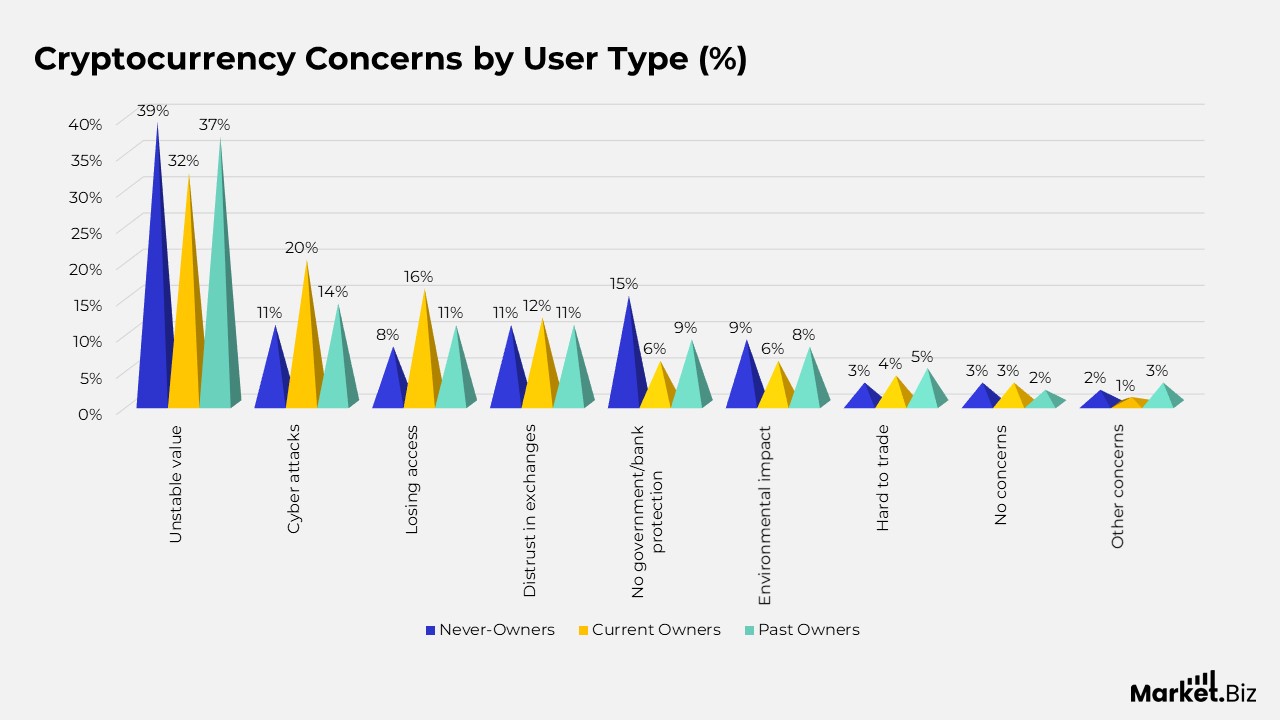
Cryptocurrency Concerns Across Different User Groups
- Among never-owners, 39% worry most about unstable value, compared to 32% of current owners and 37% of past owners.
- Cybersecurity risks concern 11% of never-owners, rising to 20% among current owners and 14% among former owners.
- Fear of losing access to funds affects 8% of non-owners, 16% of current owners, and 11% of former owners.
- Difficulty trusting crypto exchanges is a concern for 11% of never-owners, 12% of current owners, and 11% of past users.
- Lack of government or banking protection worries 15% of never-owners, while only 6% of current owners and 9% of past owners share this concern.
- Environmental impact is a concern for 9% of never-owners, 6% of current owners, and 8% of former holders.
- Trading complexity affects 3% of never-owners, 4% of current owners, and 5% of past owners.
- Only 3% of never-owners, 3% of current owners, and 2% of past owners report having no concerns.
- Other miscellaneous concerns are mentioned by 2% of never-owners, 1% of current owners, and 3% of past owners.
(Source: Security.org)
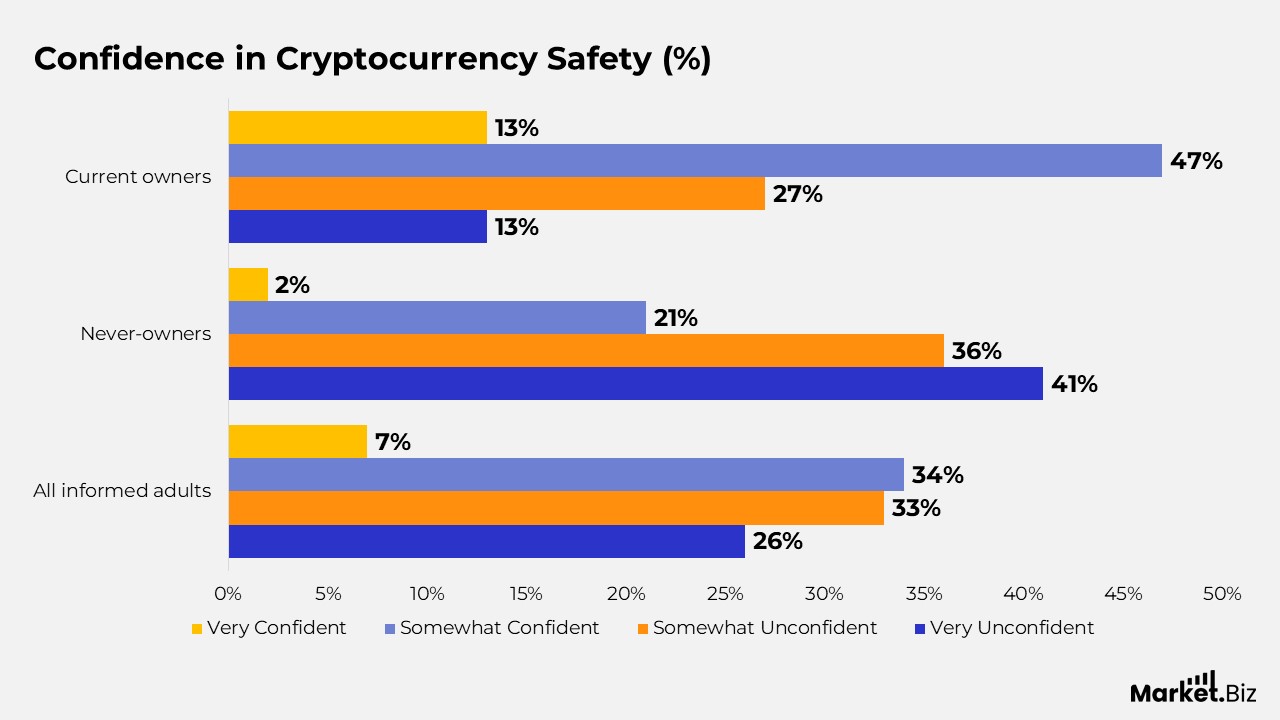
How Different User Groups Perceive Crypto Safety
- Among all informed adults, 26% feel very unconfident about crypto security, 33% feel somewhat unconfident, 34% feel somewhat confident, and only 7% feel very confident.
- For never-owners, confidence is lower: 41% are very unconfident, 36% are somewhat unconfident, 21% feel somewhat confident, and just 2% are very confident.
- Current owners show significantly higher trust: only 13% are very unconfident, 27% are somewhat unconfident, 47% are somewhat confident, and 13% are very confident in crypto safety.
(Source: Security.org)
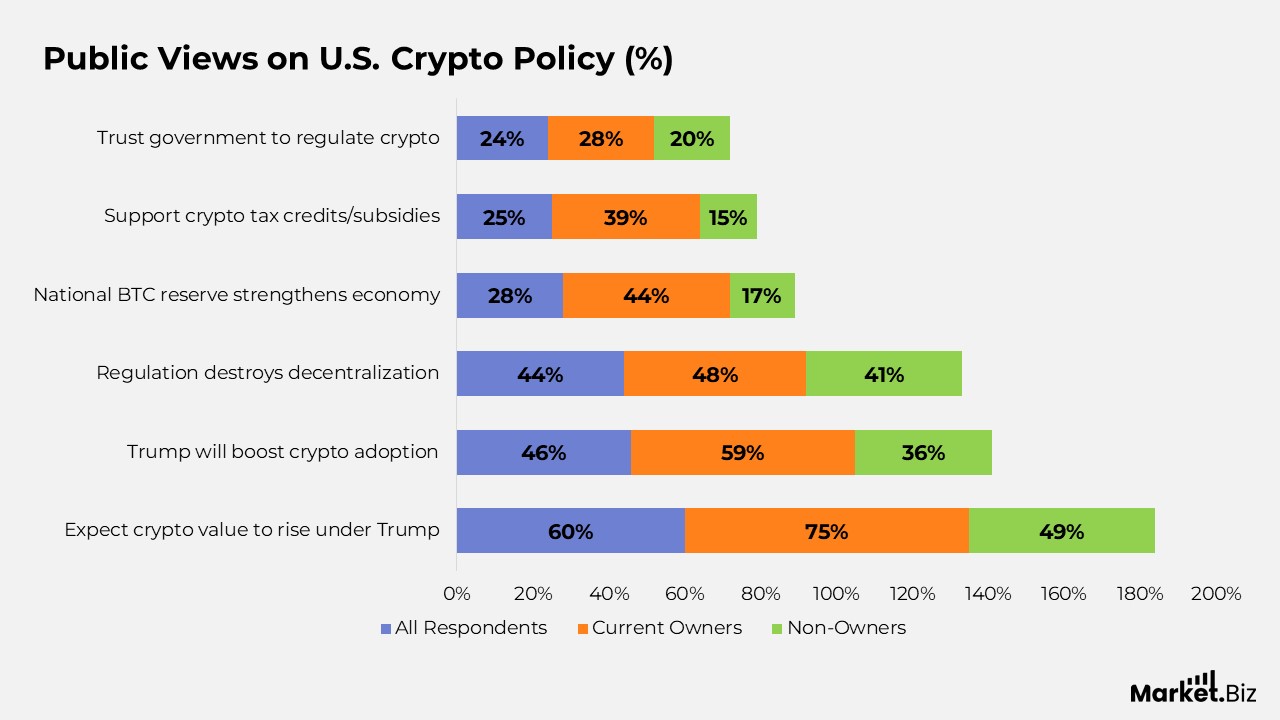
Public Opinions on Cryptocurrency Policy and Regulation in the U.S.
- Among respondents familiar with crypto, 60% expect cryptocurrency values to rise during Trump’s presidency, compared with 75% of current owners and 49% of non-owners.
- 46% of all informed respondents believe the Trump administration will accelerate mainstream crypto adoption, a view supported by 59% of current owners and 36% of non-owners.
- 44% of all crypto-aware individuals think government regulation threatens the decentralized purpose of cryptocurrency; this concern is shared by 48% of current owners and 41% of non-owners.
- 28% of all respondents believe a national Bitcoin reserve would strengthen the U.S. economy, rising to 44% among current owners but dropping to 17% for non-owners.
- 25% of all informed respondents support crypto-related tax credits or subsidies, compared with 39% of current holders and 15% of non-owners.
- Trust in government regulation remains low overall, with only 24% expressing confidence; 28% of current owners and 20% of non-owners believe the government can regulate crypto effectively.
(Source: Security.org)
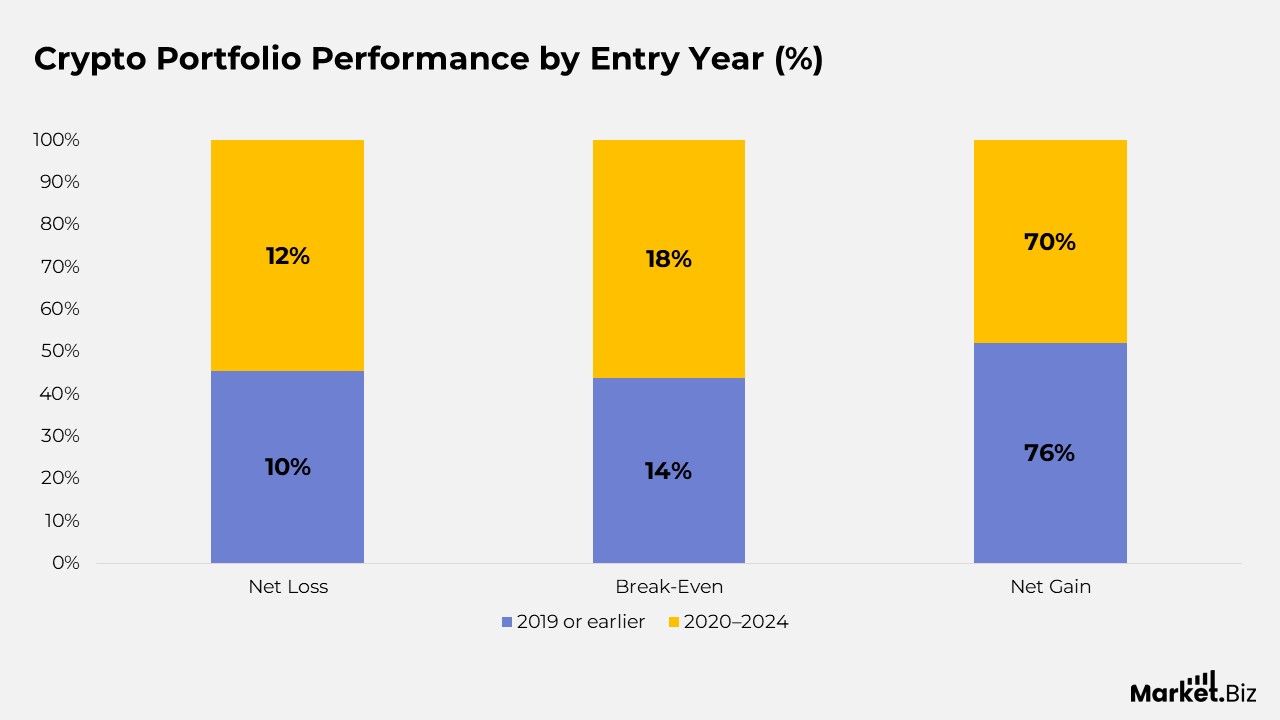
How Crypto Portfolios Have Performed Based on Investment Start Year
- Among those who began investing in 2019 or earlier, 10% report a net loss, 14% say they are breaking even, and 76% have achieved a net gain.
- For investors who entered the market between 2020 and 2024, 12% report a net loss, 18% are breaking even, and 70% have realized a net gain.
- Overall, earlier investors show stronger portfolio performance, while those entering during or after the crypto boom years experience slightly lower gains and higher break-even rates.
(Source: Security.org, Statista)
Cryptocurrency Usage and Adoption
- 76% of crypto investors hold Bitcoin (BTC), making it the most widely held digital asset in the market.
- Ethereum (ETH) ranks second in ownership at 54%, down from 65% in 2022.
- Market instability and price volatility remain leading concerns for both crypto investors and individuals who have never invested.
- Research indicates that roughly 75% of all Bitcoin transaction volume since 2015 has been tied to exchange activity.
- Nearly all cash used in crypto transactions first moves through a checking account, and 90% of these funds are deposited into a crypto exchange.
- Kraken stands among the longest-operating global crypto platforms, offering more than 1,000 spot, margin, and futures markets and employing over 2,500 people across 60 countries.
- Since early 2023, Kraken has maintained an average 40% share of EUR trading volume and continues to rank among the most liquid venues for BTC-EUR, ETH-EUR, and other major pairs.
- 31% of crypto investors did not report their digital assets on 2023 taxes, with half claiming they had no profits to declare and 18% unaware of reporting obligations.
- Stablecoins attempting to maintain a fixed value saw record popularity in 2022, reaching a combined market cap of $152 billion across the top 10 assets.
(Source: Security.org, National Library of Medicine, NBER, FDIC, Kraken, CoinLedger, Statista)
Crypto Security Breaches and Investor Priorities
- Hacks were responsible for 98.5% of all crypto-related losses in 2024. While fraud accounted for only 1.5%.
- Investor interest in cryptocurrency is driven more by positive price momentum (31%) than by security regulations (21%).
- Ethereum experienced 34 security incidents, and BNB Chain saw 18 incidents in Q2 2024, together representing 71% of all reported attacks.
- Total losses from hacks surged by 24% compared to 2023, exceeding $920 million in 2024.
- Two major hacks alone accounted for 62% of 2024’s losses: a $305 million theft from DMM Bitcoin on May 31 and a $55 million hack affecting BtcTurk on June 23.
(Source: Immunefi, Kraken)
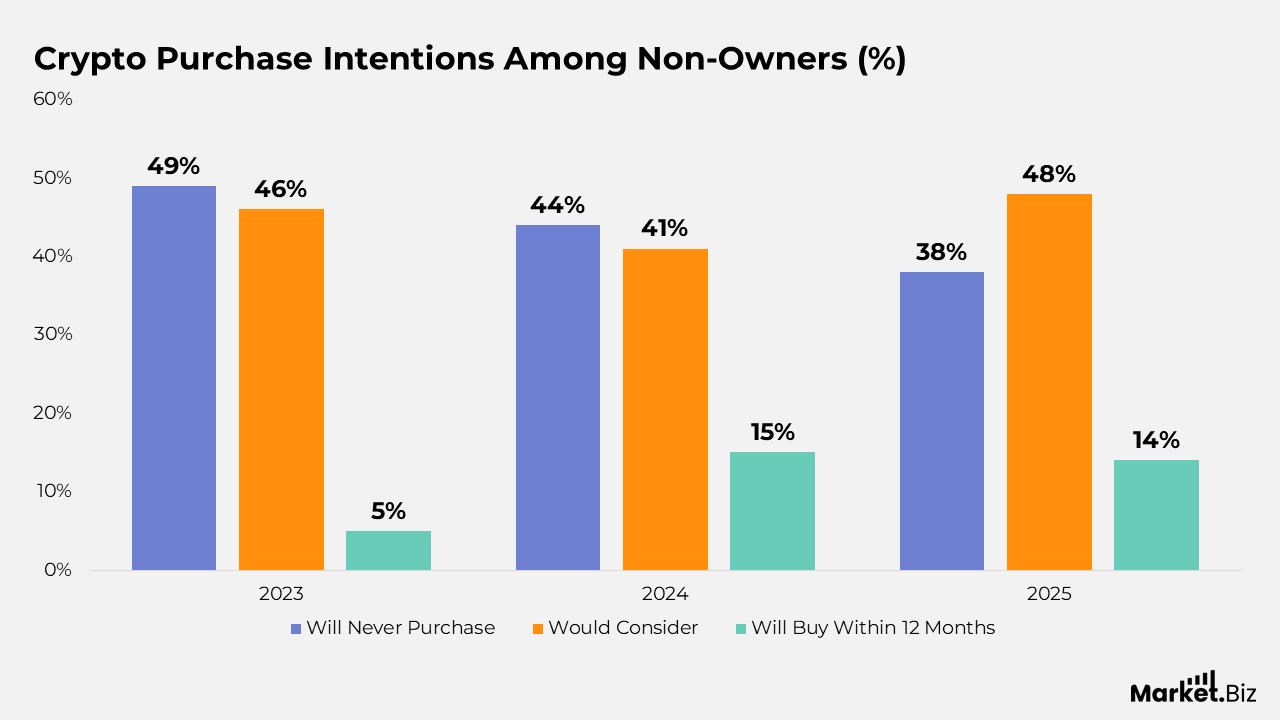
Cryptocurrency Purchase Intentions Among Non-Owners
- In 2023, 49% of non-owners said they would never buy cryptocurrency, 46% said they would be open to buying in the future, and 5% planned to buy within the next year.
- In 2024, the share of those unwilling to buy dropped to 44%, while 41% were considering a future purchase, and 15% intended to buy within 12 months.
- By 2025, reluctance fell further to 38%, with 48% expressing openness to buying later, and 14% showing definite plans to purchase in the coming year.
(Source: Security.org, Statista)
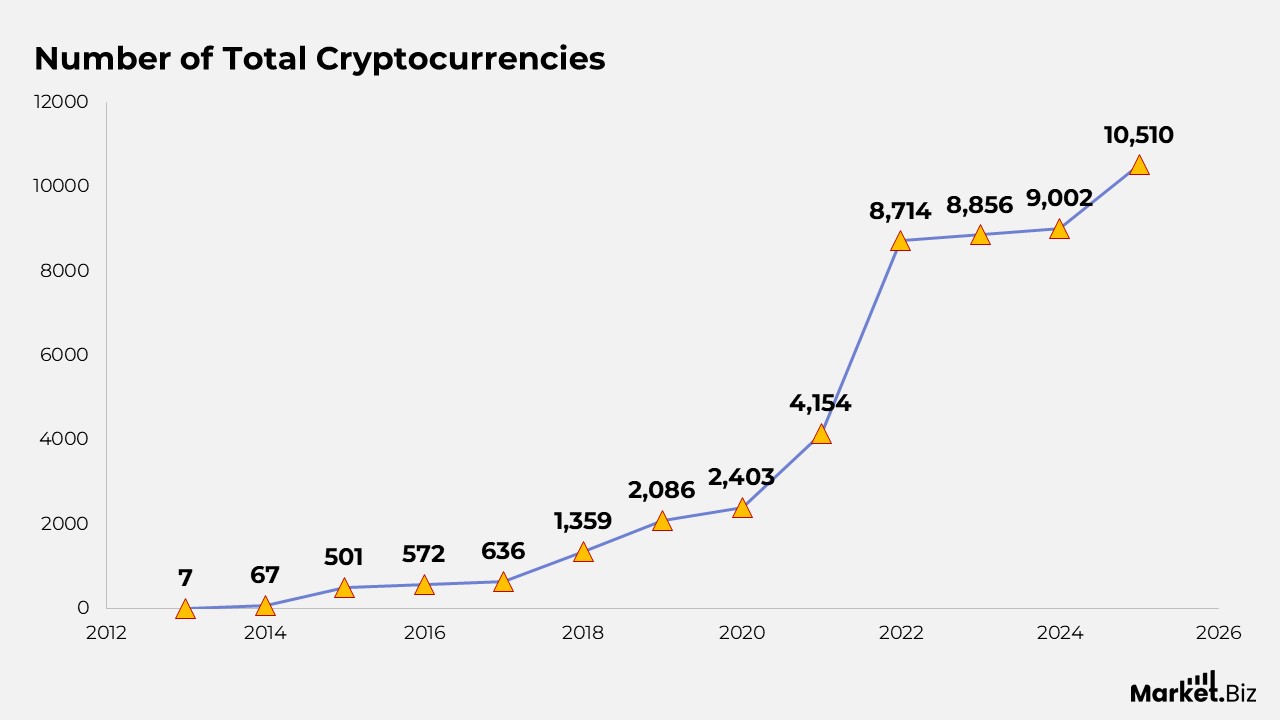
Number of Cryptocurrencies
- In April 2013, the crypto market consisted of only 7 cryptocurrencies.
- By January 2014, the number had risen sharply to 67.
- In January 2015, the count expanded to 501. Marking the first major surge in the number of digital assets.
- By January 2016, the total had increased slightly to 572.
- In January 2017, the number reached 636, ahead of the first major crypto boom.
- The market accelerated dramatically by January 2018, hitting 1,359 cryptocurrencies.
- By January 2019, the total had climbed to 2,086, showing continued expansion.
- In January 2020, the number edged up to 2,403.
- By January 2021, the crypto landscape had more than doubled to 4,154 active cryptocurrencies.
- In January 2022, the count nearly doubled again, reaching 8,714.
- Growth slowed by January 2023, reaching 8,856.
- In January 2024, the total rose modestly to 9,002.
- By January 2025, the market expanded further to 10,510 cryptocurrencies.
- As of April 2025, the number slightly declined to 10,419, indicating consolidation or delisting of inactive projects.
(Source: Exploding Topics)
Failure Patterns and Dead Coin Trends by Launch Year
- Cryptocurrencies launched in 2014 saw 37 projects fail, reflecting a low failure rate.
- Coins introduced in 2015 recorded 27 failures, a low failure rate.
- For 2016, 32 projects became inactive, maintaining a low failure classification.
- Launches from 2017 experienced a sharp spike, with 346 dead coins and an estimated ~70% failure rate.
- The trend intensified in 2018, when 1,104 cryptocurrencies failed. Again showing a ~70% failure rate.
- In 2019, the number of dead coins climbed to 1,154, indicating a moderate failure rate.
- In 2020, there were further increases, with 1,806 failed projects and a moderate failure rating.
- A significant surge occurred in 2021, with 5,724 coins becoming inactive, tied to a ~70% failure rate.
- In 2022, 3,520 coins failed, reflecting an estimated ~60% failure rate.
- By 2023, the failure count had dropped sharply to 289, resulting in a failure rate below 10%.
(Source: Coin Gecko, DemandSage)
Conclusion
Digital currency statistics reveal a financial landscape undergoing rapid transformation as digital and decentralized systems gain momentum worldwide. Growing adoption of cryptocurrencies, stablecoins, and CBDCs reflects increasing trust in digital money. While rising transaction activity highlights their expanding role in everyday payments and global trade.
At the same time, the data points to ongoing hurdles, including regulatory uncertainty, security risks, and knowledge gaps that continue to shape the pace of digital currency advancement.
As policymakers, financial institutions, and technology innovators work toward stronger frameworks and more secure infrastructures. Digital currencies are poised to become an even more integral part of the global economy.
Overall, the statistics make it clear that the future of money is evolving rapidly, driven by innovation, consumer interest, and a shift toward more inclusive, digital-first financial systems.
FAQ’s
Digital currency statistics track usage trends, market activity, adoption levels, security incidents, and regulatory developments across cryptocurrencies, stablecoins, CBDCs, and other digital financial assets.
These insights help regulators, businesses, and investors understand how the market is evolving, assess emerging risks, and identify new opportunities in the shifting digital finance landscape.
The data shows a significant rise in user participation, expanding transaction volumes, and increased institutional involvement as digital payment technologies become more mainstream.
They provide visibility into challenges such as market volatility, hacking incidents, fraud patterns, and gaps in regulatory oversight, helping stakeholders strengthen their risk strategies.
Regulatory decisions heavily shape market behaviour, and data often reflect how policy changes affect transaction activity, investor confidence, and adoption patterns across regions.