Introduction
Ecommerce Statistics: This app industry has seen remarkable growth, fueled by the widespread use of smartphones, improved internet connectivity, and a shift in consumer habits toward online shopping. With mobile devices becoming a primary tool for shopping and the rise of convenient payment solutions, eCommerce apps have become a vital component of the retail landscape.
As mobile commerce evolves, businesses are focusing on innovations like personalized shopping experiences, quicker transaction methods, and more efficient logistics to keep pace with consumer demands. This shift underscores the critical role eCommerce apps will play in the future of retail.
Editor’s Choice
- There are currently 2.77 billion online shoppers worldwide.
- By 2025, it is projected that 21% of retail purchases will be made online, with this figure rising to 22.6% by 2027.
- Global eCommerce sales are expected to exceed $6.8 trillion in 2025.
- Over 28 million eCommerce stores exist globally.
- 52% of online shoppers seek products from international markets.
- 34% of shoppers make online purchases at least once a week.
- Nearly 99% of online shoppers check reviews before making a purchase.
- Approximately 27% of the global population engages in online shopping.
- The current cart abandonment rate in global eCommerce is estimated at 70.19%.
- By 2025, the UK is expected to have 62.1 million eCommerce users.
- The average eCommerce conversion rate is between 2% and 4%.
- Amazon dominates as the largest e-commerce platform, responsible for over 14.6% of all global online store visits.
- Shopify powers 30% of the top 1 million websites globally.
- WooCommerce is used by 3.1 million companies, surpassing Squarespace, Shopify, and Wix combined.
- More than a third of consumers spend less than $200 on their online purchases.
- 49% of shoppers begin and complete their buying journey on retailer websites or apps.
- Over half of customers prioritize reliable and fast shipping when shopping online.
- 47% of consumers turn to live chat for assistance during their online shopping experience.
- 70% of shoppers prefer using smartphones for online shopping.
- High prices are the leading cause of cart abandonment, impacting 45% of Gen Z, 34% of Millennials, and 32% of Gen X and Boomers.
- 24% of online shopping occurs during the holiday season.
General Ecommerce Statistics
- As of 2025, there are 2.77 billion online shoppers globally, representing 33% of the world’s population, marking a 2.2% increase from the previous year.
- The number of online shoppers is projected to rise to 2.86 billion by 2026, driven by increased internet penetration and convenience.
- China leads in online shopping with 904.6 million online shoppers, followed by the US, which has 288.45 million online buyers.
- 21% of retail purchases are expected to occur online in 2025, the highest to date, with this figure rising to 22.6% by 2027.
- The share of online retail purchases has been growing at an average rate of 0.32% annually since 2021.
- In 2027, the share of online retail transactions is forecasted to be 22.6%.
- In 2026, the share is projected to reach 21.8%.
- In 2025, the share is expected to be 21%.
- In 2024, the share will be 20.1%.
- In 2023, the share is 19.4%.
- In 2022, the share was 18.7%.
- In 2021, the share of online retail transactions was 18.8%.
(Source: Statista, SellersCommerce)
Ecommerce Platforms Market Size
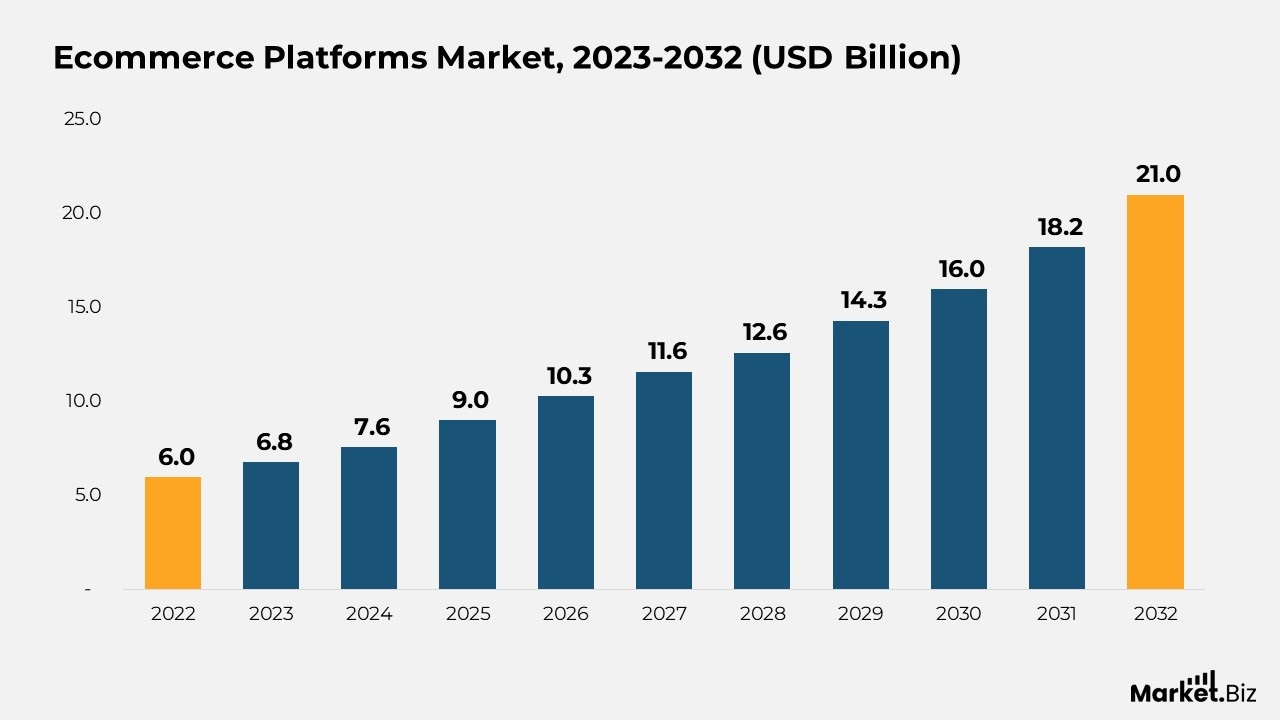
- According to Market.us, the global ecommerce platforms market is anticipated to rise from $6.8 billion in 2023 to $21.0 billion by 2032, representing a compound annual growth rate (CAGR) of 13.7% from 2023 to 2032.
- Globalization of e-commerce is driving market growth, as businesses expand beyond local markets into international trade.
- The B2C segment dominated the e-commerce platforms market in 2022, driven by increased digital literacy and the availability of internet services.
- The Cloud-Based segment captured 58% of the e-commerce platform market in 2023, offering flexibility, scalability, and cost-effectiveness for businesses.
- The Electrical & Electronics segment led the e-commerce platforms market in 2022, fueled by the shift towards online shopping for electronic goods.
- North America held a dominant market share of 32.8% in 2023, with revenues amounting to USD 1.9 billion, driven by digital penetration and infrastructure.
- The United States is the second-largest global eCommerce market, with total eCommerce revenue expected to surpass $875 billion in 2025.
- Shopify leads the eCommerce platform market in the US, holding a 28.41% share, powering over 2.8 million US-based websites.
(Source: Market.us)
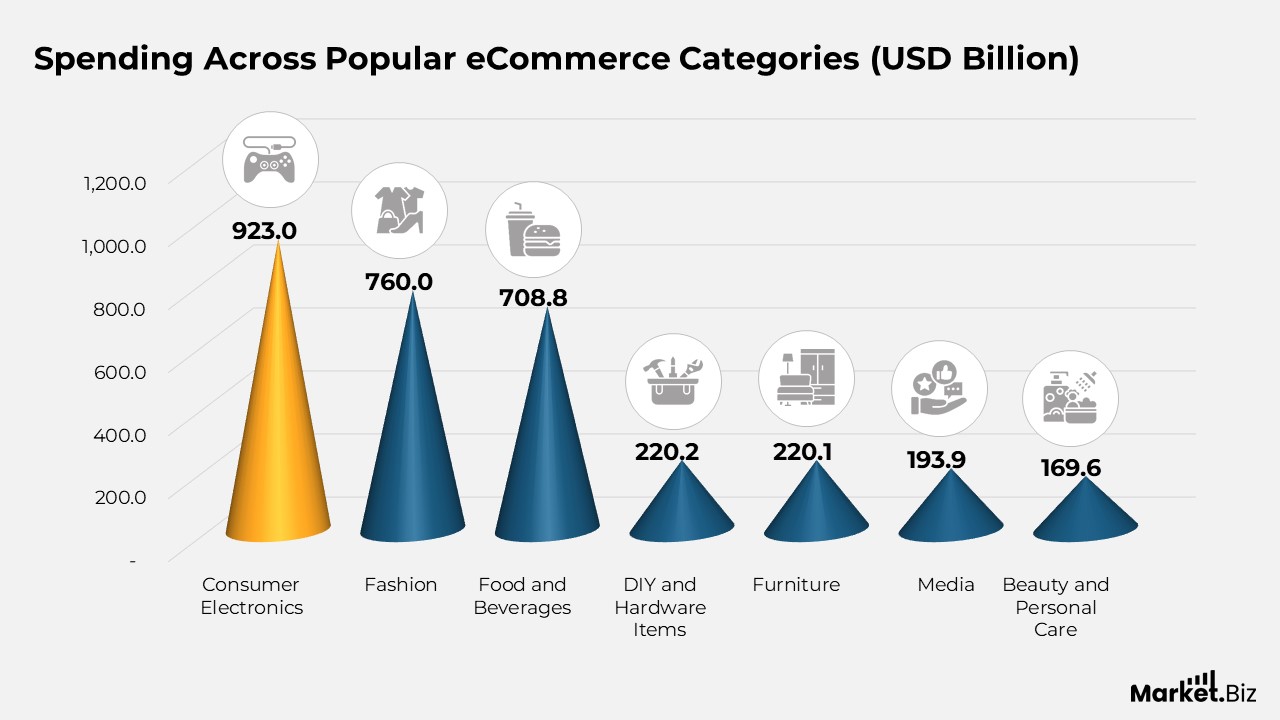
Spending Across Popular eCommerce Categories
- Consumer electronics are projected to reach $922.5 billion in spending by 2025.
- Fashion is expected to see $760 billion in online spending by 2025.
- Food and beverages are forecasted to account for $708.8 billion in eCommerce spending by 2025.
- DIY and hardware items are predicted to generate $220.2 billion in spending by 2025.
- Furniture sales are expected to reach $220.1 billion in eCommerce by 2025.
- Media is anticipated to generate $193.9 billion in online spending by 2025.
- Beauty and personal care products are projected to total $169.6 billion in eCommerce spending by 2025.
(Source: Shopify, Statista, SellersCommerce)
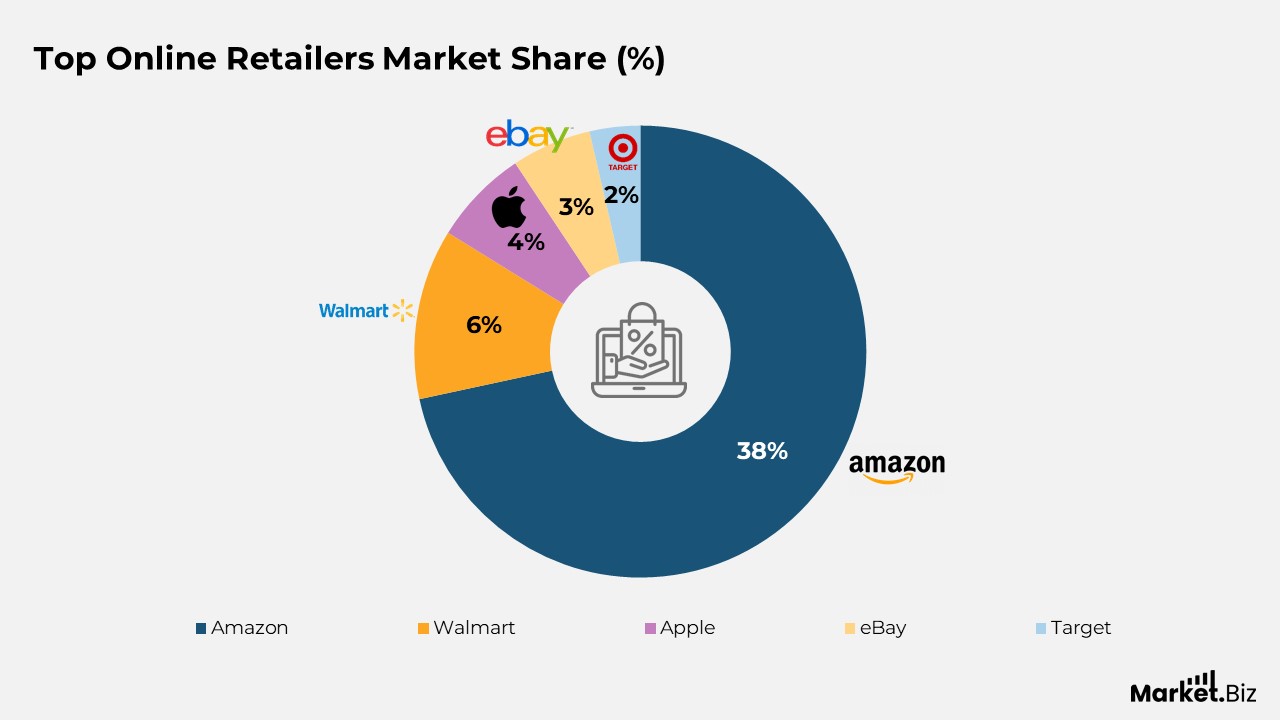
Top Online Retailers Market Share
- Amazon commands a leading market share of 37.6%.
- Walmart holds 6.4% of the online retail market.
- Apple secures 3.6% of the market share.
- eBay makes up 3% of the online retail market.
- Target captures 1.9% of the market share.
(Source: Shopify, Statista, SellersCommerce)
Ad Spending of Commerce Platforms
- Amazon is expected to spend $1,700 million on advertising.
- Target has an estimated ad spending of $603.9 million.
- Walmart allocates $414.6 million for advertising.
- Home Depot is projected to spend $166.3 million on ads.
- eBay plans to spend $112.5 million on advertising.
- Etsy has an estimated advertising budget of $88.5 million.
- CVS is expected to spend $41.3 million on ads.
- Best Buy is projected to allocate $33.3 million for advertising.
- Lowes will spend around $17.2 million on advertising.
- AliExpress has an estimated ad spending of $0.32 million.
(Source: Shopify, Semrush Trends, Statista, SellersCommerce)
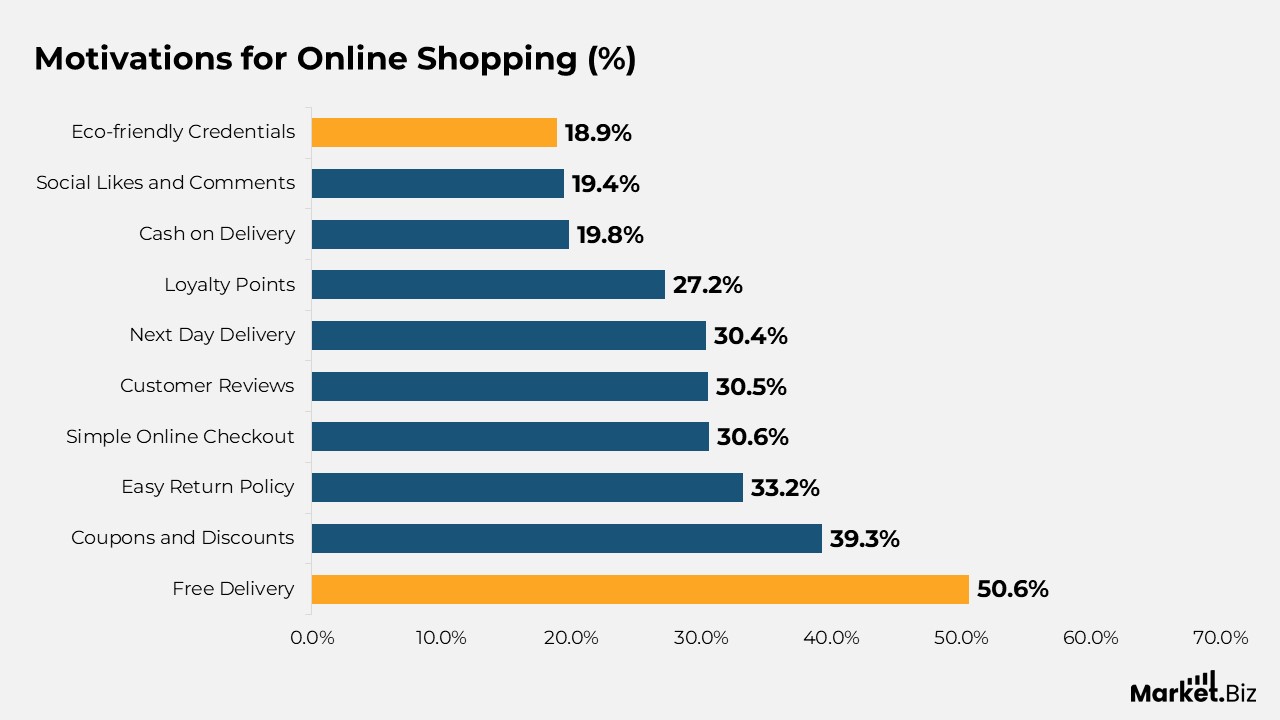
Motivations for Online Shopping
- Free delivery is the leading reason, affecting 50.6% of shoppers.
- Coupons and discounts attract 39.3% of online consumers.
- An easy return policy encourages 33.2% of shoppers to make online purchases.
- A simple online checkout process influences 30.6% of shoppers.
- Customer reviews are a significant factor for 30.5% of shoppers.
- Next-day delivery appeals to 30.4% of online buyers.
- Loyalty points drive 27.2% of shoppers to make purchases.
- Cash on delivery is preferred by 19.8% of consumers.
- Social likes and comments influence 19.4% of shoppers.
- Eco-friendly credentials are considered by 18.9% of consumers.
(Source: Shopify, Oberlo, Statista, SellersCommerce)
Ecommerce Trends
- 32% of people utilize augmented reality (AR) while shopping.
- 40% of consumers are willing to pay more for products that they can initially test using AR.
- Approximately 9 out of 10 Gen Z consumers show interest in AR shopping.
- Over 90% of Americans either currently use or are open to using AR for shopping.
- Brands that derive more than 50% of their sales from products with ESG-related (Environmental, Social, and Governance) claims experience 32-34% repeat purchases.
- Brands generating less than 50% of sales through ESG claims still maintain a solid repeat purchase rate of just under 30%.
- A PRN survey found that 80% of consumers are more likely to trust companies that provide publicly shared data to support their sustainability claims.
- The same survey revealed that 40% of consumers are uncomfortable purchasing from companies that are not actively tracking sustainability goals.
- 33% of businesses without a loyalty program today plan to implement one by 2027.
Moreover
- 78% of marketers report that their customer engagement strategies are data-driven.
- The adoption of augmented reality (AR) in shopping is rapidly increasing. According to SellersCommerce, around 32% of shoppers use AR to visualize products before purchasing.
- A 2024 survey conducted in the U.S. revealed that 75% of consumers believe AR provides a clearer and more accurate representation of products compared to traditional images or descriptions, boosting their confidence in purchasing decisions.
- A study by Specright found that 80% of consumers are more likely to trust companies that transparently share data backing their sustainability claims. Additionally, 40% of shoppers are reluctant to buy from companies that are not actively working toward sustainability goals.
- More businesses are planning to implement loyalty programs, with about a third of those currently without one intending to launch by 2027. Additionally, 78% of marketers report utilizing data to engage customers, highlighting the growing importance of personalized, data-driven loyalty programs.
(Source: SellersCommerce, Shopify, Specright, WAC, Oberlo, Statista, SellersCommerce)
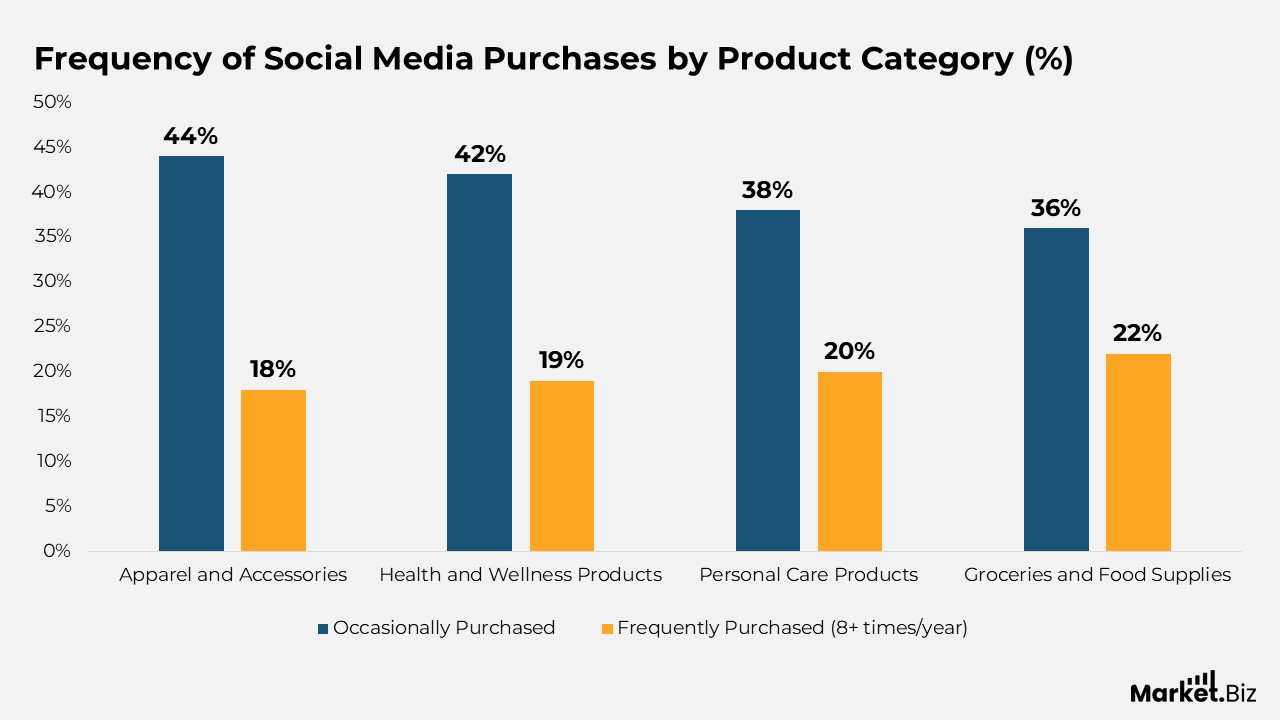
Frequency of Social Media Purchases by Product Category
- 44% of consumers purchase apparel and accessories occasionally, while 18% buy them frequently (8 times or more annually).
- 42% of shoppers buy health and wellness products occasionally, and 19% make frequent purchases.
- 38% of consumers purchase personal care products occasionally, with 20% buying them frequently.
- 36% of shoppers purchase groceries and food supplies occasionally, and 22% make frequent purchases throughout the year.
(Source: SellersCommerce, Statista)
AI and Personalization in eCommerce
- Personalization powered by Artificial Intelligence has become essential for businesses, as 80% of global customers now expect a tailored shopping experience.
- Implementing AI-driven recommendation systems can help businesses boost conversion rates by 15-20%, leading to significant financial gains.
- To stay competitive, companies must adapt to evolving customer preferences, with 81% of today’s shoppers seeking personalized interactions during their shopping journey.
- By leveraging AI in customer support, businesses have the potential to capture a share of the $11 billion in annual savings while enhancing service quality.
(Source: eSparkBiz, Statista)
Omnichannel Shopping Trends
- Strategic optimization can drive growth for your business, as global eCommerce conversion rates remain at 2.17%.
- Studies show that more than 50% of online transactions will be processed through digital and mobile wallet payments by 2025.
- Your business can tap into a global market, as 52% of online shoppers are actively seeking international products beyond regional boundaries.
- The digital marketplace offers scaling opportunities, with 2.77 billion shoppers participating in global digital shopping.
(Source: eSparkBiz, Statista)
Mobile Commerce Statistics
- According to a survey by the Pew Research Center, approximately 76% of U.S. adults shop online using their smartphones.
- This percentage rises to 91% among adults aged 18 to 49, who prefer using their phones for online shopping.
- In comparison, 69% of consumers shop using desktop or laptop computers, while only 28% use tablets.
- 65% of shoppers use their mobile devices to compare prices while in physical stores.
- 52% of customers report that a poor mobile website experience negatively impacts their trust in a brand.
- The GSMA Mobile Gender Gap Report 2024 shows that women are more likely to shop on their phones. In low and middle-income countries, 66% of women use mobile internet, compared to 78% of men.
- Tablets boast the highest conversion rate on eCommerce platforms at 3.1%, followed by desktops at 2.8%.
- Smartphones have a conversion rate of 2.3%, closely aligning with the overall eCommerce conversion rate of 2.5%.
(Source: Pew Research Center, WAC, GSMA Mobile Gender Gap Report, SellersCommerce, Statista)
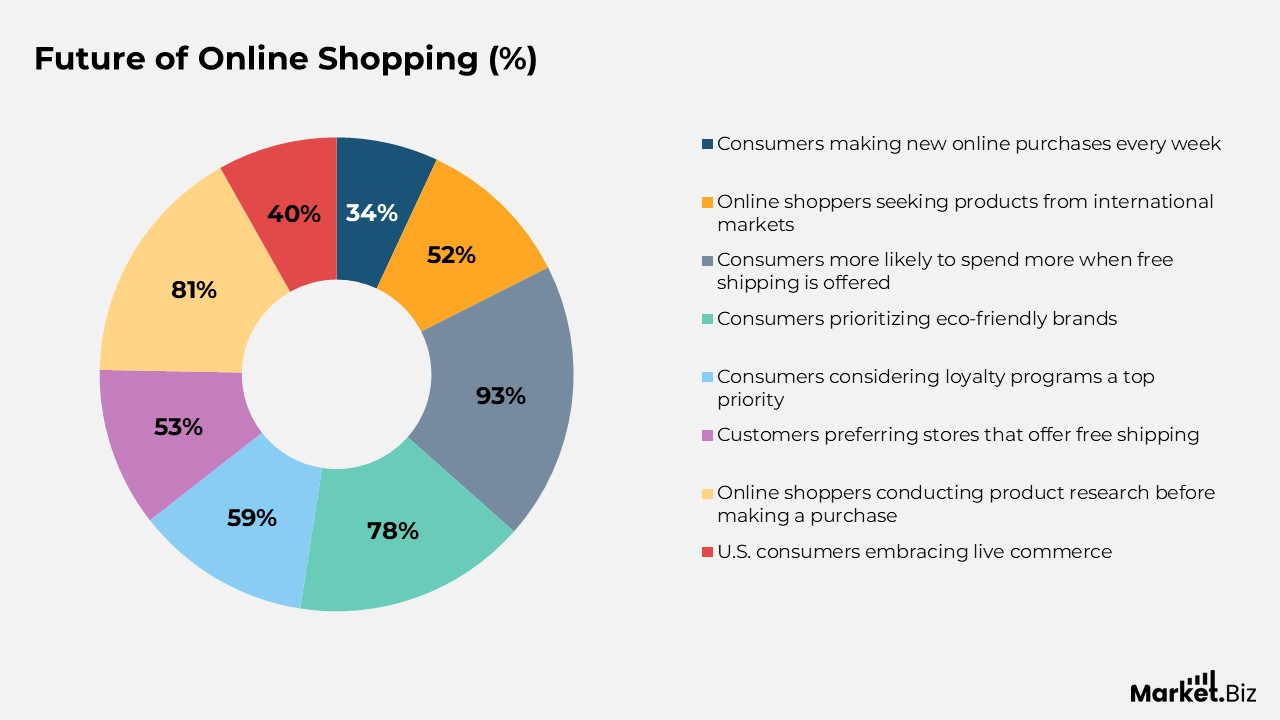
Future of Online Shopping
- 34% of consumers make new online purchases every week, highlighting how deeply embedded online shopping has become in daily habits.
- The internet has eliminated geographical boundaries, with 52% of online shoppers actively seeking products from international markets.
- According to the IoT in Retail Global Market Report 2026, the Internet of Things is poised to revolutionize the retail sector.
- 93% of consumers are more likely to spend more when free shipping is offered, significantly increasing average cart value.
- 78% of consumers prioritize eco-friendly brands, actively seeking sustainable products, which provides a competitive edge to businesses.
- 58.7% of consumers consider loyalty programs a top priority when making shopping decisions.
- 53.2% of customers prefer shopping at stores that offer free shipping, influencing their purchasing choices.
- A significant 81% of online shoppers conduct thorough product research before making a purchase decision.
- 40% of U.S. consumers have embraced live commerce, indicating the growing popularity of interactive shopping experiences.
(Source: Pew Research Center, eSparkBiz, Statista)
E-commerce Platform Statistics
- There are currently over 27 million e-commerce websites globally.
- WooCommerce holds more than 50% of the e-commerce platform market. Shopify accounts for around 10%, while Squarespace stores make up about 13%.
- Shopify serves over 700 million buyers worldwide and powers more than 4.5 million businesses globally.
- Magento has over 100,000 customers across the globe.
- As of 2024, Amazon was preferred by more than 300 million online shoppers worldwide.
(Source: Sitefeey, Datanyze, Builtwith, Analyzify)
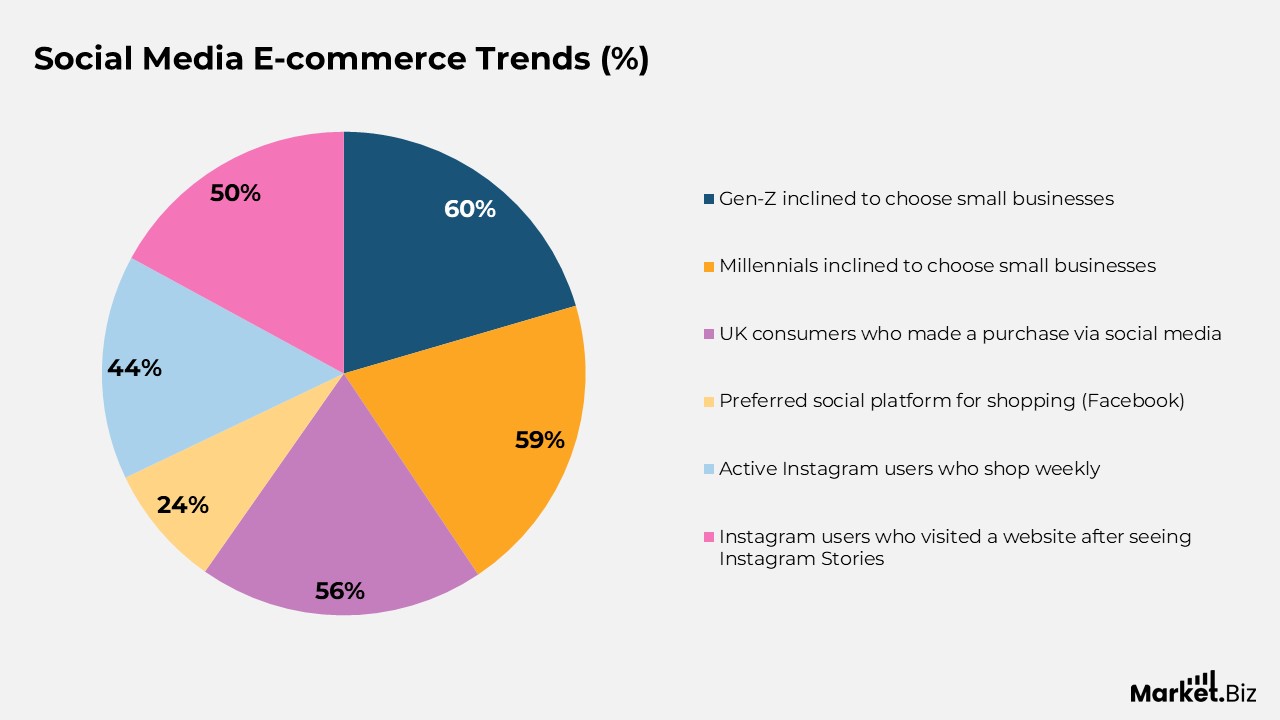
Social Media E-commerce Trends
- 60% of Gen-Z and 59% of Millennials are more inclined to choose products from small businesses.
- 56% of UK consumers have made a purchase directly through a social media platform.
- In 2024, 24% of global online shoppers cited Facebook as their preferred social platform for shopping, making it the most popular choice.
- TikTok Shop in the UK saw over 200,000 active businesses in 2024.
- On TikTok Shop, there were around 5,000 live shopping sessions every day in the UK in 2024.
- 44% of active Instagram users shop on the platform weekly.
- 50% of Instagram users have visited a website to purchase a product or service after discovering it via Instagram Stories.
- Shoppable posts on Instagram have been shown to drive up to 1,416% more website traffic in 2024.
- Social media sales in the UK could reach nearly £8.8 billion by 2025.
(Source: Hubspot, Statista, ChannelX, BusinessDasher, Autify Digital Ltd.)
E-commerce by Industry
Fashion Industry
- Artificial intelligence is projected to add $150–$275 billion to the fashion industry’s profits by optimizing Personalization, improving supply chains, and enhancing customer experience.
- Sustainable fashion is on the rise, with brands offering repair services and consumers demanding ethical sourcing.
- 35% of consumers would shop online more often if virtual try-on options were available before making a purchase.
- Live shopping is expected to account for 10-20% of e-commerce sales by 2026.
(Source: Shopify, Statista, ChannelEngine, BigCommerce, SCAYLE)
Consumer Electronics
- Consumer electronics continue to be a dominant e-commerce category, driven by high demand for devices such as smartphones, laptops, and gaming consoles.
- The adoption of augmented reality and wearable technology devices is growing at an accelerated pace, outpacing other electronics sectors.
- Over two-thirds of global buyers report fluctuations in their electronics buying habits due to economic factors such as inflation and supply chain issues, which have affected demand for non-essential electronics.
- While the sector saw rapid growth during the pandemic, the pace is expected to slow due to rising costs and economic slowdowns. Nevertheless, electronics continue one of the lowest cart abandonment rates among e-commerce sectors, at roughly 50%.
(Source: Statista, DemandSage)
Beauty and Personal Care
- Amazon, Mercado Libre, and Tmall dominate online sales in this sector, providing a vast range of products.
- The demand for eco-friendly beauty products continues to rise, with online platforms leading in sales.
- Instagram and TikTok are pivotal in product discovery and sales, especially among younger consumers.
(Source: Statista, Exploding Topics)
Food and Beverages
- In Q3 2024, U.S. e-grocery sales surged by 13.8%, reaching $27.4 billion year-over-year.
- 55% of consumers are more inclined to purchase packaged food products if they include sustainability claims.
- Subscription models such as meal kits, specialty coffee deliveries, and “subscribe and save” options are increasing customer loyalty and generating stable revenue.
- Buy Now, Pay Later (BNPL) payment methods are also gaining popularity, even in the food sector, allowing consumers to make larger or repeat purchases with ease.
(Source: Statista, Shopify, Chain Store Age)
Conclusion
The eCommerce app market is experiencing robust growth, fueled by the widespread adoption of smartphones, enhanced internet connectivity, and the growing preference for mobile shopping among consumers.
As the number of online shoppers increases and a larger portion of retail purchases shift to mobile apps, businesses must innovate and optimize their platforms to cater to the demands of tech-savvy consumers. Key features such as multi-language support, secure payment options, and seamless user experiences are critical to capturing a broader market share.
As mobile commerce continues to evolve, eCommerce apps will remain pivotal in shaping the future of retail, offering businesses valuable opportunities to expand their customer base and drive revenue growth.
FAQ’s
As the number of online shoppers rises, the demand for eCommerce apps is expected to increase. This growth will encourage businesses to enhance their app features, refine user experiences, and improve functionality to meet the needs of a larger and more diverse customer base.
With greater internet access in developing regions, the number of new online shoppers is expected to rise, accelerating the adoption of eCommerce apps. As more people in emerging markets gain access to mobile devices and the internet, eCommerce apps will become a crucial tool for shopping and retail engagement.
As mobile-first shopping becomes increasingly popular, consumers are expected to favor mobile apps over desktop websites for shopping. This trend will push businesses to prioritize mobile optimization, ensuring that eCommerce apps offer a smooth, efficient, and seamless shopping experience on smartphones and tablets.
With mobile payment solutions becoming more secure and widely adopted, eCommerce app developers will focus on integrating fast, one-click payment options that emphasize security and ease of use. This will help reduce friction during the checkout process and potentially lead to higher conversion rates.
As businesses expand globally, eCommerce apps will need to cater to international markets by offering multi-language support, multi-currency payment options, and integration with global shipping providers. Apps will also need to comply with international regulations to ensure smooth, secure transactions across borders.