Introduction
Electric vehicle (EV) statistics provide a clear window into one of the fastest-growing transformations in global transportation. As governments push for cleaner mobility, automakers increase EV model availability, and battery technology rapidly improves, adoption is accelerating across every major region.
Over the past decade, EVs have shifted from a niche innovation to a mainstream transportation choice, with millions of battery-electric and plug-in hybrid vehicles now operating worldwide.
These statistics highlight how quickly the EV landscape is evolving from rising global vehicle stock and expanding charging infrastructure to shifting consumer preferences and declining battery costs. Understanding these trends is essential for policymakers, manufacturers, investors, and businesses seeking to capitalize on the transition to sustainable mobility.
Editor’s Choice
- Switching to a fully electric vehicle can save over $2,000 in annual fuel costs compared to a traditional gasoline car.
- EV owners save more than $6,000 in lifetime maintenance and repair costs due to fewer moving parts and reduced servicing needs.
- The EV market now offers 100+ models, with at least 19 capable of delivering ranges of 300+ miles on a single charge.
- As of February 2025, the U.S. has surpassed 210,000 public charging stations, with nationwide infrastructure expanding steadily.
- Level 2 home chargers can add roughly 250 miles of driving range overnight, supporting effortless daily commuting.
- Modern electric vehicles typically include a minimum battery warranty of 8 years or 100,000 miles, ensuring long-term reliability.
- EVs significantly cut emissions, reducing tailpipe and greenhouse gas output by more than half compared to internal combustion vehicles.
- Growing EV adoption benefits the electric grid, helping push overall electricity rates downward for consumers.
Moreover
- Consumer satisfaction remains high, with over 80% of EV owners saying they would choose another electric vehicle for their next purchase.
- More than 40 million electric vehicles are currently operating worldwide.
- Annual sales now exceed 6 million plug-in EVs, reflecting accelerating global adoption.
- Norway remains the global frontrunner in EV penetration, recording the highest share of new electric vehicle registrations.
- China dominates charging infrastructure, hosting over 8 times as many public EV charging stations as any other country.
- Plug-in electric vehicle (PEV) sales surpassed 1.5 million units in 2024, up over 7% from 2023, with battery electric vehicles (BEVs) accounting for 80% of total PEV sales.
- By September 2025, PEVs accounted for 13.6% of monthly vehicle sales, reflecting steady consumer adoption momentum.
- For the full year 2024, PEVs accounted for 9.9% of total U.S. passenger vehicle sales, up from 9.4% recorded in 2023.
- As of October 2025, cumulative U.S. plug-in electric vehicle sales have exceeded 7.6 million units, highlighting the continued expansion of the EV market.
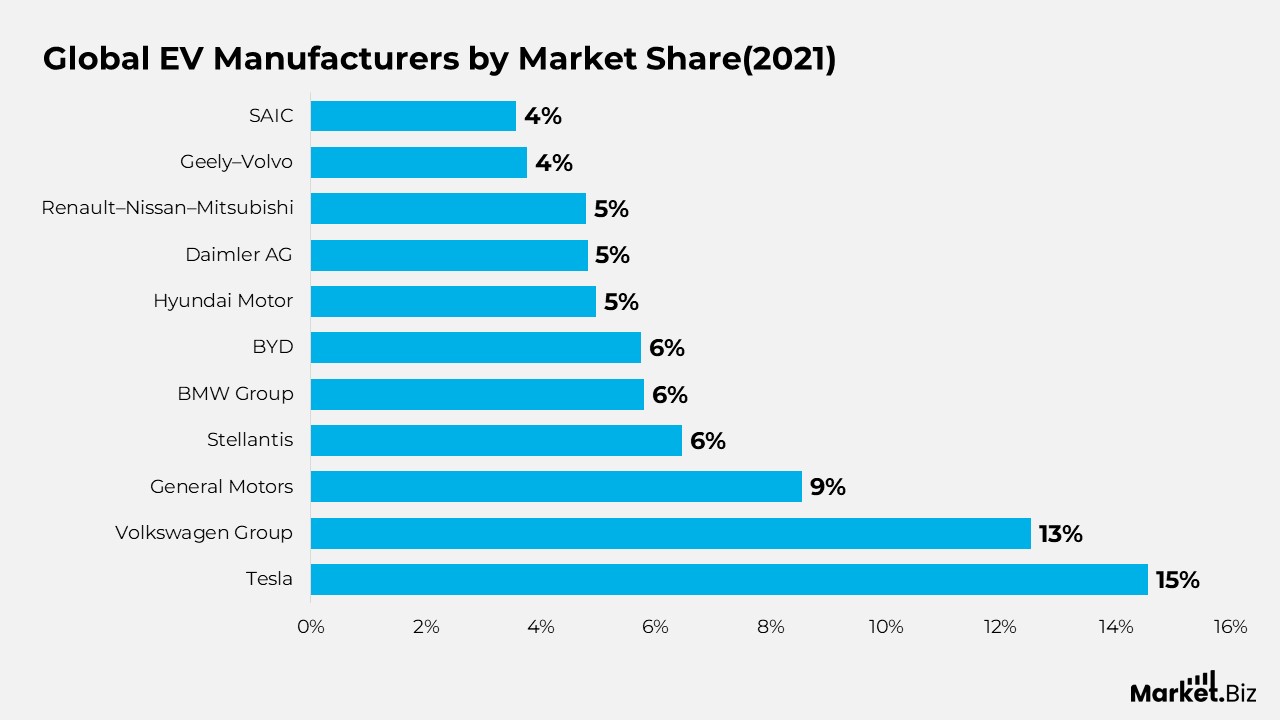
Electric Vehicle Manufacturers by Global Market Share
- In early 2021, Tesla held the strongest position, commanding 14.55% of the global EV market.
- Volkswagen Group followed closely with 12.52%, reflecting its rapid expansion in electric mobility.
- General Motors secured the third spot with 8.55%, supported by growing EV production in North America.
- Stellantis accounted for 6.45% of the global EV share, benefiting from its wide portfolio across multiple brands.
- BMW Group captured 5.79%, maintaining its strong presence in the premium electric vehicle segment.
- BYD registered 5.75%, reinforcing its status as a major player in China’s booming EV sector.
- Hyundai Motor accounted for 4.97% of global EV sales, driven by popular models such as the Kona and Ioniq series.
- Daimler AG held 4.82%, reflecting consistent growth through its Mercedes-Benz EQ lineup.
- Renault–Nissan–Mitsubishi Alliance achieved 4.79%, supported by long-standing models such as the Nissan Leaf.
- Geely-Volvo Car Group captured 3.77%, propelled by increasing adoption of its Volvo Recharge and Polestar models.
- SAIC rounded out the list with 3.57%, strengthened by strong domestic demand and joint ventures in China.
(Source: Exploding Topics, CleanTechnica)
Global Electric Car Sales & Market Momentum
- Global EV sales surpassed 17 million units in 2024, marking a growth of more than 25% year-on-year.
- The increase of 3.5 million additional EVs sold in 2024 compared to 2023 alone exceeded total global EV sales in 2020.
- Over 20% of all new cars sold worldwide in 2024 were electric, reflecting accelerated consumer adoption.
- China continued to dominate, recording over 11 million EV sales, equaling global volumes recorded just two years earlier.
- EV growth in Europe slowed due to subsidy cuts and unchanged EU CO₂ targets between 2023 and 2024.
- The U.S. saw moderate growth, with sales rising but at only one-fourth the pace of the previous year.
- Outside China, the U.S., and Europe, emerging markets recorded a 40% surge, reaching 1.3 million EV sales and nearly matching U.S. volumes.
Global EV Fleet Expansion Statistics
- The global EV fleet reached 58 million vehicles by the end of 2024, up from 19 million in 2021.
- EVs now make up 4% of all passenger cars worldwide.
- EV adoption displaced over 1 million barrels of oil per day in 2024.
- China leads with roughly 1 in 10 cars being electric, while Europe stands at one in twenty.
China’s EV Market Highlights
- China’s EV sales surged 40% year-on-year in 2024, accounting for nearly two-thirds of global EV sales.
- Monthly EV sales in China have exceeded conventional cars since July 2024, placing full-year EV share near 50%.
- A 2024 trade-in incentive drove significant demand: 6.6 million consumers applied, with 60% buying EVs.
- PHEV and EREV demand spiked, reducing BEV share from 80% in 2020 to below 60% in 2024, though BEV volume still rose sharply.
Europe’s Market Stabilization
- EVs accounted for about 20% of new-car sales in Europe in 2024, matching the previous year.
- Sales growth varied widely: 14 EU nations saw increases, while markets such as Germany and France declined due to subsidy cuts.
- Changing CO₂ standards created little push for 2024 EV sales, with industry focus shifting to 2025 targets.
- Norway continued leading with 88% BEV share, Denmark hit 56%, and the UK reached nearly 30% EV share.
United States EV Market Update
- U.S. EV sales climbed to 1.6 million in 2024, crossing the 10% market share threshold.
- Growth slowed to 10%, far below the 40% rise seen in 2023.
- Model diversity expanded by 24 new EV models, raising competition and lowering Tesla’s market share from 60% in 2020 to 38% in 2024.
- Updated tax credit rules allowed instant rebates of up to $7,500, though only about 20 models qualified.
Emerging Markets Breaking Through
- EV sales in emerging nations rose by 60%, with market share doubling from 2.5% to 4% in 2024.
- Southeast Asian markets, Vietnam, Indonesia, and Thailand, saw steep jumps driven by price-competitive Chinese EVs.
- Latin America achieved a 4% EV share, with Brazil leading at 125,000 EV sales.
- African EV sales doubled to nearly 11,000, aided by policies like Ethiopia’s combustion-vehicle import ban.
Rise of New Local Electric Vehicles Brand Statistics
- New brands such as Togg (Türkiye), VinFast (Vietnam), and Tito (Argentina) are reshaping regional EV landscapes.
- VinFast expanded exports to 11 countries, while Türkiye boosted Togg production by 50%.
- Domestic OEM Tata leads India’s EV market, while JSW’s partnership with China’s SAIC is accelerating local manufacturing.
(Source: International Energy Agency)
Chinese Manufacturer Expansion Abroad
- Chinese OEMs expanded overseas production in anticipation of upcoming tariff changes in Brazil, Thailand, Indonesia, and Malaysia.
- Over 85% of EVs in Brazil and Thailand came from China in 2024.
- Indonesia cut VAT on EVs from 11% to 1%, tripling EV sales.
- Malaysia’s EV share doubled, supported by full tax exemptions for imported EVs until 2025.
(Source: International Energy Agency)
Policy-Driven Market Shifts
- Tax breaks and subsidies helped Costa Rica, Colombia, and Uzbekistan double EV sales.
- Africa saw similar shifts. Ethiopia alone reported 100,000 EVs deployed following its ban on ICE vehicle imports.
(Source: International Energy Agency)
Electric Vehicles Outlook for 2025 Statistics
- EV sales grew 35% in Q1 2025, surpassing 4 million units.
- China led with 2.5 million EV sales in Q1, with EV share exceeding 50% in February and March.
- Europe sold 900,000 EVs in Q1 2025, with the UK reaching 30% EV share.
- U.S. Q1 EV sales exceeded 360,000, maintaining a 10% share.
- Emerging markets in India, Brazil, and Vietnam continued rapid expansion, with 40–300% growth.
- Global EV sales are expected to reach 20 million by the end of 2025, representing one-quarter of all new car sales.
(Source: International Energy Agency)
Government Spending and Policy Changes
- Government spending on EVs fell to under 7% of global EV spending in 2024, down from 20% in 2017.
- Global government support remained around $38 billion annually, while consumer spending rose to $560 billion in 2024.
- China maintained the highest public spending, driven by tax exemptions and trade-in subsidies.
- Europe cut subsidies aggressively; Germany removed EV subsidies in 2023, France tightened eligibility, and Sweden eliminated its program.
- The U.S. maintained the highest per-vehicle support (~$4,000 average credit per EV in 2024).
(Source: International Energy Agency)
Trends in Heavy-Duty Electric Vehicles Statistics
- Electric bus sales expanded 30% in 2024, surpassing 70,000 units worldwide.
- China drove most of the growth, while markets outside China rose only 5%, although volumes have tripled since 2020.
- China’s dominance continues to decline: its share of global electric bus sales dropped from ~99% in 2017 to under 70% in 2024.
- Despite falling sales between 2017 and 2023, China’s electric bus market share remained steady at ~60%.
Europe
- Europe recorded nearly 15% sales growth in 2024, achieving a market share of 13%+.
- Countries such as Denmark, the Netherlands, Finland, and Norway recorded electric bus shares above 40%.
- The United Kingdom led Europe, contributing ~20% of regional sales, with ~2,000 units sold and 40%+ annual growth.
- Italy followed with ~1,200 units, and Germany with ~900 units.
- Battery-electric city buses dominated: 10 European nations exceeded 80% BEV shares, driving nearly half of all new city buses to be electric in 2024 (up from 35% in 2023).
United States
- U.S. electric bus uptake averaged 70% annual growth between 2020 and 2024.
- However, in 2024, a 40% decline occurred, primarily due to supply chain disruptions.
- This drop allowed India (~3,200 sales) and Korea (~2,800 sales) to overtake the United States in 2024 electric bus sales volumes.
Latin America
- Regional sales grew from ~600 in 2020 to over 2,000 in 2024.
- Latin America now accounts for nearly 40% of electric bus sales outside China, India, Europe, and Korea.
- Mexico saw bus electrification rise to ~8% of total bus sales in 2024 (up from 1% in 2023).
- Countries like Chile, Colombia, and Brazil also demonstrated strong adoption momentum.
Technology Shift
- Plug-in hybrid buses have nearly vanished from the market.
- China’s PHEV bus share fell from 60% in 2014 to almost zero by 2024.
- Globally, PHEV bus share dropped from ~60% in 2015 to ~1% in 2024.
- BEVs dominate due to lower battery costs, more models, and better charging infrastructure, expanding the range of viable use cases.
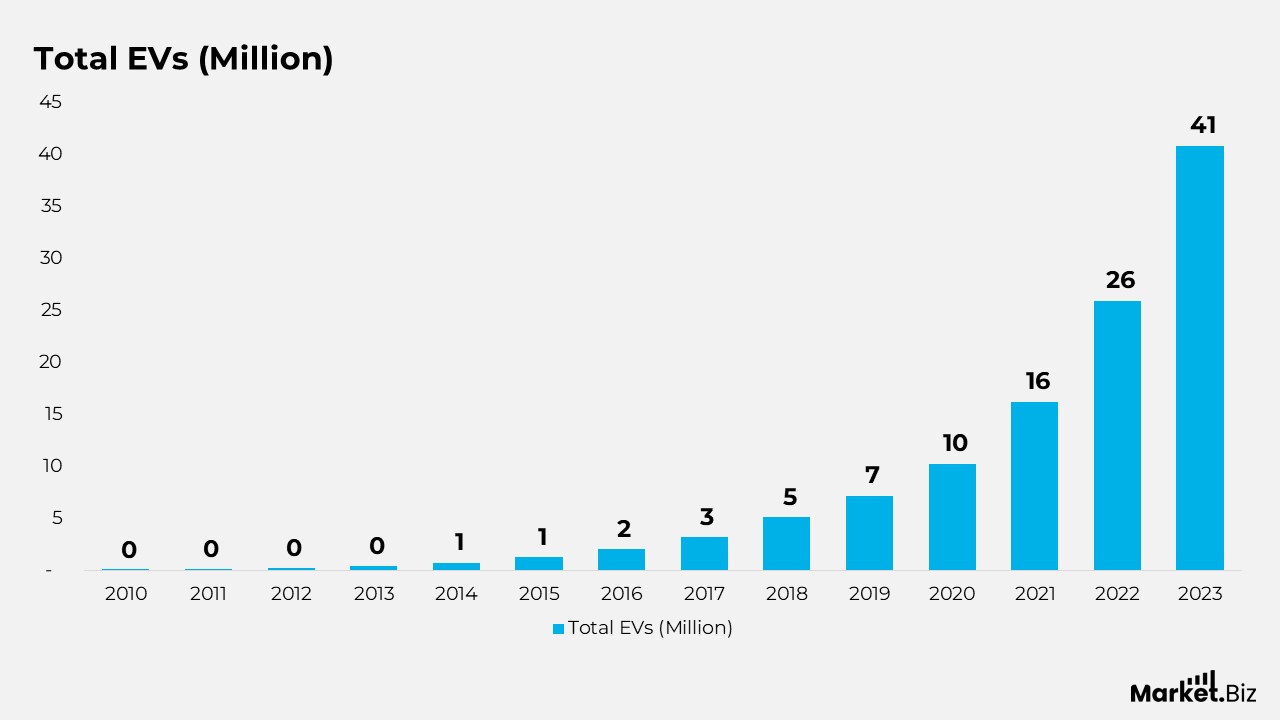
Electric Vehicles User Statistics
- In 2010, the global EV fleet began modestly with about 17,300 vehicles, mostly BEVs, marking the early foundation of modern electrification.
- By 2011, EV numbers climbed to nearly 65,000, adding more than 47,000 new units compared to the previous year as PHEVs gained initial traction.
- In 2012, total EVs surged past 184,000, reflecting a sharp annual jump of nearly 120,000, driven by expanding BEV and PHEV options.
- In 2013, over 387,000 EVs were registered, almost doubling the previous year, with an additional 203,000 vehicles entering global roads.
- In 2014, the EV fleet crossed 700,000, adding more than 316,000 units as consumer adoption accelerated across major markets.
- By 2015, total EV stock reached 1.24 million, boosted by an annual increase of over 542,000, signalling a mainstream transition.
- In 2016, global EV numbers approached 2 million, growing by roughly 750,000 as both BEVs and PHEVs scaled rapidly.
- The fleet expanded to 3.14 million vehicles in 2017, adding more than 1.14 million new EVs.
- In 2018, global EV stock surpassed 5.1 million, with nearly 2 million new additions, reflecting strong worldwide momentum.
- By 2019, the fleet crossed 7.14 million EVs, growing by over 2 million as consumer confidence and model variety increased.
- The year 2020 saw EV numbers exceed 10.2 million, marking a record annual rise of 3.08 million, supported by policy incentives and falling battery costs.
- In 2021, the global EV population jumped to 16.2 million, adding nearly 6 million vehicles in a single year.
- By 2022, EV use surged to 25.9 million, reflecting a dramatic growth of 9.7 million, one of the strongest yearly increases on record.
- In 2023, total EVs reached 40.8 million, with almost 15 million new vehicles added, marking the decade’s steepest expansion.
(Source: Exploding Topics)
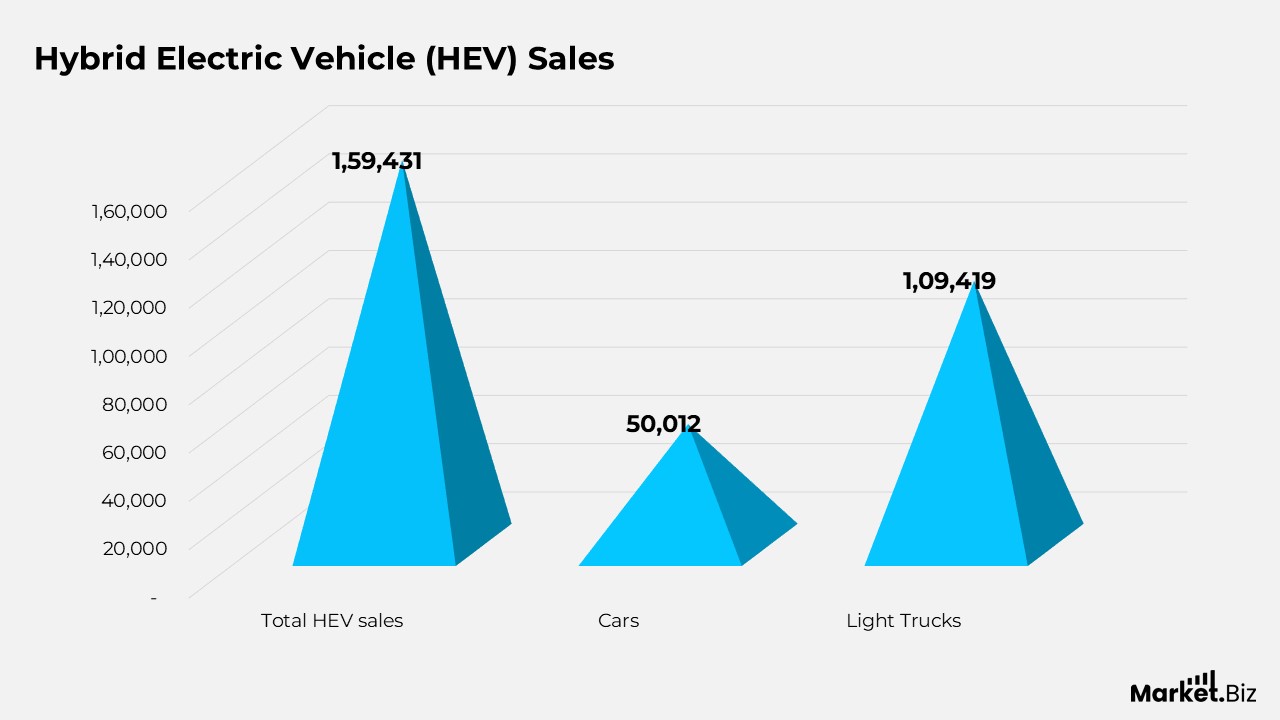
Hybrid Electric Vehicles (HEV) Sales Statistics
- In October 2025, HEV sales in the U.S. reached 159,431 units (50,012 cars and 109,419 light trucks), a 5.8% increase from October 2024.
- Toyota remained the dominant HEV brand, capturing 46.8% of all hybrid sales during the month.
Plug-In Vehicle Sales (BEVs + PHEVs)
- A total of 91,067 plug-in vehicles were sold in the U.S. in October 2025, including 74,897 BEVs and 16,170 PHEVs.
- This represents a 26.9% decline compared to plug-in sales in October 2024.
- Plug-in vehicles accounted for 7.16% of all light-duty vehicle sales for the month.
- Cumulatively, 1,309,772 BEVs and PHEVs have been sold in 2025, bringing total U.S. plug-in sales since 2010 to 7,611,053 units.
Hydrogen Fuel Cell Electric Vehicle (FCEV) Sales
- In October 2025, U.S. sales included 18 Honda CR-V FCEVs, 13 Toyota Mirai, and 2 Hyundai Nexo units.
- Total FCEV sales for 2025 reached 316 units, with cumulative sales since 2014 totaling 18,934 vehicles.
EV Battery Manufacturing & Energy Storage Capacity
- Analysis from Argonne indicates that as of January 2024, operational and announced lithium-ion battery facilities in North America could collectively support production for around 10 million new light-duty plug-in vehicles annually by 2030, assuming average battery sizes of 80–100 kWh.
(Source: Argonne National Laboratory, U.S. Department of Energy Office of Science)
Conclusion
Electric Vehicles Statistics: The latest electric vehicle statistics underscore a global mobility shift that is accelerating each year. EV adoption continues to rise sharply as sales surge across leading markets and steadily expand in developing regions. This growth is reinforced by wider model options, declining battery prices, and supportive government policies that make EVs more attainable for consumers and fleets alike.
Charging infrastructure is also scaling rapidly, improving accessibility and helping ease range-related concerns. Battery manufacturing capacity is increasing as well, positioning the industry to meet future demand. Consumers are showing stronger confidence in EV performance and long-term savings, while environmental benefits and reduced maintenance requirements further strengthen their appeal.
Despite ongoing challenges, including infrastructure gaps, market fluctuations, and evolving regulatory frameworks, the overall trajectory remains strongly positive. The numbers clearly indicate that electric vehicles have moved beyond early adoption and are becoming a mainstream choice globally. As innovation accelerates, EVs are set to play an even greater role in shaping a cleaner, more efficient, and more resilient transportation future.
FAQ’s
EV data highlights a deep transformation in the automotive landscape, with a clear shift away from internal combustion engines toward cleaner, electrified mobility. Rising EV adoption signals technological progress, supportive regulatory environments, and a shift in consumer preferences toward sustainable transportation.
Adoption levels act as indicators of how effectively countries are cutting transport-related emissions. Higher EV penetration typically reflects strong policy backing, well-developed charging networks, and a societal shift toward greener mobility choices.
Growth in yearly EV sales reveals how quickly consumers are transitioning away from traditional combustion vehicles. These trends are shaped by factors such as advancements in battery technology, falling EV costs, wider model availability, and government incentives or emission standards.
An expanding charging network suggests that a region is strengthening the essential infrastructure needed for widespread EV adoption. It signifies investment in grid upgrades, better urban planning, and improved accessibility that support daily EV usage.
Patterns in EV data, such as longer ranges, faster charging times, and extended battery warranties, reflect continuous improvements in battery design and production. These advancements boost vehicle dependability and increase consumer trust in electric mobility.