
Introduction
Facebook Advertising Statistics: Facebook continues to be the sole social media application used by more than half of the global social networking demographic, achieving a reach of 59% in 2020. As of September 2021, Facebook has 2.91 billion monthly active users, marking a 6% increase from the previous year, which underscores its worldwide influence.
The significance and durability of Facebook during the COVID-19 pandemic are obvious not only in its user engagement statistics but also in the advertising expenditures on the platform, as the number of advertisers has more than doubled in the past 18 months. For advertisers, the year 2025 presents fresh opportunities to engage with audiences through sophisticated tools and innovative ad formats that promise improved interaction and returns.
Currently, marketers are using Facebook ads via reels, videos, and posts. In the future, they may even explore the virtual realm to provide consumers with improved opportunities to view and test products prior to making a purchase.
Editor’s Choice
- The median cost-per-click (CPC) for Facebook Ads is recorded at $0.54.
- A recent analysis determined that the average cost per mile (CPM) for Facebook Ads is $1.12.
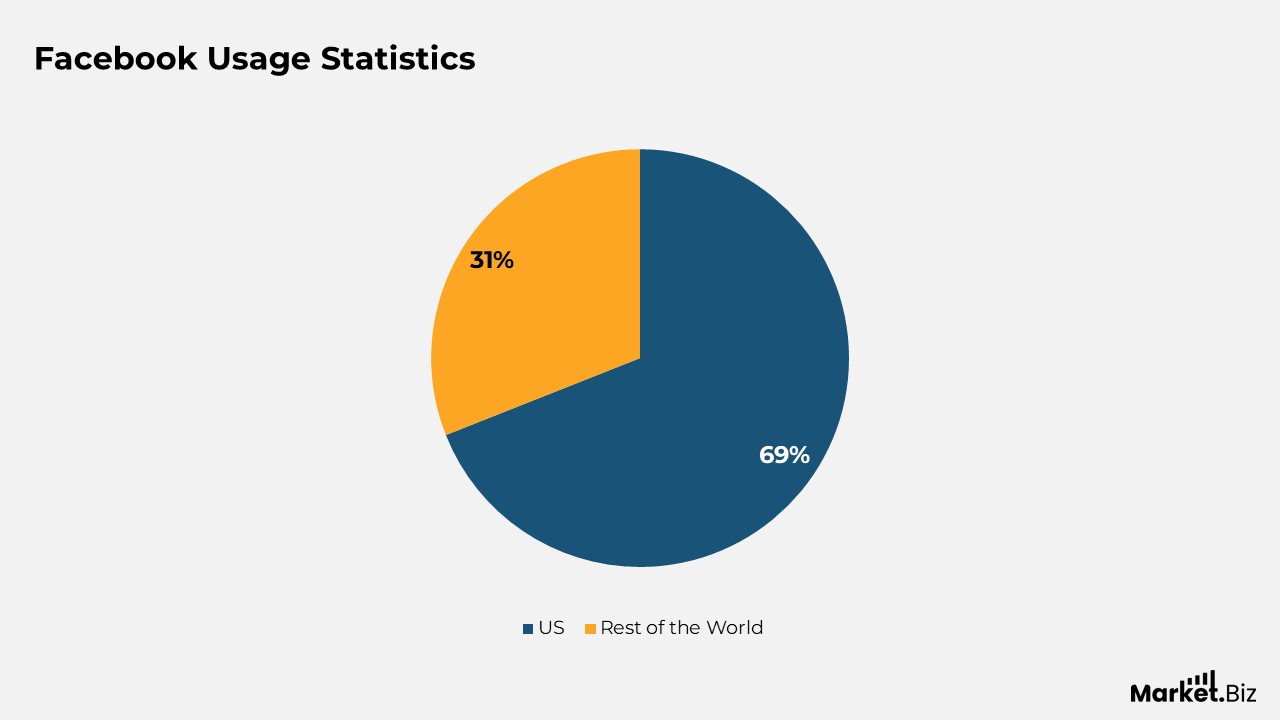
- 69% of adults in the United States use Facebook.
- 88% of individuals access Facebook via a mobile device.
- Facebook users are 1.5 times more inclined to view a video on their mobile phones.
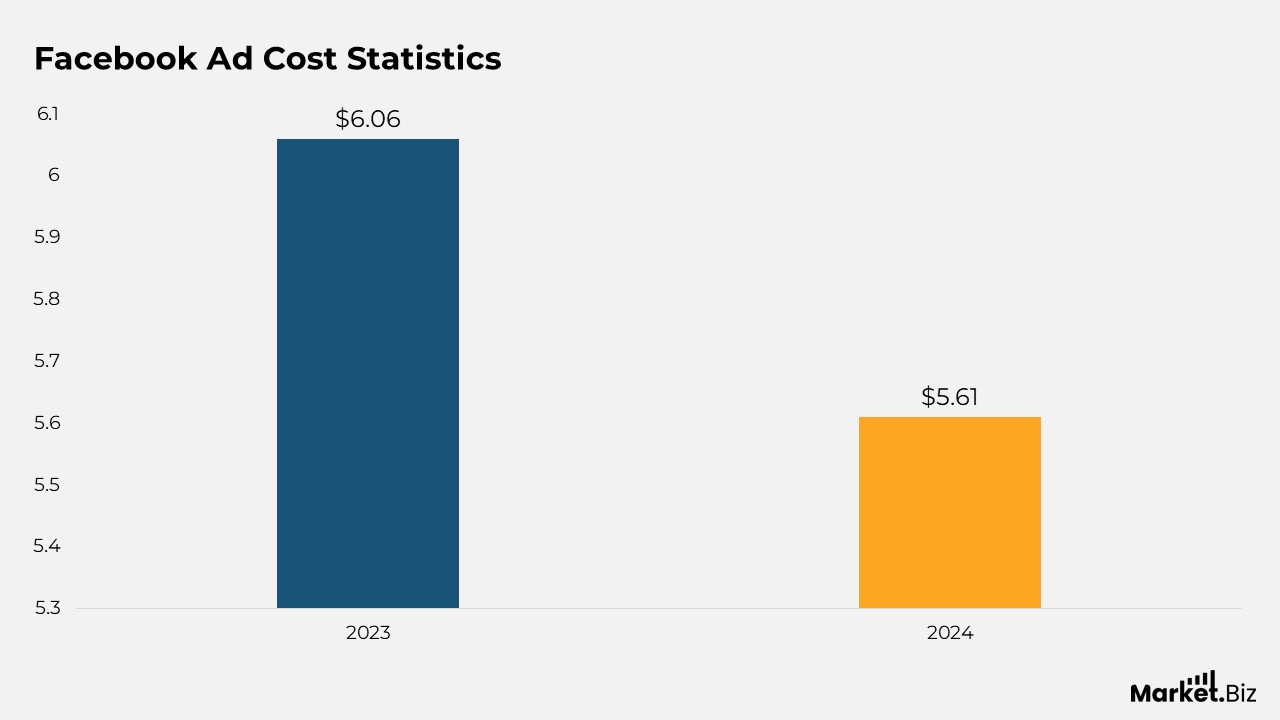
- In 2024, the average CPM for Facebook ads was noted to be $5.61.
- There are now 1.8 billion people using Facebook Groups every month.
- Facebook’s advertising revenue in the United States is projected to reach $32.55 billion in 2024.
- Advertisements on Facebook reach 27.7% of the global population.
- The median cost-per-click (CPC) for Facebook Ads stands at $0.54.
General Facebook Advertising Statistics
- 54% of marketers surveyed indicate that Facebook advertisements are considered “very effective” in driving sales, while only 8% assert that they are ineffective.
- 29% of marketers report that using Facebook has yielded the highest return on investment (ROI) for their organizations, surpassing all other social media platforms.
- 67.55% of advertisers on Facebook believe that videos generate more ad clicks on the platform than other types of content.
- For 42.9% of marketers surveyed, the optimal audience size for Facebook ads is over 50,000 users.
- A study conducted by Databox revealed that the average click-through rate (CTR) for Facebook Ads across all industries stands at 1.44%.
- The median cost-per-click (CPC) for Facebook Ads is recorded at $0.54.
- As of the first quarter of 2024, the cost per mile (CPM) for Facebook Ads has seen a 2% decrease year-over-year.
- A recent analysis determined that the average cost per mile (CPM) for Facebook Ads is $1.12.
- In 2024, the average cost per mile (CPM) for Facebook Ads in the United States reached $4.29, which is 3.83 times higher than the global average.
Moreover
- Facebook’s advertising revenue in the United States is projected to hit $32.55 billion in 2024, reflecting a 7.2% increase compared to the previous year.
- An analysis by Metricool indicated that App Promotion campaigns on Facebook Ads incurred the highest cost per click at $0.32. While Traffic campaigns had the lowest cost per click at $0.0m4.
- The same Metricool study revealed that the average cost per mile (CPM) for Facebook ads associated with the Leads campaign is $3.36.
- An examination of 675 B2C companies found that the median return on ad spend (ROAS) for Facebook Ads is 1.79.
- Data from 636 B2C companies indicates that the median return on ad spend (ROAS) for Facebook Ads is 1.8. Which is almost identical to the values observed in B2C.
- A study conducted by Wordstream revealed that the average cost-per-action on Facebook Ads is $19.68.
- In terms of conversion rates across all industries, the average for Facebook Ads stands at 8.95%. With a range between 3.95% and 11.34%, depending on the specific industry.
- Regarding lead ads on Facebook, the average cost per lead across different industries is $23.10.
- The cost per lead for Facebook ads is highest in the legal services sector at $78.26, while it is lowest for real estate organizations at $12.43.
Facebook Usage Statistics
- 69% of adults in the United States use Facebook.
- Though the growth of Facebook has become stable over the last five years. It continues to be one of the most popular social networking platforms in the U.S., ranking just behind YouTube.
- This is noteworthy as, despite public controversies and an increasingly crowded social media landscape, Facebook has maintained its leading position in the United States.
- 88% of individuals access Facebook via a mobile device.
- To effectively engage the average Facebook user, it is advisable to optimize your Facebook advertisements for both mobile and desktop views or to run ads exclusively for mobile devices.
- Highlighting mobile advertising will improve your Facebook marketing strategy and assist your ads in reaching your intended audience.
- More than 85% of Facebook’s daily active users reside outside of the United States and Canada.
- This figure illustrates the growing global influence of Facebook and the opportunities it provides for advertisers to connect with new markets worldwide.
- Facebook users are 1.5 times more inclined to view a video on their mobile phones.
FB Ad Cost Statistics
- As of June 2024, the typical cost-per-click (CPC) for Facebook advertisements aimed at users in the United States was around $0.52.
- The CPC denotes the fee an advertiser is charged each time a user engages with their advertisement.
- The cost-per-thousand impressions (CPM) reflects the expense an advertiser faces for every 1,000 views of their advertisement.
- In 2024, the average CPM for Facebook ads was noted to be $5.61.
- This figure is marginally lower than the overall average CPM for social media advertisements, which was recorded at $6.06 in the last quarter of 2023.
Facebook Marketing Statistics
- Shares are the most valuable type of engagement on Facebook.
- Facebook engagement statistics have a median of 0.08% across all industries.
- Mark Zuckerberg himself claims that Facebook Marketplace is used every month by 800 million people globally.
- Facebook continues to be the most effective social media marketing platform. According to a group of surveyed marketers.
- There are now 1.8 billion people using Facebook Groups every month.
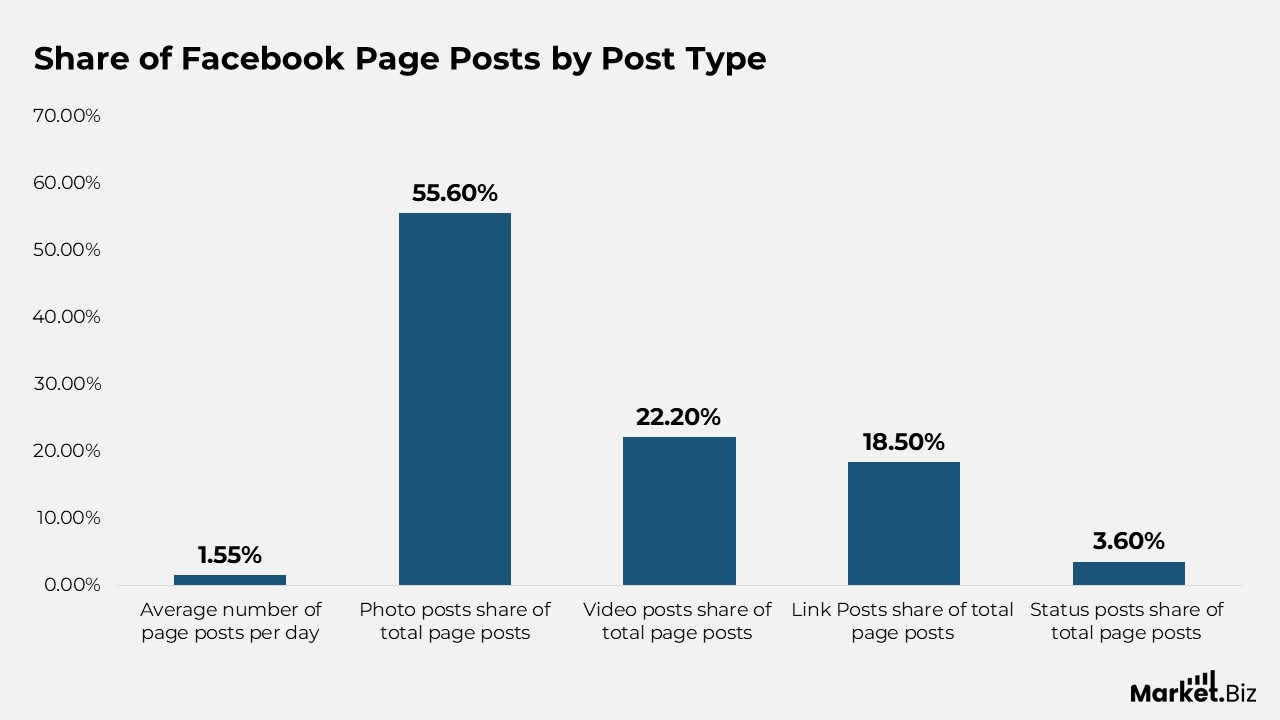
- Facebook video statistics show that video posts have an average engagement rate of 6.01%.
- A piece of content’s visibility is determined by the Facebook News Feed algorithm.
- The Stories format is the most popular type of content on Facebook.
- Facebook is the second most popular video property next to Google.
- The average Facebook organic reach of a single post is just 2.2%.
- 84% of video marketers use Facebook to promote their new products or services in video format.
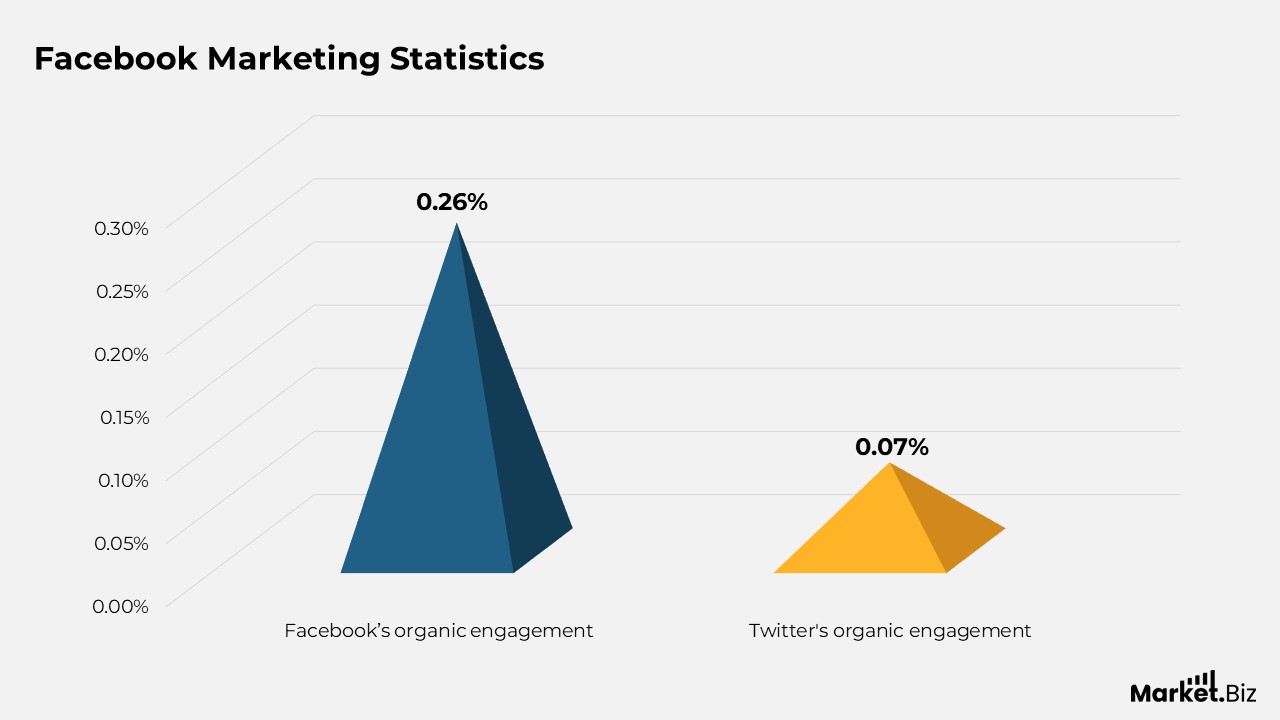
- Facebook’s organic engagement is 0.26% less than Instagram’s but is 0.07% ahead of Twitter’s.
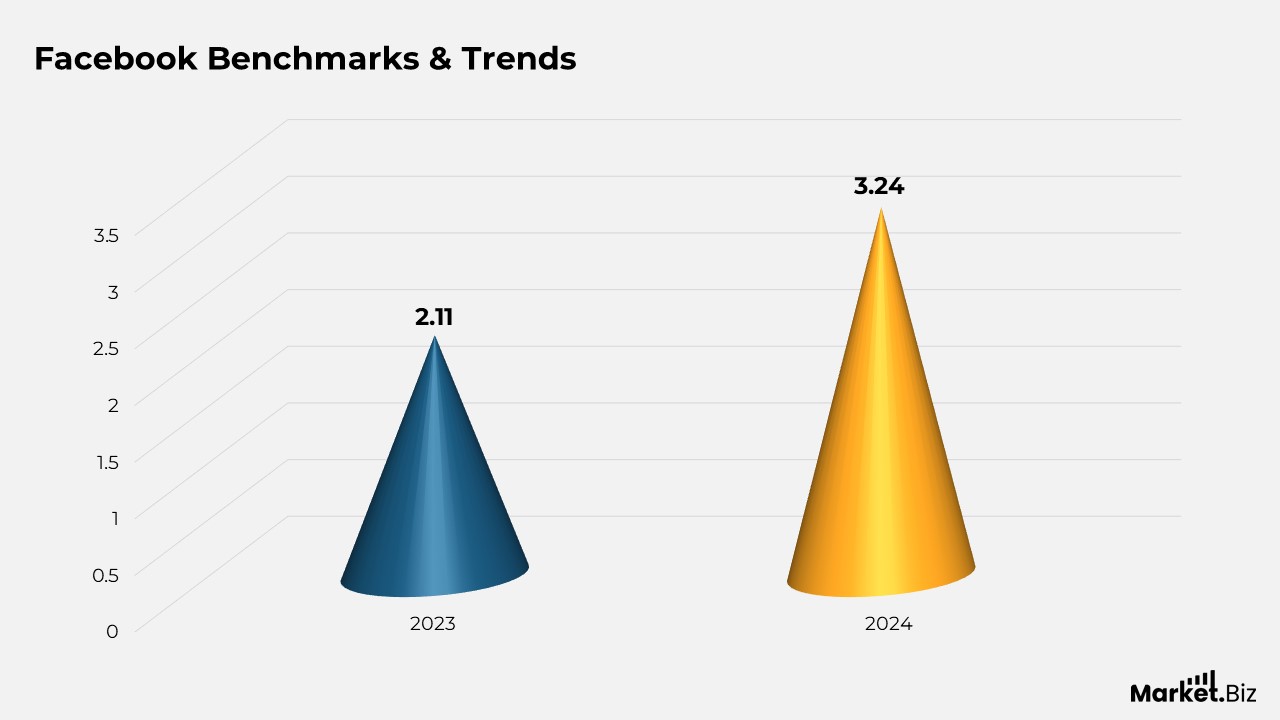
FB Benchmarks & Trends
- As of the fourth quarter of 2023, Facebook announced that it has 2.11 billion daily active users.
- As of the fourth quarter of 2023, Facebook disclosed that it has 3.07 billion active monthly users.
- Facebook’s advertising revenue in the United States is projected to reach $32.55 billion in 2024.
- Facebook ranks as the second most used online platform, surpassed only by YouTube.
- Facebook is recognized as the leading social media platform for marketing purposes.
- A significant 84% of B2C marketers who engaged in paid social advertising over the past year used Facebook, more than any other platform.
- In a survey conducted among B2C marketers, 88% of participants indicated that Facebook ads are at least “somewhat effective.”
- 29% of B2B content marketers believe that Facebook provides the best value for their organization, trailing only LinkedIn, which has an 84% share.
- As of the first quarter of 2024, Facebook reported having 3.24 billion daily active users across its platforms, including Facebook, Instagram, Messenger, and WhatsApp.
- Advertisements on Facebook reach 27.7% of the global population.
- 49.2% of Facebook advertisers track the performance of their ad campaigns on a daily basis.
- E-commerce companies generally allocate less than $2,500 per month for Facebook advertising.
Facebook Ads Best Practices
- Facebook recommends that the dimensions for images used in feed advertisements should not fall below 1080 x 1080 pixels.
- In a study analysing 752,626 Facebook advertisements, AdEspresso discovered that the median length of a headline consists of 5 words.
- The same research conducted by AdEspresso revealed that the average advertisement comprises 19 words.
- The five most frequently employed call-to-action buttons in Facebook ads include Contact Us, Learn More, Call Now, Sign Up, and Download.
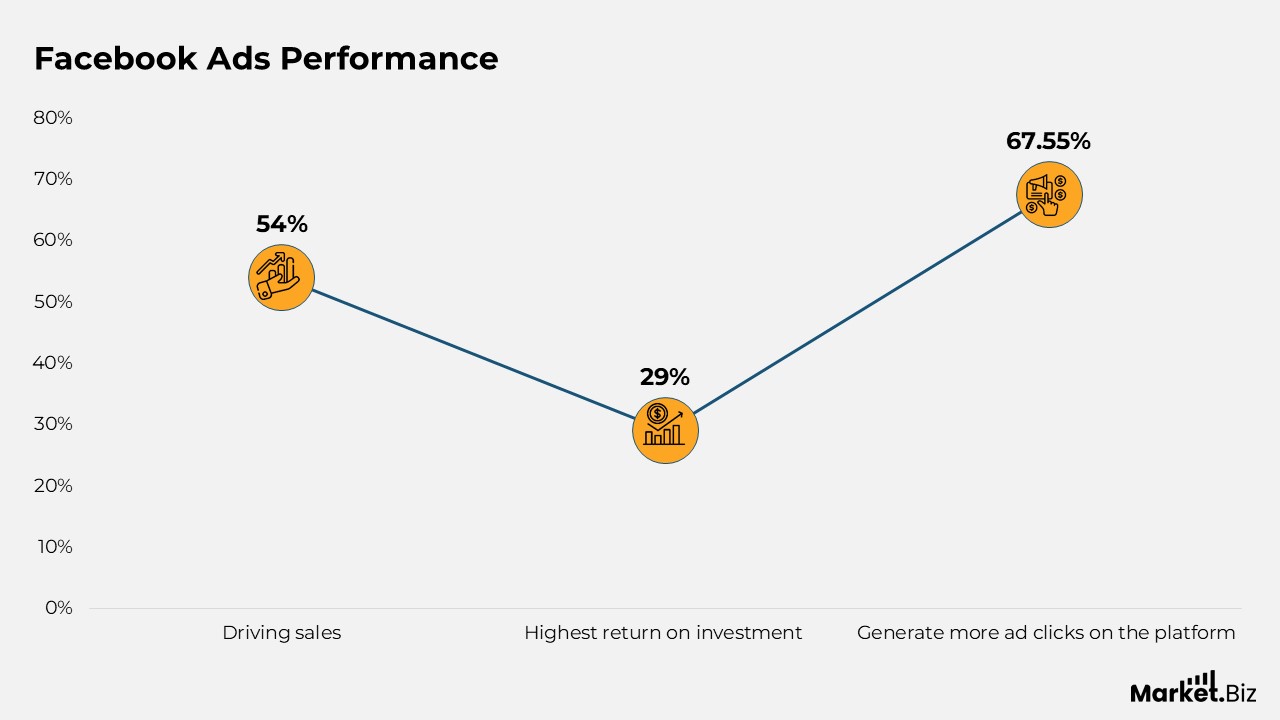
FB Ads Performance
- 54% of marketers surveyed indicate that Facebook advertisements are considered “very effective” in driving sales, while only 8% assert that they are ineffective.
- 29% of marketers report that using Facebook has yielded the highest return on investment (ROI) for their organization, surpassing all other social media platforms.
- 67.55% of advertisers on Facebook believe that videos generate more ad clicks on the platform than other types of content.
- For 42.9% of marketers surveyed, the optimal audience size for Facebook ads is over 50,000 users.
- A study conducted by Databox revealed that the average click-through rate (CTR) for Facebook Ads across all industries is 1.44%.
- The median cost-per-click (CPC) for Facebook Ads stands at $0.54.
- As of the first quarter of 2024, the cost per mile (CPM) for Facebook Ads has decreased by 2% compared to the previous year.
- A recent analysis determined that the average cost per mile (CPM) for Facebook Ads is $1.12.
- In 2024, the average cost per mile (CPM) for Facebook Ads in the United States reached $4.29, which is 3.83 times higher than the global average.
- Facebook’s advertising revenue in the United States is projected to reach $32.55 billion in 2024, reflecting a year-over-year growth of 7.2%.
- The same Metricool study indicated that the average cost per mile (CPM) for Facebook ads associated with the Leads campaign is $3.36.
- An examination of 675 B2C companies revealed that the median return on ad spend (ROAS) for Facebook Ads is 1.79.
- Data from 636 B2C companies indicates that the median return on ad spend (ROAS) for Facebook Ads is 1.8, which is nearly identical to the B2C figures.
- A study by Wordstream found that the average cost-per-action on Facebook Ads is $19.68.
Facebook Key Strategies
- Use Facebook’s Advantage+ Shopping Campaigns to automate ad placements and enhance creative optimization. This AI-powered tool decreases setup time by 70% while increasing conversions by 15%.
- Employ AI tools that assess user behavior to forecast which audiences are more inclined to engage or convert. Integrating these insights can improve lead generation and minimize unnecessary advertising expenditures.
- Platforms such as Reels are expected to generate over 200 billion daily views in 2025. Advertisers should focus on producing captivating, vertical video content for Stories and Reels.
- Facebook Live generates three times the engagement compared to traditional video posts. Leverage Live to connect with audiences in real-time, host events, or present new products.
- With more than 98.5% of Facebook users accessing the platform through mobile devices, it is essential to design ads for mobile-first consumption.
- Improve product listings on Facebook Shops to facilitate seamless in-app purchases. Over 1 million users worldwide interact with Facebook Shops each month.
- Collaborate with influencers to boost product awareness. In 2025, it is anticipated that 71.5% of U.S. influencers will use Facebook for marketing purposes.
- Allocate 10-30% of your advertising budget for testing new tools like Advantage and 70-90% for established campaigns.
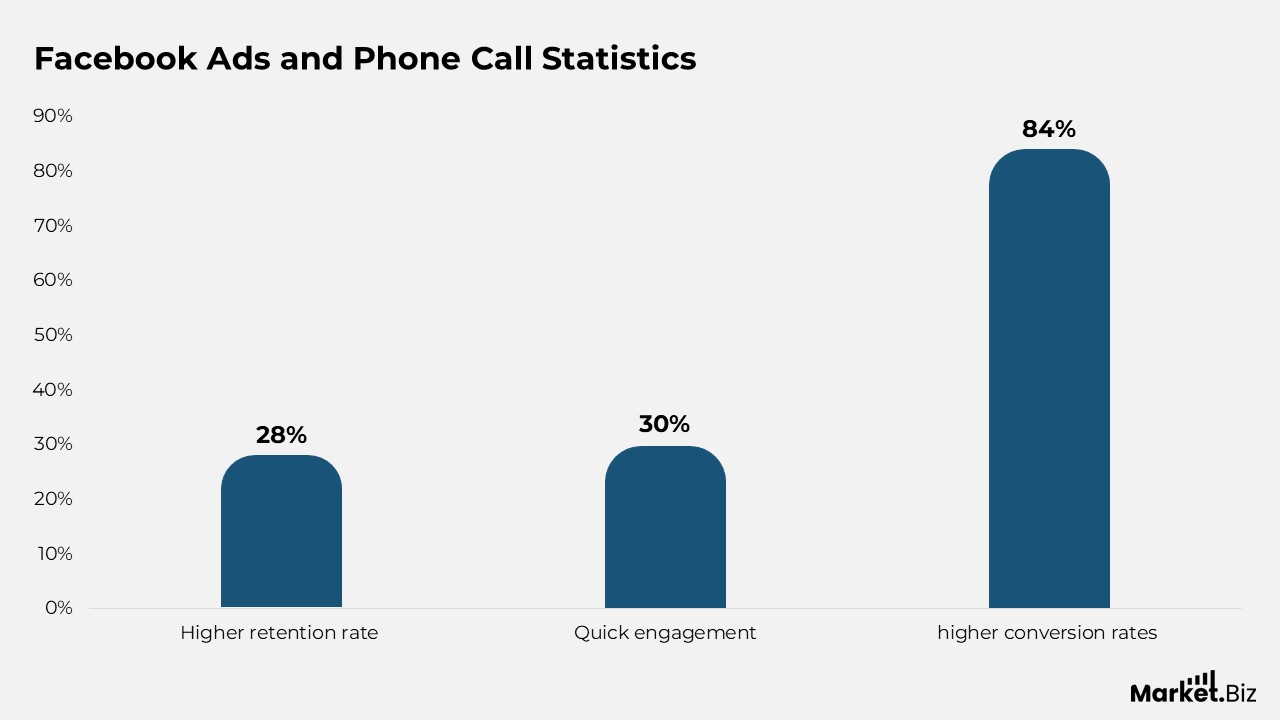
FB Ads and Phone Call Statistics
- In 2019, social media advertisements generated 36.4 million calls to businesses in the United States.
- These calls are projected to impact $1 trillion in consumer spending within the US this year. In our mobile-centric environment, calls frequently represent the most efficient method for customers to make a purchase.
- 41% of companies indicate that they have enhanced their phone conversion rates by 25% or more over the last year.
- Phone calls yield 10 to 15 times more revenue than leads generated through websites. Calls are among the most significant conversions that marketers can achieve through Facebook.
- Individuals who call change 30% more quickly than those who engage through web leads. Calls offer a more immediate return on marketing investments.
- The retention rate for callers is 28% higher than that of web leads. Generating calls through Facebook advertisements is also advantageous in the long run. As callers tend to exhibit greater loyalty than web leads.
- 84% of marketers observe that phone calls result in higher conversion rates with a greater average order value (AOV) compared to other engagement methods.
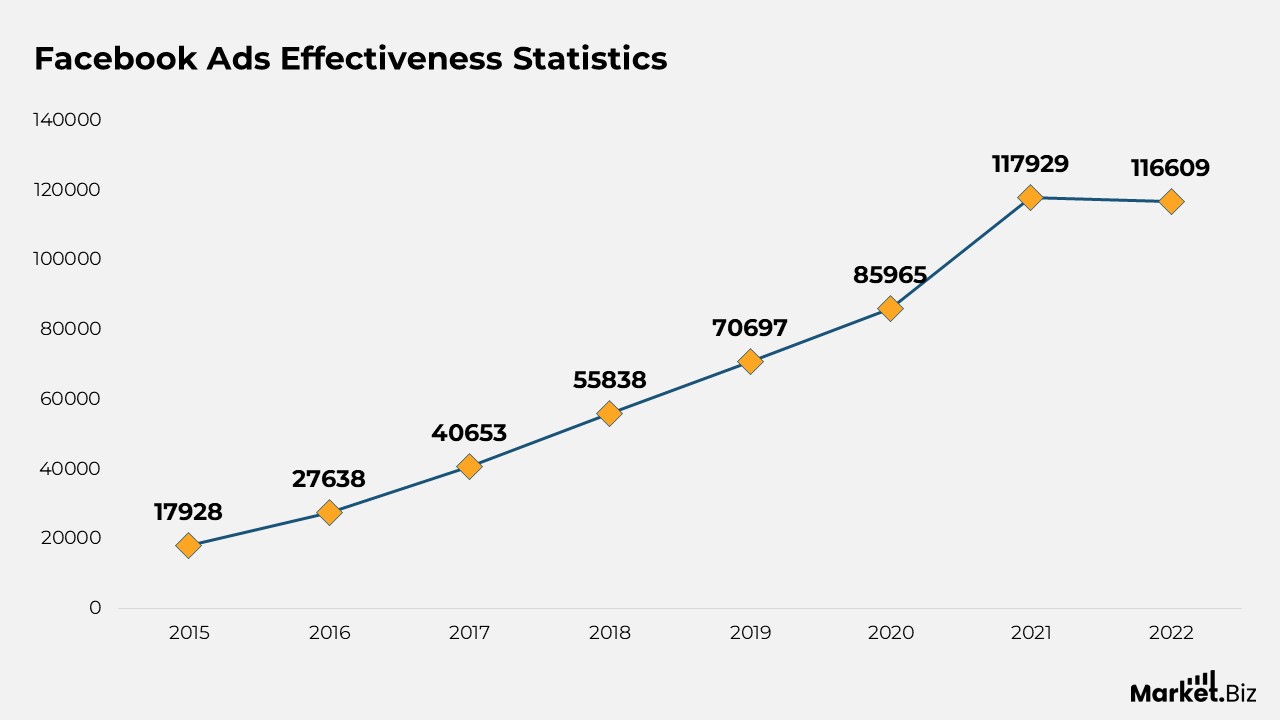
FB Ads Effectiveness Statistics
- Advertisements on Facebook featuring four-word titles demonstrate the highest performance.
- In 2019, social media advertisements resulted in 36.4 calls to businesses in the United States alone.
- 54% of marketers surveyed regard Facebook Ads as “very effective” in generating sales, while merely 8% deemed them ineffective.
- The average cost per click for Facebook Ads is $0.54.
- According to an analysis by Metricool, app promotion campaigns faced the highest cost per click at $0.32 among Facebook ads. While Traffic campaigns had the lowest cost at $0.04, which is 22 times less.
- Facebook recommends that the image dimensions for feed ads should not be smaller than feed pixels.
- The five call-to-action buttons that received the highest number of clicks in Facebook advertisements are Learn More, Contact Us, Sign Up, Call Now, and Download.
- An examination of 12 million ad sets on Facebook revealed that vertical videos featuring audio attained a conversion rate that was 12% greater than that of other video formats.
- Vertical videos with audio, including Reels ads, saw a click-through rate that was 35% higher than that of other types of advertisements.
- Video ads optimized for mobile on Facebook, especially those designed as 15 seconds or in a vertical format. Experienced a conversion cost that was 12.3% lower than that of non-optimized video ads.
- A significant 84% of B2C marketers who participated in paid social advertising in the past year favoured Facebook over all other platforms.
Conclusion
In 2024, Facebook continues to be deeply embedded in the business ecosystem. Driven by robust user engagement and growth in advertising revenue. This platform with its extensive reach. Has transformed into a digital environment that allows businesses to connect with their audience using advertising tools and AI integration. As a highly dynamic platform, Facebook is essential for any business aiming to establish a digital presence and meet its marketing objectives.
FAQs
The cost of Facebook advertisements is influenced by various factors. Including the type of industry, target audience, types of ad objectives, and bid types. Typically, businesses allocate a budget ranging from as low as $1 to as high as $500 per month for Facebook ads. The actual costs can vary significantly based on the chosen strategy and objectives.
The minimum expenditure for running Facebook ads is set at $1 per day for campaigns based on impressions or CPM, and $5 per day for campaigns focused on clicks, likes, or video views.
For in-stream advertisements, creators can anticipate earning approximately $48 for every 10,000 views, on average; however, this figure may fluctuate based on factors such as the geographical locations of viewers and the level of engagement with the ads.