
Introduction
Mobile Application Statistics: The mobile application landscape has swiftly become a vital part of modern life, significantly changing how individuals connect, work, shop, and access information. As smartphones become more deeply embedded in daily habits, mobile apps have taken center stage as the main platform for delivering digital services across industries such as social networking, entertainment, finance, healthcare, and education.
This widespread reliance has fueled steady expansion in both app development and usage. With increasing demand for personalized, efficient, and intuitive digital experiences, businesses and developers are prioritizing innovation and user-focused solutions.
In light of this, evaluating mobile application statistics is essential to grasp shifting usage behaviors, engagement levels, and emerging market dynamics. These insights not only reflect user expectations but also serve as a strategic guide for shaping the future of mobile app growth.
Editor’s Choice
- The Apple App Store currently features a library of approximately 1.96 million downloadable applications.
- The Google Play Store offers users access to around 2.87 million apps.
- Roughly 21% of Millennials engage with mobile apps more than 50 times per day.
- Nearly 49% of users open an app at least 11 times daily, reflecting high engagement levels.
- Mobile applications account for nearly 70% of all digital media time spent in the United States.
- On average, smartphone users access around 10 apps daily and use about 30 apps each month.
- Between 2021 and 2024, mobile app usage is projected to grow at a CAGR of 20%.
- The mobile user base in the U.S. is expected to reach 292 million in the coming year.
- About 49% of Millennials express dissatisfaction with apps that significantly drain battery life.
- Global first-time mobile app installs are anticipated to reach 183.7 billion by 2024.
- Approximately 88% of mobile device usage time is spent within apps.
- Privacy and security concerns lead 29.6% of users to uninstall apps.
- An estimated 70% of users abandon apps that exhibit slow performance.
- Persistent push notifications prompt 71% of users to remove apps from their devices.
AI Technology Share Across Mobile App Platforms
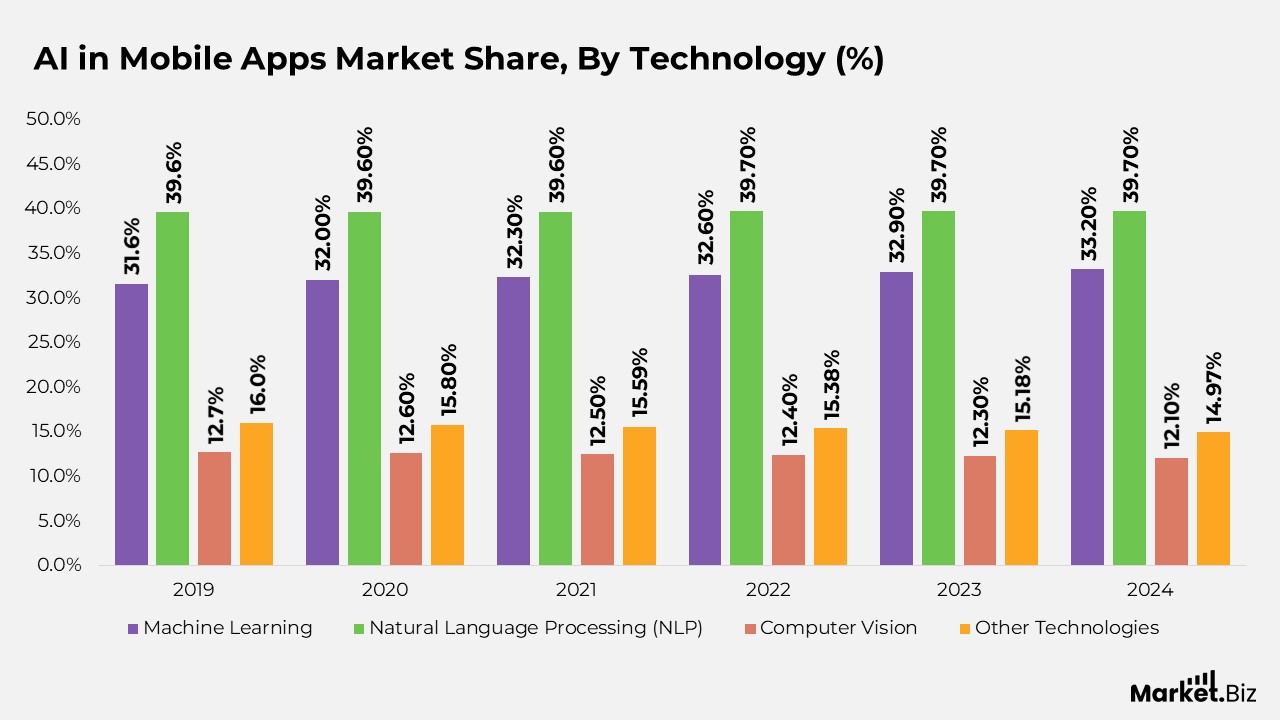
- The machine learning segment consistently grew from 31.6% in 2019 to 33.2% in 2024, indicating a steady increase in its integration within mobile applications.
- The Natural Language Processing (NLP) segment remained dominant, maintaining a stable market share of 39.6% between 2019 and 2021, and slightly increasing to 39.7% from 2022 to 2024.
- The computer vision segment experienced a gradual decline, decreasing from 12.7% in 2019 to 12.1% in 2024, reflecting slower adoption relative to other AI technologies.
- The other technologies category witnessed a steady reduction in market share, falling from 16.01% in 2019 to 14.97% in 2024, as focus shifted toward more prominent AI capabilities like NLP and machine learning.
(Source: Market.us)
Breakdown of AI Integration in Mobile Apps by Use Case
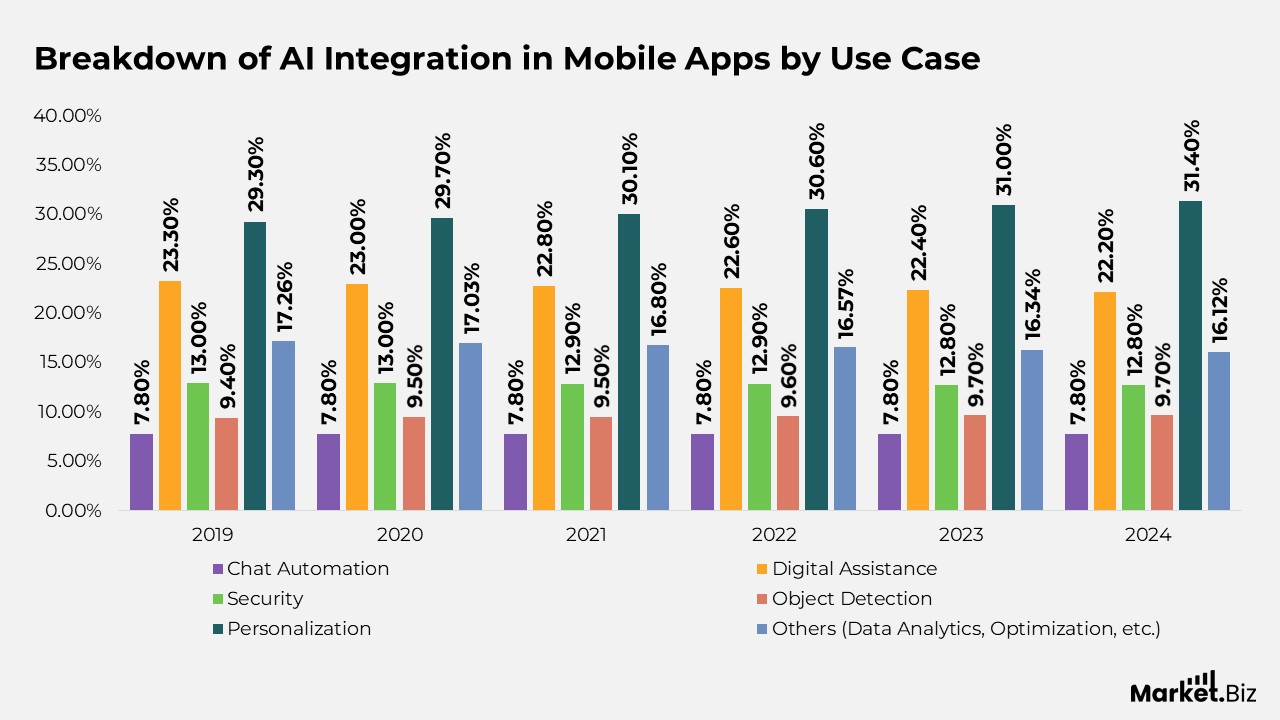
- The chat automation segment maintained a steady market share of 7.8% from 2019 to 2024, indicating consistent but limited integration of this functionality in mobile AI applications.
- The digital assistance segment experienced a gradual decline, decreasing from 23.3% in 2019 to 22.2% in 2024, likely due to market saturation and the emergence of more advanced AI use cases.
- The security segment remained relatively stable, with a slight dip from 13.0% in 2019 to 12.8% in 2024, signalling a marginal decrease in its application share within the AI landscape.
- The object detection segment saw modest growth, rising from 9.4% in 2019 to 9.7% in 2024, largely driven by its expanding role in camera-based features and augmented reality applications.
- The personalization segment showed consistent upward momentum, increasing from 29.3% in 2019 to 31.4% in 2024, reflecting strong consumer preference for customized user experiences in mobile apps.
- The other segment, which encompasses functionalities such as data analytics and process optimization, declined from 17.26% in 2019 to 16.12% in 2024, as focus shifted toward dominant AI applications like personalization and NLP.
(Source: Market.us)
AI in Mobile Apps Market Size
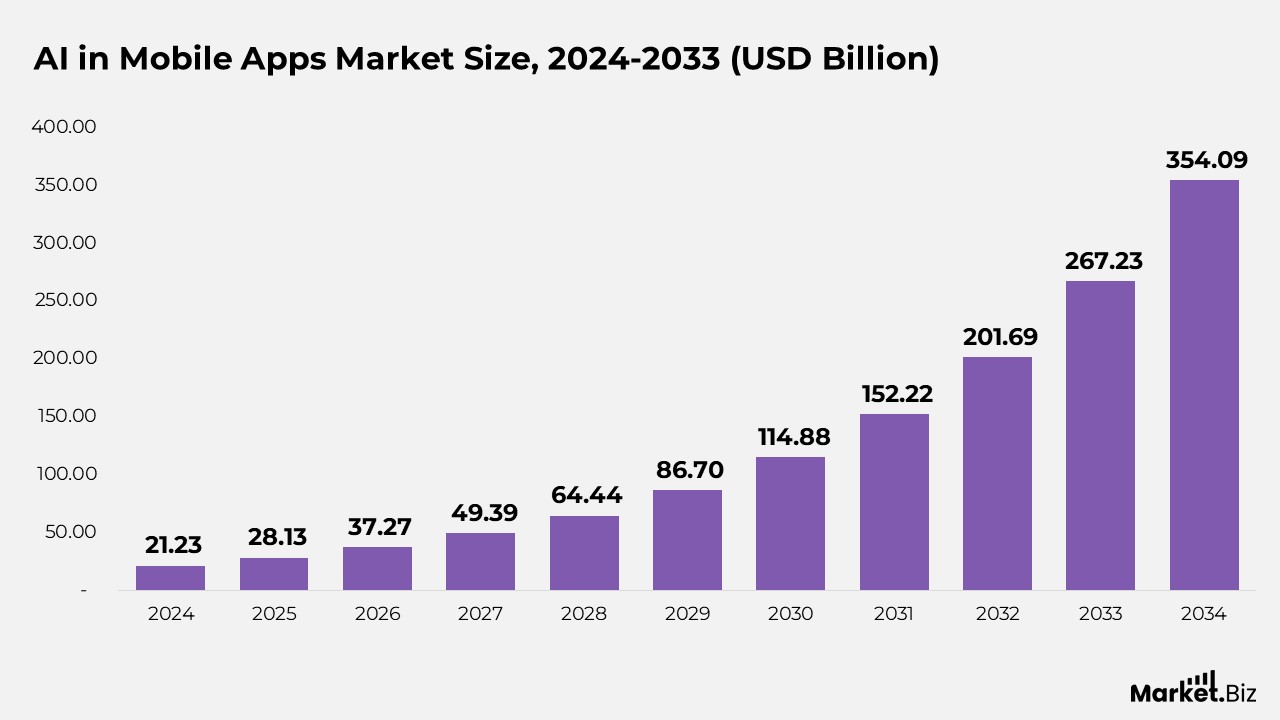
- According to Market.us, the AI in mobile apps market is expected to rise from $28.13 billion in 2025 to $354.09 billion by 2034, representing a compound annual growth rate (CAGR) of 32.5% from 2025 to 2034.
- The AI in the mobile apps market is expanding due to rising demand for intelligent, personalized, and engaging user experiences.
- In 2024, the Natural Language Processing (NLP) segment led the market with a share exceeding 39.7%, fueled by its integration in voice and text-based interactions.
- The personalization segment held a share of over 31.4% in 2024, reflecting strong consumer demand for custom app experiences.
- The iOS platform accounted for more than 52.1% of the market in 2024, driven by high-end device usage and Apple’s integrated ecosystem.
- The entertainment application segment dominated with a market share above 53.6% in 2024, driven by AI-powered streaming and gaming apps.
- The Asia-Pacific (APAC) region led the global market in 2024, securing over 55.34% share and generating US$11.7 billion in revenue, owing to high smartphone adoption in China and India.
- According to MindInventory, over 230 million people globally use AI-powered mobile applications.
- Siri holds a 36% share among voice assistants, serving more than 660 million users monthly.
- Around 66% of businesses are planning AI investments to improve mobile app features, user interaction, and operational performance.
(Source: Market.us)
End-Use Application Breakdown of AI in Mobile Apps Market
| By End Use Apps (%) | 2019 | 2020 | 2021 | 2022 | 2023 | 2024 |
|---|---|---|---|---|---|---|
| Social Media, Communication & Connectivity | 6.4% | 6.4% | 6.3% | 6.3% | 6.3% | 6.3% |
| Voice & Video Communication Apps | 22.6% | 22.4% | 22.1% | 21.9% | 21.6% | 21.4% |
| Text Messaging Apps | 9.9% | 10.1% | 10.3% | 10.5% | 10.7% | 10.9% |
| Email Apps | 2.7% | 2.7% | 2.7% | 2.7% | 2.7% | 2.7% |
| Social Media Apps | 64.7% | 64.8% | 64.9% | 64.9% | 65.0% | 65.1% |
| Information & Utility | 0.6% | 0.6% | 0.6% | 0.6% | 0.5% | 0.5% |
| Mobile Browser | 27.0% | 27.0% | 27.0% | 27.0% | 26.9% | 26.9% |
| Navigation Apps | 58.2% | 58.4% | 58.7% | 59.0% | 59.2% | 59.5% |
| Others | 14.8% | 14.5% | 14.3% | 14.1% | 13.9% | 13.6% |
| Entertainment | 55.2% | 54.9% | 54.5% | 54.2% | 53.9% | 53.6% |
| Video Streaming Apps | 9.6% | 9.7% | 9.8% | 10.0% | 10.1% | 10.2% |
| Music Streaming Apps | 3.3% | 3.3% | 3.3% | 3.3% | 3.4% | 3.4% |
| Mobile Gaming Apps | 81.0% | 80.8% | 80.5% | 80.3% | 80.0% | 79.7% |
| E-books/Audiobooks | 0.7% | 0.7% | 0.6% | 0.6% | 0.6% | 0.6% |
| Educational Apps | 4.1% | 4.2% | 4.4% | 4.5% | 4.7% | 4.8% |
| Others | 1.3% | 1.3% | 1.3% | 1.3% | 1.2% | 1.2% |
| Productivity | 16.2% | 16.3% | 16.4% | 16.6% | 16.7% | 16.8% |
| Document Editing | 3.1% | 3.1% | 3.1% | 3.0% | 3.0% | 3.0% |
| Collaboration Tools | 1.6% | 1.6% | 1.5% | 1.5% | 1.5% | 1.5% |
| Calendar Scheduling & Reminders | 0.5% | 0.5% | 0.5% | 0.5% | 0.5% | 0.5% |
| Photo & Video Apps | 15.0% | 15.3% | 15.5% | 15.8% | 16.1% | 16.3% |
| Mobile Wallets | 0.2% | 0.2% | 0.2% | 0.2% | 0.2% | 0.2% |
| E-commerce Shopping Apps | 3.6% | 3.6% | 3.7% | 3.7% | 3.7% | 3.7% |
| Travel & Tourism Apps | 0.1% | 0.1% | 0.1% | 0.1% | 0.1% | 0.1% |
| Health & Wellness Apps | 0.6% | 0.6% | 0.6% | 0.6% | 0.6% | 0.6% |
| Others | 2.1% | 2.1% | 2.0% | 2.0% | 2.0% | 2.0% |
(Source: Market.us)
Mobile Esports Market Size
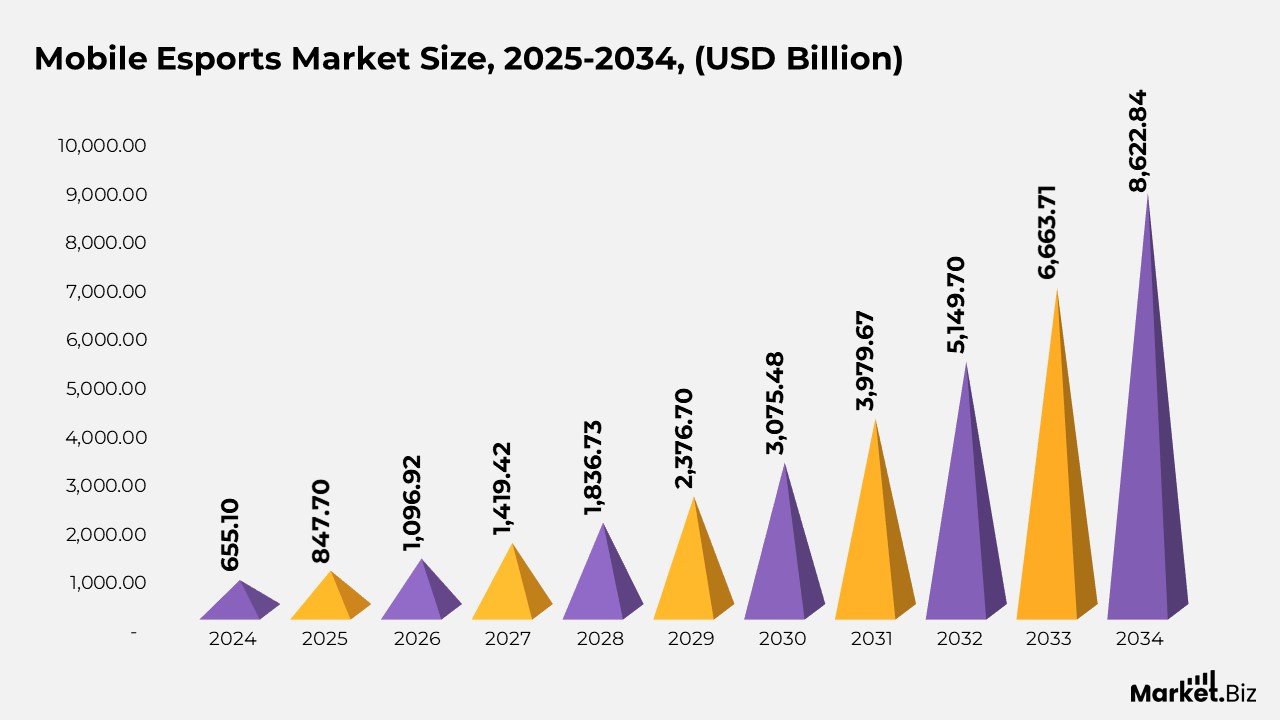
- According to Market.us, the mobile esports market is expected to grow from $847.70 billion in 2025 to $8,622.84 billion by 2034, representing a compound annual growth rate (CAGR) of 29.4% from 2025 to 2034.
- Market growth is being propelled by the widespread availability of smartphones, enabling users to participate in mobile esports from virtually any location.
- In 2024, the Multiplayer Online Battle Arena (MOBA) segment led the mobile esports market with a share exceeding 25.1%, driven by strategic gameplay and strong community involvement.
- The advertising segment dominated the monetization landscape in 2024, accounting for over 30.6% of the market due to the effective integration of ads into mobile gaming environments.
- North America held a market-leading position in 2024, capturing more than 30.4% of the market and generating revenues of approximately US$199.15 million, supported by strong tech infrastructure and high mobile gaming adoption.
- The U.S. Mobile Esports Market was valued at around US$179.2 million in 2024 and is expected to grow from US$229.2 million in 2025 to approximately US$2,099.1 million by 2034, expanding at a projected CAGR of 27.9% during 2025–2034.
(Source: Market.us)
General Mobile Application Statistics
- On average, individuals have 40 apps installed on their smartphones, yet they actively use only 18 of them regularly.
- Among Millennials, the app count is even higher, with more than 67 apps installed, but only 25 being frequently used.
- Typically, a user interacts with 9 apps daily and around 30 apps monthly, reflecting core usage habits.
- The Apple App Store sees Business (10.35%), Games (12.68%), and Education (9.79%) as its most populated categories by app share.
- Similarly, the Google Play Store is dominated by Games (13.63%), followed by Business (7.17%), and Education (10.41%).
- A global study found that just 20% of mobile app usage time is spent on top-ranking apps, while the remaining 80% is dedicated to lesser-known apps, showcasing user preference diversity.
- One app, despite surpassing 53 million downloads across Google Play and the Apple App Store, sees engagement from only 9% of Android users, pointing to high install-dropoff rates.
- The Google Play Store currently offers twice as many apps as the Apple App Store, underlining its broader app availability.
(Source: Statista, Social Plus Holdings Ltd)
Mobile Application Downloads Statistics
- Global mobile app downloads are projected to hit 352.9 billion by 2024, highlighting the scale of digital engagement.
- By 2026, global app downloads are forecasted to surpass 143 billion, reflecting sustained growth in mobile adoption.
- In the upcoming year, total app downloads are expected to exceed 165 billion, reinforcing steady consumer demand.
- Each quarter, the Google Play Store and Apple App Store collectively generate approximately 35–36 billion app downloads.
- In 2022, there were over 255 million new mobile app installs recorded across platforms.
- From 2019 to 2020, total global app downloads surpassed the 250 million mark.
- iOS users downloaded 600 million more apps in 2022 compared to 2021, showcasing rising engagement among Apple device users.
- Google Play downloads declined by 2.6% in 2022, indicating a minor dip amid overall market growth.
- Over five years, the mobile app download rate experienced an average annual increase of 63.5%, showing a robust growth trajectory.
- App downloads dropped from 64.6 billion to 62.9 billion during the same year, signaling a brief slowdown in platform-specific performance.
Moreover
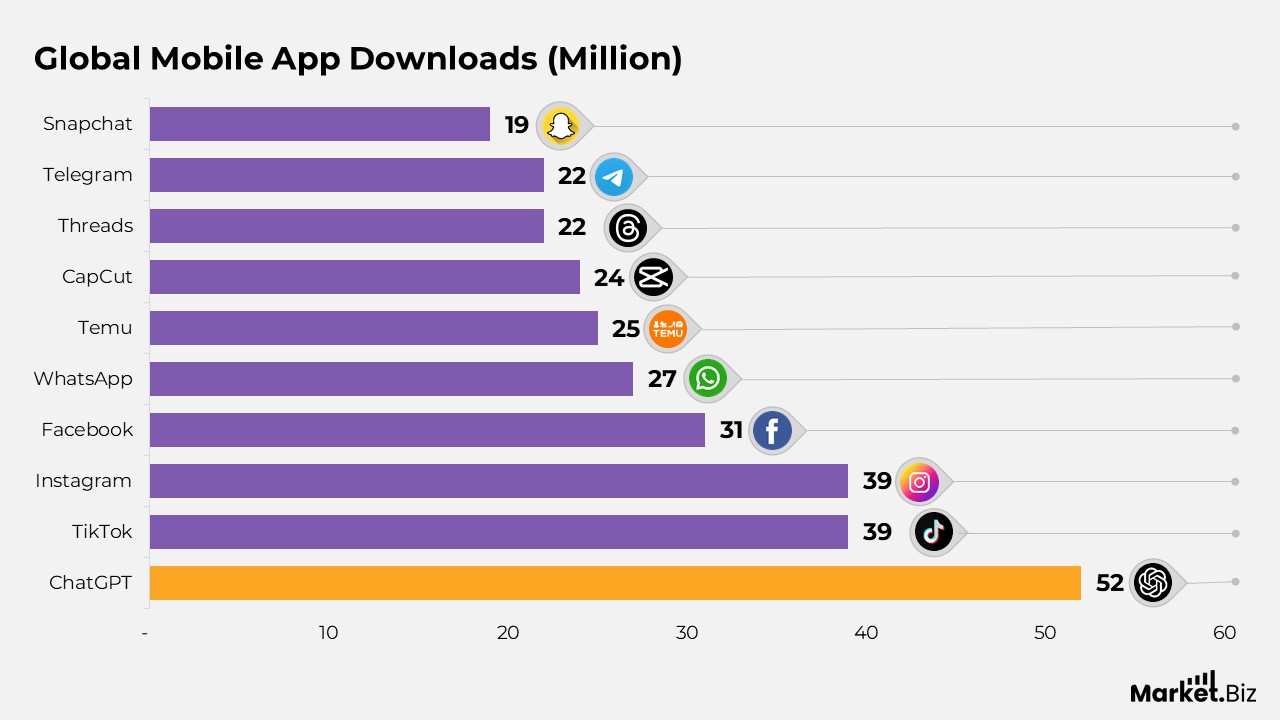
- In April 2025, ChatGPT topped the global download charts, reaching over 52 million installs, showcasing its rapid rise in popularity among diverse user groups.
- Both TikTok and Instagram recorded strong performances, each amassing 39 million downloads, reinforcing their dominance in the social media landscape.
- Facebook continued to remain a widely used platform with 31 million downloads, supported by its extensive user network and integrated services.
- WhatsApp secured around 27 million downloads, further cementing its position as a leading global messaging application.
- The emerging e-commerce platform Temu gained momentum with 25 million downloads, signalling its growing footprint across new markets.
- CapCut, known for its user-friendly video editing features, drew in 24 million users, benefiting from its close connection with TikTok creators.
- Threads, Meta’s newly launched text-sharing app, attracted 22 million downloads, reflecting curiosity and demand for fresh social experiences.
- Telegram matched Threads with 22 million downloads, highlighting steady growth driven by its commitment to privacy and secure messaging.
- Closing the top 10, Snapchat registered 19 million downloads, continuing to resonate with younger demographics through its AR filters and messaging capabilities.
(Source: Netweb Technologies, Statista, Semrush Inc)
Mobile Application Usage Statistics
- Despite a 2% decline in global consumer spending, app downloads and time spent on apps rose by 11% and 9%, respectively.
- Around 35% of Millennials consider Amazon the most vital mobile app, followed closely by Facebook (29%) and Gmail (30%).
- Globally, 18 out of every 100 downloaded apps are used only once after installation.
- Only 65.7% of U.S. smartphone users had at least one gaming app installed.
- Combined, YouTube (12.7%), TikTok (17%), and WeChat (19.5%) account for 50% of total online time.
- 3 out of 5 smartphone users opt not to install an app when completing a transaction.
- 25% of users uninstall apps due to a lack of storage space on their devices.
- About 71% of users abandon an app within 3 months of installing it.
- In 2022, total new mobile app downloads reached approximately 255 billion.
- In the previous year, apps were downloaded at an astounding rate of 485,000 downloads per minute.
- Outside of work hours, users spend nearly one-third of their time, around 5 hours daily, on mobile activities.
- In 2022, gaming apps faced a setback as demand shifted toward essential service apps, while non-gaming apps witnessed significant growth.
- By 2022, over 1,419 apps and games generated more than US$10 million in annual revenue.
- Of these, around 224 apps surpassed US$100 million in yearly earnings, and 10 gaming apps exceeded US$1 billion in annual revenue.
- Gen Z shows high engagement with video content, user-generated content, and mindfulness apps.
- On Black Friday, Amazon attracted more active users than Walmart and Target combined.
- By 2022, global social app usage time surpassed a record-breaking 2 trillion hours.
- Approximately 56.9% of Americans admit to being addicted to their mobile devices.
(Source: Digital Gravity, Statista)
Google Play vs. App Store Statistics
- By Q1 2021, the Google Play Store hosted approximately 3.48 million apps, while the Apple App Store featured around 2.22 million apps for iOS users.
- In 2020, Google Play recorded about 108.5 billion app downloads, whereas the App Store saw 34.4 billion downloads.
- Google Play supports nearly twice as many app publishers as the Apple App Store.
- By 2022, Google Play was projected to reach 119 billion app downloads, compared to the App Store’s slower growth at 40 billion downloads.
- As of May 2021, the App Store generated more revenue than Google Play, despite Android holding a 71.44% global share of mobile and tablet OS compared to 27.77% for iOS.
(Source: Statista, Yondu Inc., Business of Apps, TechJury, Cell Phone Deal, Cybercrew)
Global Trends in Mobile Application Consumption
- In the past year, global users downloaded 255 billion apps, equivalent to about 33 apps per person worldwide.
- India surpassed both the U.S. and China combined in total app downloads.
- Brazilian users average 12 new app downloads per month, placing them among the most active globally.
- Around 1 in 4 users delete a mobile app after using it just once.
- Gaming apps led the download charts with 8.2 billion downloads in Q3 2023, while productivity apps saw the fastest growth.
- Although 97% of downloaded apps are free, users are increasingly embracing subscription-based models.
- Dating apps have seen a 95% surge in downloads since 2019, showing rising demand.
- Tinder alone records an astounding 1.6 billion swipes per day.
- 65% of iOS users rely on search rather than browsing to discover and download apps.
- Instagram is downloaded 22 times every second, reflecting its enduring popularity.
- Educational app downloads spiked 85% during lockdown and continue to grow steadily.
- 70% of Gen Z users discover new apps through social media instead of app stores.
- Health and fitness apps reach their highest download volumes every January, in line with New Year’s resolutions.
- Finance apps have grown by 160% compared to pre-pandemic levels.
- Many viral apps now gain traction in Asia first before becoming popular in Western markets, as seen with TikTok.
- About 25% of apps are uninstalled within a day, and only 3% retain active users 30 days post-download.
- WhatsApp achieved a massive milestone with 5 billion downloads in 2023.
(Source: Statista, Admito Technologies Private Limited, Apptica, Techcrunch, Business Insider, Business of Apps, Weforum, Liftoff Report, Applause)
Mobile Application Store Statistics
- The Google Play Store hosts over 3.7 million apps available for download.
- Of these, approximately 500,000 are dedicated to gaming, while the remaining 3.2 million are non-gaming apps.
- There are around 1.15 million app publishers listed on the Google Play Store.
- Out of the total apps on Google Play, about 3.2 million (85%) are non-gaming apps, while 533,000 (14%) are gaming apps.
- The Apple App Store offers more than 1.7 million apps for download.
- There are 735,000 app publishers in the Apple App Store.
- In the iOS App Store, roughly 1.5 million (87%) of the apps are non-gaming, while 214,000 are gaming apps (12%).
- The Google Play Store accounts for 77% of all global mobile app downloads.
- The Amazon App Store has more than 480,000 apps available for download.
- The Microsoft App Store (previously known as the Windows App Store) features over 800,000 apps.
(Source: Statista, 42matters, Windows Report, Fifty Pixels Ltd.)
Mobile Application Development Trends
- The typical timeline for app development is 7.3 months, although more complex apps may take up to 12 months to complete.
- The average cost of developing an app before its launch is around $270,000, with some high-end apps reaching up to $350,000 depending on feature complexity. However, 80% of apps exceed their initial budget.
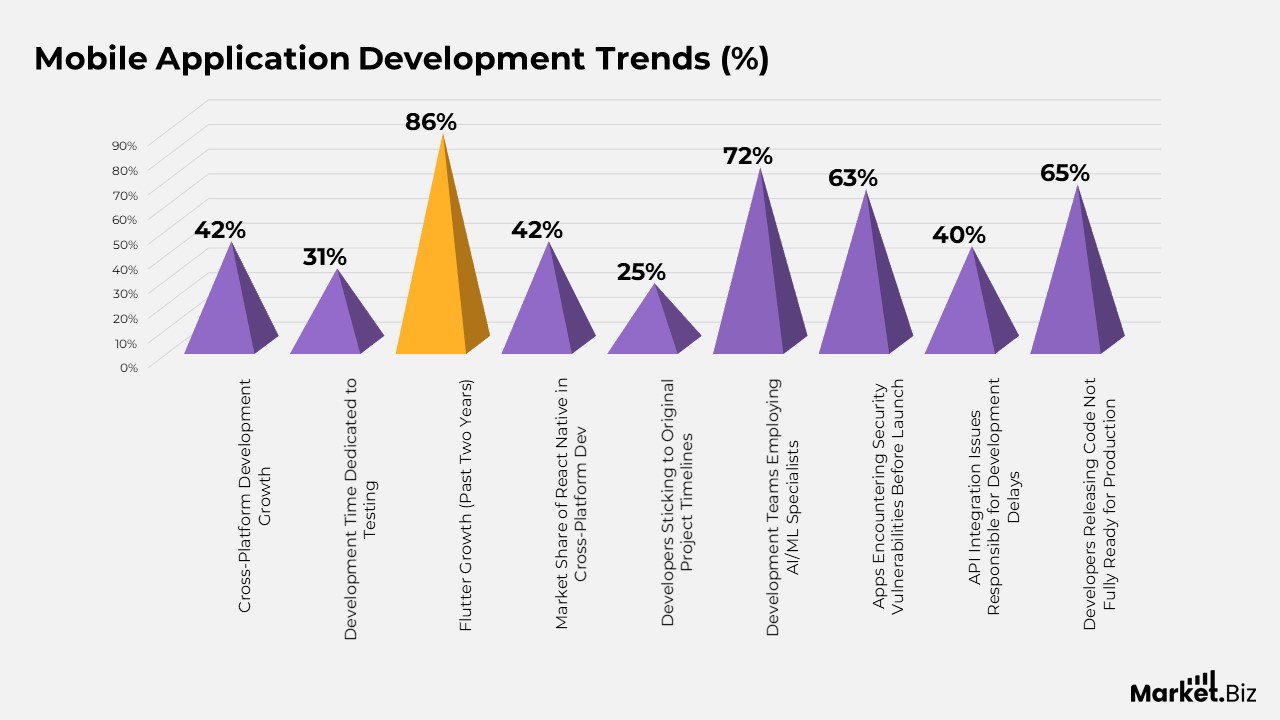
- Cross-platform development has surged by 42%, as developers aim to make apps accessible on multiple platforms.
- 31% of the development time is dedicated to testing.
- Flutter, however, is rapidly gaining ground, experiencing an impressive 86% growth over the past two years.
- React Native currently leads the cross-platform development space, holding 42% of the market share.
- Only 25% of developers manage to stick to their original project timelines.
- Around 72% of development teams now employ AI/ML specialists to optimize app functionality and performance.
- On average, teams now release updates every 12 days, a significant improvement from the 30-day average in 2020.
- UX testing typically identifies 4-6 major issues per app that require attention.
- 63% of apps encounter security vulnerabilities before they are launched.
- API integration issues are responsible for 40% of development delays.
- The latest trend in development is Low-code platforms, which have seen an impressive 282% growth since 2020.
- 65% of developers admit to releasing code that they knew wasn’t fully ready for production.
(Source: Biz4solutions, Business of Apps, Goodfirms, Admito Technologies Private Limited, Scaleupally, Gitlab, Statista)
Conclusion
The mobile app landscape is rapidly advancing, fueled by the global spread of smartphones, rising user engagement, and innovations like AI and cloud technologies. Mobile applications now play a vital role in everyday life, spanning communication, entertainment, shopping, and productivity.
Current trends reveal not only a surge in download numbers but also a shift toward demand for more personalized and high-performing app experiences. As users place greater emphasis on speed, privacy, and ease of use, developers and businesses are compelled to innovate, streamline performance, and deliver user-focused solutions.
With mobile app adoption expected to continue its upward trajectory, the industry is poised for sustained growth, offering vast potential for innovation and competitive advantage.
FAQ’s
As of 2025, users can choose from a vast selection of apps, with the Google Play Store hosting around 2.87 million apps and the Apple App Store offering approximately 1.96 million apps for download.
Most smartphone users actively use about 9 apps each day and 30 apps per month, despite having 40 or more apps installed on their devices.
Games, Business, and Education continue to be the leading app categories on both the Apple App Store and Google Play Store, making up the highest share of available apps.
Mobile applications account for a significant portion of digital interaction—88% of total mobile time is spent in apps, and in the U.S., apps represent roughly 70% of all digital media usage.
The most common reasons for uninstalling apps include excessive push notifications (71%), lagging performance (70%), concerns over data privacy (29.6%), and high battery usage (49%).
By 2024, total app downloads across the globe are expected to reach an impressive 352.9 billion, showing strong and sustained user demand.
Yes, although growth patterns vary by platform, Google Play downloads dipped by 2.6% in 2022, whereas iOS downloads increased by 600 million compared to the previous year.
Interestingly, only 20% of app usage is concentrated on top-tier apps, while 80% is spread across lesser-known or niche applications, underscoring diverse user preferences.