
Introduction
Smart wearables statistics show how technology has moved beyond smartphones and become part of everyday life, with devices such as smartwatches, fitness bands, smart rings, and health trackers widely used to monitor physical activity, heart rate, sleep patterns, and overall wellness.
The rising focus on preventive healthcare, fitness awareness, and digital lifestyles has driven adoption across consumers, enterprises, and healthcare systems, while these statistics explain how wearables are used, who adopts them, and why demand continues to grow.
They also reflect trends in health monitoring, remote patient care, workplace safety, and connected lifestyles, and highlight how advances in sensors, AI, and connectivity are improving accuracy and usability, offering a clear, data-backed view of how wearable technology is shaping personal health management and the broader digital ecosystem.
Editor’s Choice
- Nearly 1 billion people worldwide use smart wearables daily, highlighting their transition into mainstream consumer technology.
- Around 20% of US adults regularly use a smartwatch or fitness tracker, indicating strong penetration in developed markets.
- Fitness and health tracking dominate usage, with 92% of users relying on wearables to monitor health and wellness metrics.
- Smartwatch shipments recorded an 80.96% global increase, reflecting the rapid adoption of wrist-based smart devices.
- Fitness monitors account for approximately 58.7% of total wearable shipments, making them the most widely adopted wearable category.
- Head-mounted wearable devices represent 67.17% of total wearable device shipments, driven by demand in enterprise, industrial, and immersive applications.
- Users of fitness trackers average nearly 2,000 more steps per day than non-users, demonstrating a measurable behavioral impact.
- Data privacy remains a concern, with 40% of wearable users expressing concern over data collection, rising to 60% among users of subscription-based health services.
- In enterprise environments, 79% of companies using wearable technology consider it a strategic component of future business operations.
- Industrial wearables are gaining traction, with global sales expected to exceed $2.78 billion, supported by productivity gains and reduced workplace injuries.
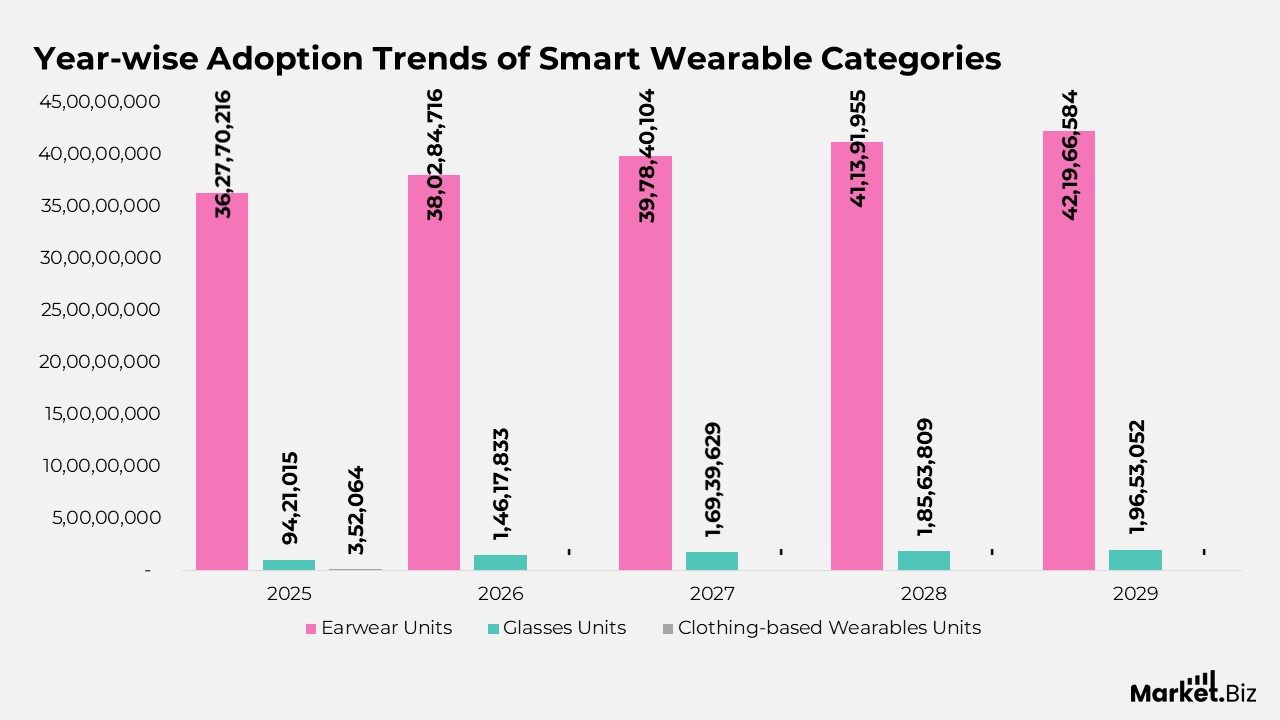
Year-wise Adoption Trends of Smart Wearable Categories
- In 2025, earwear clearly dominated smart wearable adoption, recording 362,770,216 units, while glasses reached 9,421,015 units and clothing-based wearables remained limited at 352,064 units, reflecting early-stage penetration in this category.
- By 2026, earwear usage expanded further to 380,284,716 units, supported by a sharp rise in smart glasses adoption to 14,617,833 units, indicating growing consumer interest in audio and visual wearable experiences.
- In 2027, earwear maintained strong momentum at 397,840,104 units, while glasses crossed 16,939,629 units, showing steady acceptance of advanced wearable form factors beyond traditional devices.
- During 2028, earwear adoption increased to 411,391,955 units, and smart glasses reached 18,563,809 units, highlighting continued innovation and improved functionality in immersive and connected wearables.
- By 2029, earwear remained the most widely adopted category at 421,966,584 units, while glasses rose to 19,653,052 units, and clothing and other wearable formats showed gradual but consistent growth, signaling diversification within the smart wearables ecosystem.
(Sources: International Data Corporation, Statista)
Quarter-wise Smart Wearables Shipment Trends by Key Brands
- In 2024 Q2, Apple recorded shipments of 22,104,609 units, while Huawei followed with 13,526,073 units, and Samsung shipped 10,151,990 units, reflecting strong competition among leading global brands during the mid-year period.
- During 2024 Q3, Apple strengthened its position with 28,912,843 units, Xiaomi increased shipments to 15,570,307 units, and Imagine Marketing expanded sharply to 12,190,343 units, indicating rising traction for both established and emerging players.
- In 2024 Q4, Apple peaked at 35,994,642 units, Xiaomi continued steady growth with 17,778,880 units, while Samsung and Huawei maintained balanced shipments at 12,206,715 units and 12,404,966 units respectively, highlighting year-end demand momentum.
- By 2025 Q1, Apple shipments moderated to 23,749,583 units, Huawei rebounded to 15,722,870 units, and Xiaomi reached 18,324,641 units, signaling shifting quarterly dynamics and renewed competitive intensity across brands.
(Sources: International Data Corporation, Statista)
Key Global Insights and Usage Patterns in Smart Wearables
- Today, nearly 1 billion people worldwide use smart wearables on a daily basis, a significant figure when compared with the global population of just over 7.5 billion, highlighting how mainstream these devices have become.
- In the US, around 1 in 5 individuals regularly use a smartwatch or fitness tracker, showing strong penetration in everyday health and lifestyle monitoring.
- Women show higher periodic usage of smartwatches or fitness trackers than men, with adoption rates of 25% among women compared to 18% among men.
- While women globally lead in fitness tracker usage, men account for the majority ownership of smartwatches, pointing to differing preferences across wearable categories.
- Wearable adoption skews younger, with individuals aged 18–49 representing about 25% of regular smartwatch or fitness tracker users.
- Smart wearable users typically have higher disposable income, as 31% of Americans earning $75,000 or more annually use fitness trackers, compared with 20% among those earning between $30,000 and $74,999.
- Fitness trackers support healthier lifestyles, as users average nearly 2,000 more steps per day than non-users, indicating higher daily activity levels.
Moreover
- Research evidence reinforces this impact, with activity-tracking devices linked to increased physical activity in 70% of studies reviewed.
- Data privacy remains a concern, with 40% of smartwatch and fitness tracker owners worried about data collection, rising to 60% among users who subscribe to data-driven health and fitness reporting services.
- The global fitness tracker market was valued at about $36 billion in 2020 and is projected to reach $114.36 billion by 2028, reflecting strong long-term growth momentum.
- In the enterprise space, 79% of companies using wearable technology report that it is, or is expected to become, a strategic part of their future business success.
- Industrial wearable devices are gaining rapid traction in factories and distribution centers, with sales expected to exceed $2.78 billion by 2024, driven by productivity gains, fewer workplace injuries, and hands-free training benefits.
- According to industry surveys, wearable technology currently ranks as the top global fitness trend, outperforming home exercise equipment, outdoor activities, and traditional strength training.
- Interest in smart glasses continues to build, signaling renewed innovation in the sector, even as earlier platforms such as Google Glass remain active behind the scenes.
- At the hardware level, roughly 1 out of every 2 smart wearables worldwide contains an Apollo SoC chip from Ambiq, underscoring its widespread role in powering wearable devices.
(Sources: International Data Corporation, Statista)
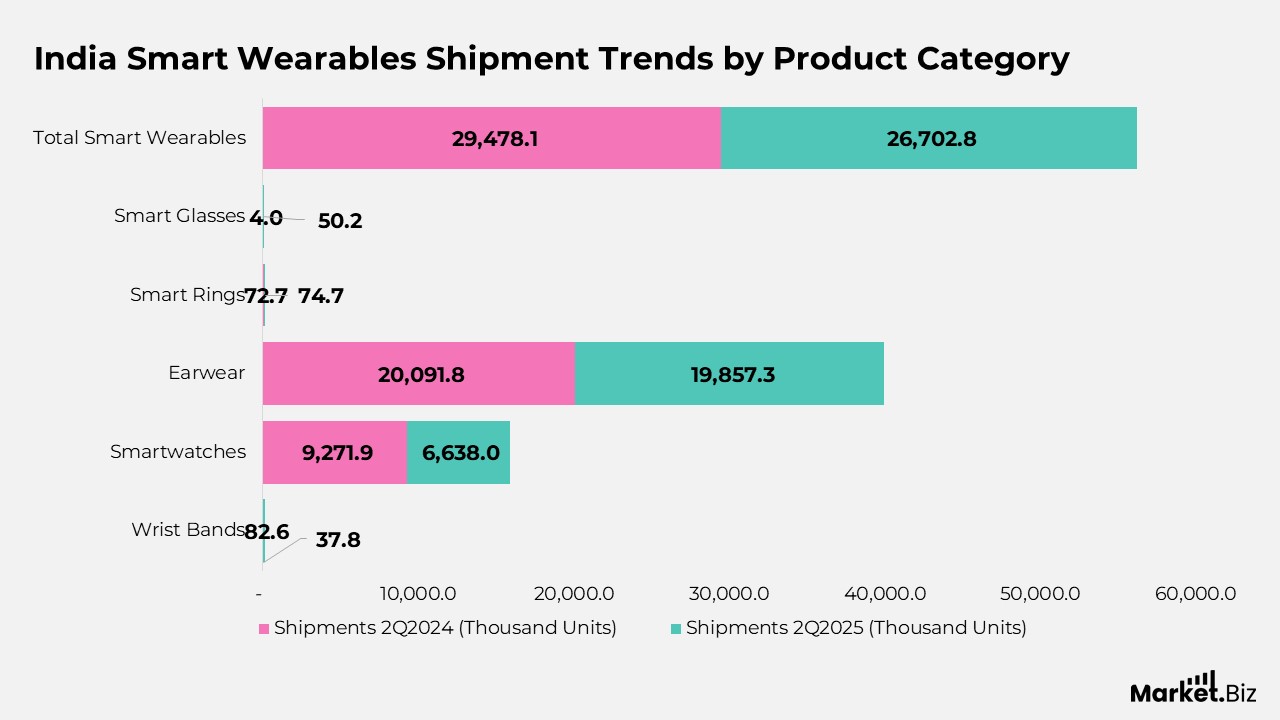
India Smart Wearables Shipment Trends by Product Category
- Wrist band shipments in India rose sharply from 37.8 thousand units in 2Q2024 to 82.6 thousand units in 2Q2025, registering a strong year-over-year growth of 118.5%, supported by renewed interest in entry-level fitness devices.
- Smartwatch shipments declined from 9,271.9 thousand units in 2Q2024 to 6,638.0 thousand units in 2Q2025, reflecting a notable contraction of 28.4%, driven by market saturation and slower replacement demand.
- Earwear remained the largest category by volume, with shipments easing slightly from 20,091.8 thousand units to 19,857.3 thousand units, indicating a marginal year-over-year decline of 1.2%.
- Smart rings showed stable performance, with shipments increasing modestly from 72.7 thousand units in 2Q2024 to 74.7 thousand units in 2Q2025, translating into a growth of 2.8%.
- Smart glasses recorded the fastest expansion, jumping from just 4.0 thousand units in 2Q2024 to 50.2 thousand units in 2Q2025, representing an exceptional growth rate of 1,145.6%, albeit from a very low base.
- Overall smart wearable shipments in India declined from 29,478.1 thousand units in 2Q2024 to 26,702.8 thousand units in 2Q2025, resulting in an overall year-over-year drop of 9.4%, highlighting uneven demand across product categories.
(Sources: International Data Corporation, Statista)
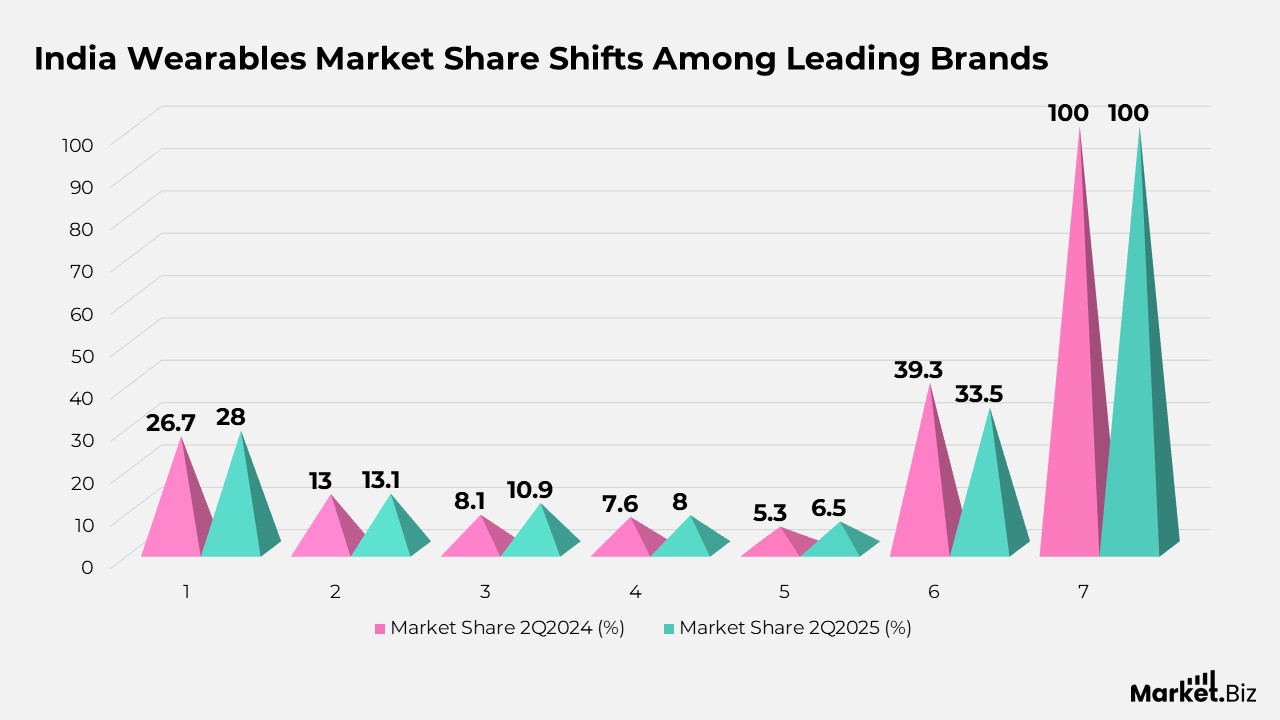
India Wearables Market Share Shifts Among Leading Brands
- In 2Q2025, boAt (Imagine Marketing) strengthened its leadership position, with market share rising from 26.7% in 2Q2024 to 28.0% in 2Q2025, although the brand recorded a year-over-year shipment decline of 4.8%.
- Noise (Nexxbase) maintained a stable competitive position, marginally increasing its market share from 13.0% to 13.1%, despite experiencing a sharper year-over-year contraction of 8.6%.
- Boult emerged as one of the fastest-growing brands, expanding its market share from 8.1% in 2Q2024 to 10.9% in 2Q2025, supported by a strong positive growth rate of 21.8%.
- OPPO, including OPPO and OnePlus devices, improved its combined market share from 7.6% to 8.0%, though overall shipments declined year over year by 4.9%, reflecting mixed performance across product lines.
- realme increased its presence in the wearables market, with its share rising from 5.3% to 6.5%, supported by a positive growth rate of 12.3% during the period.
- The collective “Others” category saw a notable drop in market share from 39.3% in 2Q2024 to 33.5% in 2Q2025, alongside a steep year-over-year decline of 23.0%, indicating consolidation toward leading brands.
- Overall, the Indian wearables market remained evenly distributed at 100.0% across both quarters, but total shipments declined by 9.4%, highlighting a challenging demand environment despite gains by select players.
(Sources: International Data Corporation, Statista)
India Smartwatch Market Leadership and Share Movements
- In 2Q2025, Noise strengthened its leadership in the smartwatch segment, with market share rising from 25.7% in 2Q2024 to 30.9% in 2Q2025, despite recording a year-over-year shipment decline of 13.8%.
- boAt expanded its smartwatch presence, increasing market share from 11.6% to 13.7%, even as overall shipments declined by 15.0%, reflecting resilience in brand demand amid a slowing market.
- Boult delivered the strongest performance among leading players, more than doubling its market share from 3.9% to 8.2%, supported by a sharp positive growth rate of 49.6%.
- Titan maintained a relatively stable share, edging up from 7.9% to 8.1%, although shipments contracted significantly with a year-over-year decline of 26.9%.
- Fire-Boltt experienced the steepest drop, with market share falling sharply from 24.2% in 2Q2024 to 6.7% in 2Q2025, alongside a substantial decline of 80.2% in shipments.
- The “Others” category increased its combined market share from 26.7% to 32.4%, even though overall volumes in this segment declined by 13.3%, indicating fragmentation beyond the top brands.
- Overall, the Indian smartwatch market maintained a total share of 100.0% across both quarters, but total shipments fell by 28.4%, highlighting significant pressure on demand despite selective brand-level gains.
(Sources: International Data Corporation, Statista)
India TWS Market Share Dynamics and Brand Performance
- In 2Q2025, boAt continued to lead the TWS segment, holding 31.9% market share in 2Q2025, down from 33.9% in 2Q2024, alongside a year-over-year decline of 6.9%, indicating mild pressure at the top end.
- Boult strengthened its position, expanding market share from 12.8% to 14.9%, supported by positive growth of 14.9%, reflecting rising acceptance of value-driven TWS offerings.
- Noise saw a slight softening in its TWS presence, with market share easing from 9.3% in 2Q2024 to 8.9% in 2Q2025, coupled with a modest shipment decline of 5.4%.
- OPPO, including OnePlus devices, improved its combined TWS market share from 7.4% to 7.8%, supported by a positive year-over-year growth rate of 4.9%.
- realme recorded steady gains, increasing market share from 6.4% to 7.5%, driven by strong growth of 15.5% during the period.
- The “Others” category experienced a slight contraction, with combined market share declining from 30.2% in 2Q2024 to 29.0% in 2Q2025, reflecting gradual consolidation toward leading brands.
- Overall, the Indian TWS market remained evenly distributed at 100.0% share across both quarters, while total shipments declined marginally by 1.2%, signaling a relatively stable demand environment compared to other wearable categories.
(Sources: International Data Corporation, Statista)
Global Wearables Shipment and Demand Highlights
- In 2019, global exports of wearable devices reached approximately 125 million units, reflecting the early scale-up phase of the wearables ecosystem.
- During 2020, shipments of smart eyewear rose sharply and contributed close to 40% of total global wearables market revenue, indicating growing interest in immersive and visual technologies.
- Worldwide smartwatch shipments recorded a strong increase of 80.96%, underscoring rapid consumer adoption of wrist-based smart devices.
- Head-mounted display wearables accounted for 67.17% of total wearable device shipments, highlighting their dominant role in certain application segments.
- Body-worn cameras represented 5.62% of global wearable demand, driven mainly by professional and security-related use cases.
- Wearable Bluetooth headsets captured 20.6% of overall demand, supported by rising use in entertainment, communication, and remote work environments.
- Sports and fitness watches experienced a shipment growth of 22.31% globally, reflecting increasing health awareness and active lifestyle trends.
- Fitness monitors made up around 58.73% of total wearable shipments, positioning them as one of the most widely adopted wearable categories.
- Strong user demand for head-mounted wearable devices established this segment as the third-largest category, following smartwatches and other leading wearable types.
(Sources: International Data Corporation, Statista)
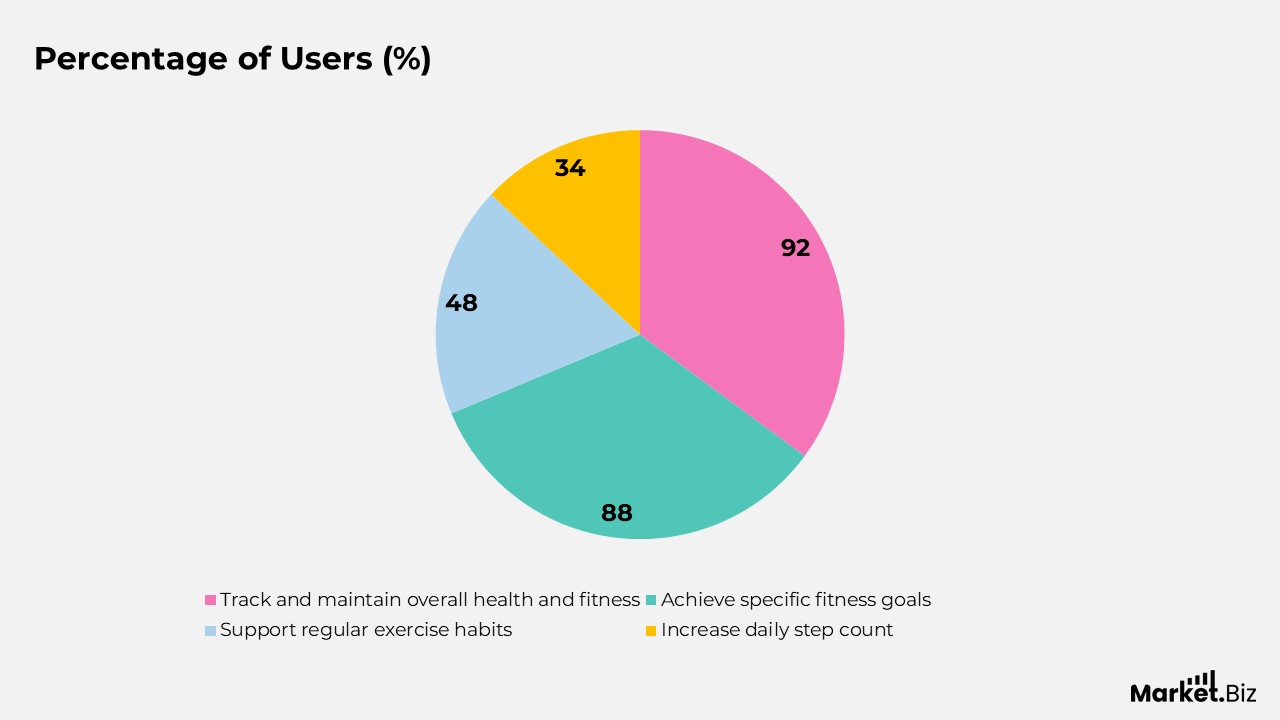
Primary Reasons for Using Wearable Devices
- A large majority of users, about 92%, use wearable devices to track and maintain their overall health and fitness regularly.
- Around 88% of users rely on wearables to help achieve specific fitness goals, such as weight management or improved endurance.
- Nearly 48% of users use wearable devices to support regular exercise habits and maintain workout consistency.
- About 34% of users use wearables primarily to increase their daily step count and stay more active throughout the day.
(Sources: DemandSage, ValuePenguin, Statista)
Country-wise Adoption of Wristbands Among Internet Users
- Poland shows the highest adoption, with 26.5% of internet users using wristbands, indicating strong acceptance of wearable fitness devices.
- China follows with 20.9% of internet users adopting wristbands, supported by large-scale digital adoption and health awareness.
- In the United Kingdom, around 15.0% of internet users use wristbands, reflecting steady demand for personal health tracking.
- Germany records a similar trend, with 14.5% of internet users using wristbands as part of their daily routine.
- India reports wristband usage among 13.8% of internet users, driven by growing fitness consciousness and affordable wearable options.
- The United States shows adoption at 12.2%, highlighting moderate but widespread use across different age groups.
- France closely aligns with the US, with 12.1% of internet users using wristbands for activity and health monitoring.
- Japan has relatively low adoption, with only 2.4% of internet users using wristbands, indicating limited penetration of this device type.
- Morocco records the lowest share, at 2.1%, suggesting wristbands remain a niche product in the local wearable market.
(Sources: DemandSage, ValuePenguin, Statista)
Age-wise Smartwatch Usage by Gender
- Among users aged 16 to 24 years, smartwatch adoption is slightly higher among males at 21.0% compared with 19.6% among females.
- In the 25 to 34 years age group, smartwatch usage is almost evenly distributed, with 27.2% of females and 26.9% of males using smartwatches.
- For individuals aged 35 to 44 years, males show marginally higher usage at 25.5%, while females account for 24.5% of smartwatch users.
- In the 45 to 54 years segment, smartwatch adoption remains higher among males at 20.9%, compared with 18.6% among females.
- Among the 55 to 64-year age group, male smartwatch usage stands at 16.1%, notably higher than the 12.7% recorded among females, indicating stronger adoption among older male users.
(Sources: DemandSage, ValuePenguin, Statista)
Conclusion
Smart wearables statistics indicate a clear shift from optional tech accessories to widely adopted everyday devices. Strong usage for health monitoring, fitness improvement, and activity tracking underlines their growing importance in supporting healthier lifestyles. The data also highlights distinct adoption patterns shaped by age, income, and gender, showing that wearables appeal to a broad but diverse user base with varying preferences across device categories.
Taken together, these trends point to a steadily advancing smart wearables market. Established segments such as smartwatches, fitness trackers, and earwear continue to anchor demand, while newer formats, including smart rings, smart glasses, and industrial wearables, are gaining traction.
With expanding use in both consumer and enterprise settings and ongoing improvements in technology, smart wearables are positioned to play an increasingly influential role in the global digital and health-focused ecosystem.
FAQ’s
Smart wearables are a category of connected electronic devices designed to be worn on the body and integrated into daily life. They function by collecting, processing, and transmitting data related to physical activity, physiological signals, and user behavior through embedded sensors and connectivity technologies.
The smart wearables ecosystem consists of hardware devices, software platforms, connectivity infrastructure, and data analytics systems that work together to enable continuous monitoring, real-time feedback, and long-term data-driven insights for users and organizations.
Smart wearables adoption is commonly measured through indicators such as device shipments, active user base, usage frequency, demographic penetration, and application-specific deployment across consumer, healthcare, and enterprise environments.
Adoption is influenced by advancements in sensor technology, increased awareness of preventive healthcare, improvements in connectivity, affordability of devices, and the integration of wearables into broader digital and mobile ecosystems.
Smart wearables act as a bridge between personal technology and digital health systems by enabling continuous data collection, supporting remote monitoring, and contributing to data-driven decision-making in healthcare, fitness, and enterprise applications.