
Introduction
Soda Ash Statistics: Soda ash, also known as sodium carbonate (Na2CO3), is an essential inorganic compound that appears as a white powder without any odour. It is widely utilised in the production of glass, detergents, chemicals, and in water treatment processes to regulate pH levels and facilitate cleaning.
This compound is obtained either naturally from trona ore or produced synthetically through the Solvay process. It is available in different grades, including light, dense, and washing soda, and serves as a potent alkaline substance that neutralises acids and precipitates minerals.
Statistics regarding soda ash (sodium carbonate) indicate a burgeoning global market, propelled by increasing demand in the glass manufacturing, detergent, and chemical sectors. The primary production of soda ash is concentrated in China, the United States, and Turkey, sourced from both natural trona and synthetic methods.
Editor’s Choice
- 9.7 million tons, valued at $1.5 billion, saw a decline of 17% in comparison to the prior year.
- The global demand for soda ash surpassed 70 million metric tons in annual consumption during 2024.
- In 2025, WE Soda completed the acquisition of Genesis Alkali for approximately $1.425 billion.
- In 2024, global imports of soda ash surpassed 22 million metric tons.
- In 2024, global exports of soda ash reached approximately 25 million metric tons.
General Soda Ash Statistics
- 9.7 million tons, valued at $1.5 billion, saw a decline of 17% in comparison to the prior year.
- The total annual nameplate capacity of the plants in Wyoming is 13.9 million tons.
- Soda Ash, or Sodium Carbonate, ranks as the 10th most widely consumed inorganic compound worldwide, with a usage history spanning over 5,000 years.
- Synthetic Soda Ash is manufactured through chemical methods such as the Solvay or Hou process, which constitutes approximately 70% of global output.
- In January 2024, soda ash production reached 996,000 metric tons. Reflecting a 5% increase from the previous month and a 13% rise compared to January 2023.
- Ending stocks for January stood at 292,000 metric tons, marking a 17% rise from the month before.
- Wyoming’s trona production in January 2024 was 1.63 million metric tons, a slight decrease from December 2023 but 32% higher than in January 2023.
- Soda ash exports fell by 8% in January 2024, totalling 573,000 mt compared to December 2023.
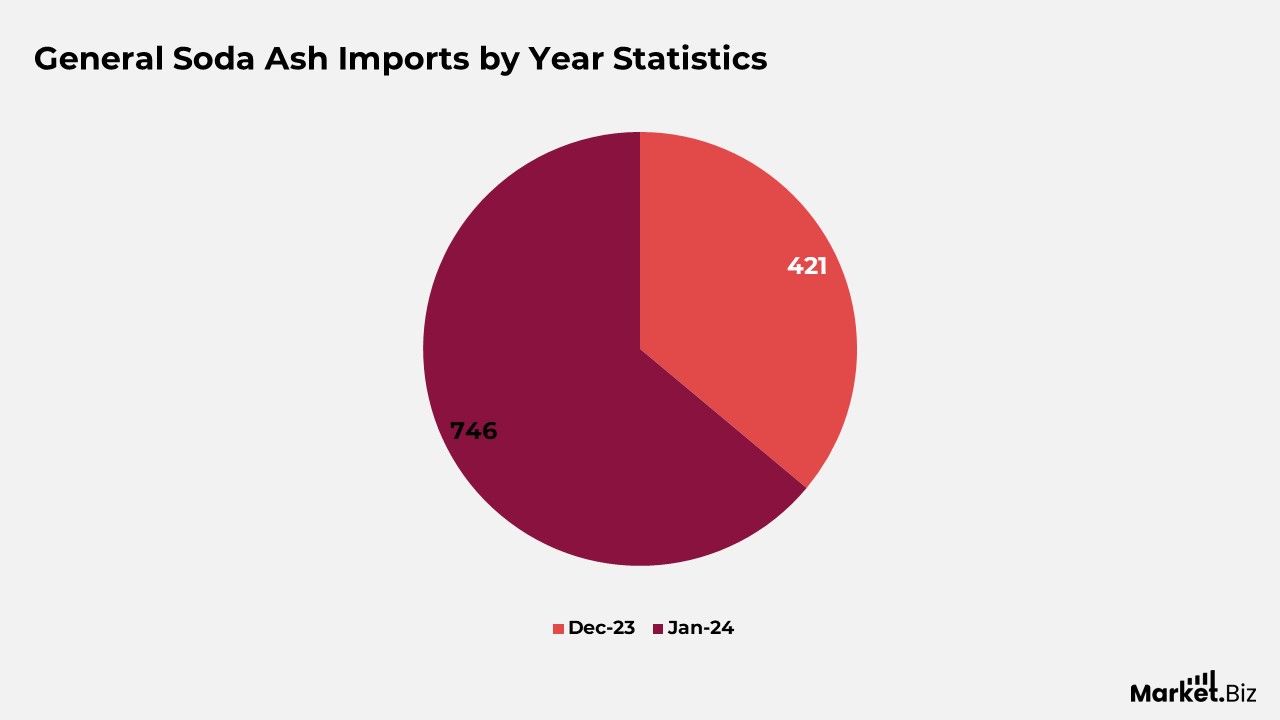
- Soda ash imports in January 2024 amounted to 746 metric tons, an increase from 421 metric tons in December 2023.
- Apparent consumption in January 2024 was recorded at 382,000 metric tons, which is 4% lower than December 2023 but 4% higher than January 2023.
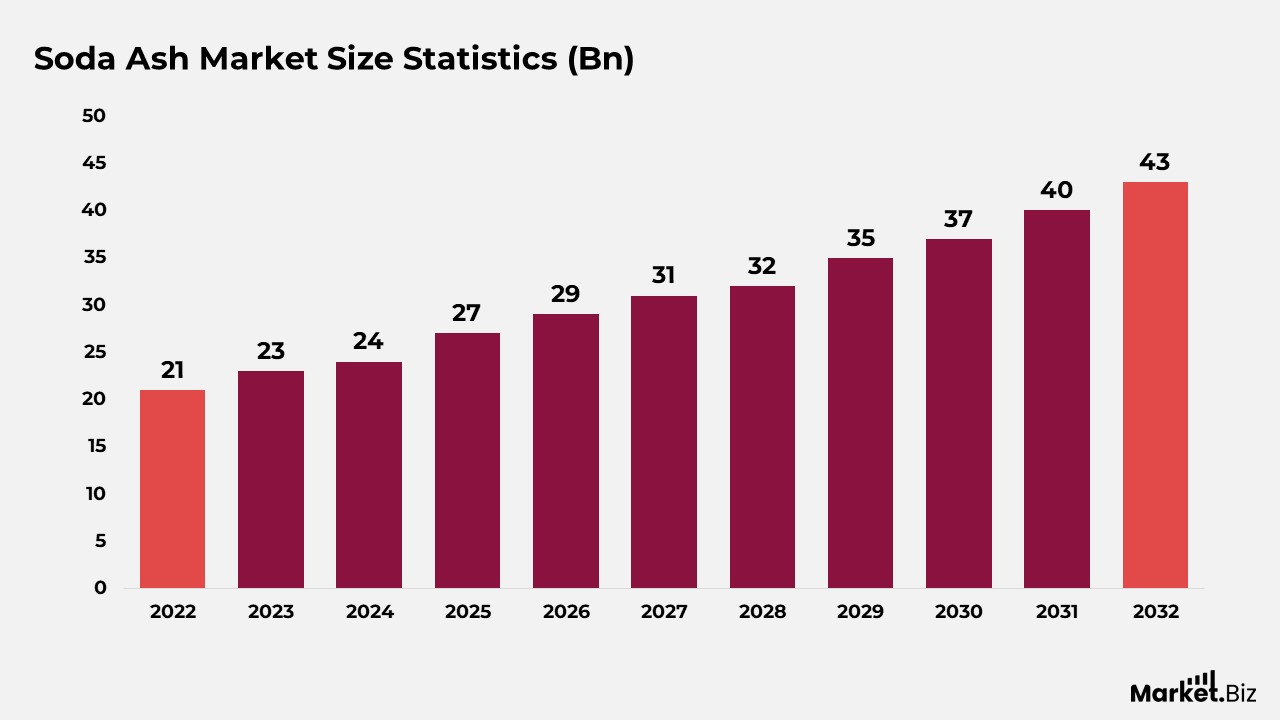
Soda Ash Market Size Statistics
- The global demand for soda ash surpassed 70 million metric tons in annual consumption during 2024.
- The Asia-Pacific region constituted approximately 57% of the total global demand for soda ash.
- China alone accounted for over 30 million metric tons, which represents more than 40% of the global usage.
- India’s consumption of soda ash exceeded 6 million metric tons, placing it among the top five consumers.
- North America made up around 15% of the total global demand for soda ash.
- Europe represented roughly 17% of the global consumption volume of soda ash.
- The manufacturing of flat glass utilises over 60% of soda ash within the glass segment.
- Container glass was responsible for approximately 30% of the soda ash usage in the glass sector.
- Applications in solar and speciality glass consumed about 10% of the glass-grade soda ash.
- Industrial detergents accounted for nearly 65% of the consumption of detergent-grade soda ash.
- Household detergents represented around 35% of the demand for detergent-grade soda ash.
- The average annual per-capita consumption of soda ash in developed industrial economies ranged from 8 to 10 kg.
Soda Ash Industry Statistics
- The soda ash market is characterised by consolidation, with leading manufacturers such as Solvay, Ciner Group, Tata Chemicals, GHCL, and Genesis Energy holding significant shares of the overall capacity.
- In 2025, WE Soda completed the acquisition of Genesis Alkali for approximately $1.425 billion, positioning itself as one of the largest holders of soda ash capacity globally, with around 9.5 million metric tons.
- Tata Chemicals, a prominent soda ash producer in India, reported that soda ash accounted for nearly two-thirds of its sales volume in its latest earnings announcements.
- GHCL Ltd. is in the process of expanding its production capabilities, which includes the establishment of a new soda ash facility in Gujarat, aimed at significantly increasing its capacity.
- Solvay has entered into partnerships to create some of the first carbon-neutral soda ash production plants, indicating a transition towards environmentally sustainable manufacturing practices.
- The leading five producers worldwide represent approximately 45% of the total production capacity, illustrating a moderate level of market concentration.
- Competitive conditions differ by region; producers in China enjoy advantages from low feedstock costs. Whereas manufacturers in the U.S. and Europe capitalise on technological efficiencies.
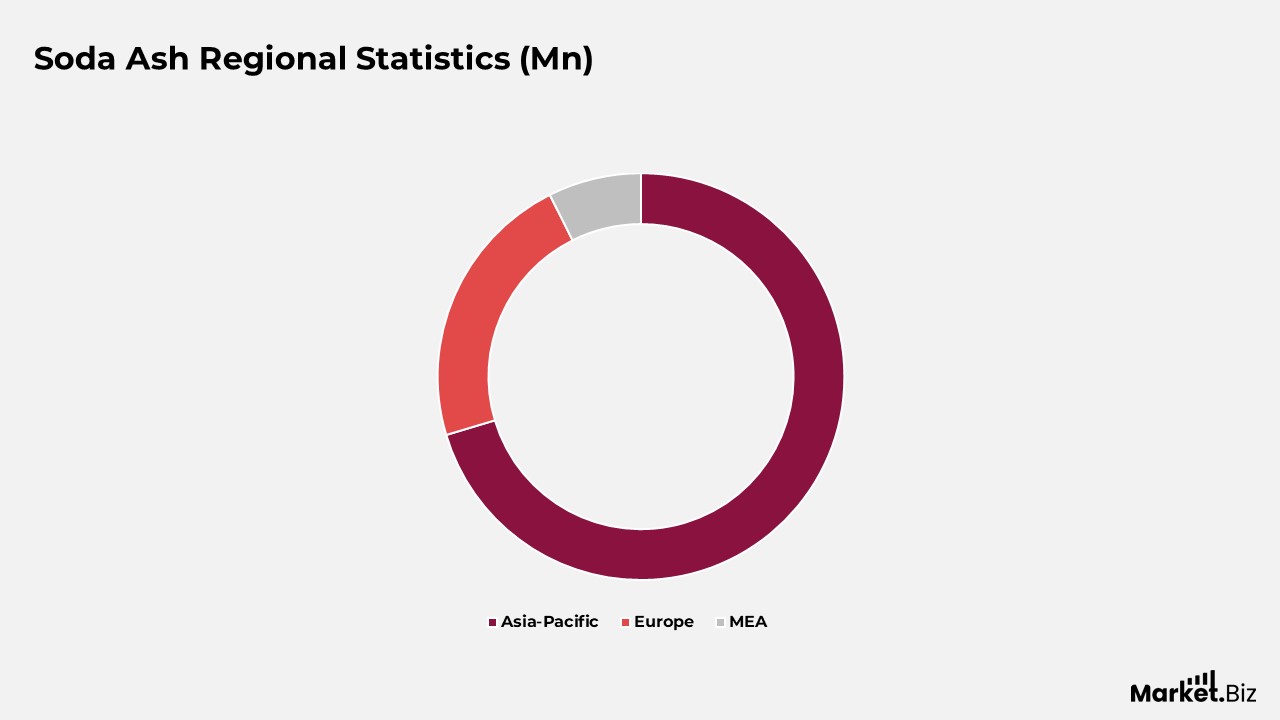
Regional Statistics of Soda Ash
- The Asia-Pacific region continues to be the leading area, representing nearly 58% of the global soda ash volume. Which amounts to 38 million metric tons each year, primarily driven by the activities in China, India, and Japan.
- In the Asia-Pacific, China stands out as the largest national producer. Generating approximately 28 million tons of soda ash annually, followed by India, with a production of 5.6 million tons.
- In North America, particularly in the United States, there is a significant production of natural soda ash. Supported by robust trona-based capacity, the production in the U.S. alone reached double-digit millions of tons in 2024.
- Europe contributes around 12 million metric tons to the annual output, with Germany, Poland, France, and Turkey being among the leading producers.
- The Middle East and Africa collectively provide about 4 million metric tons. With Turkey accounting for roughly 2.5 million tons each year.
- The demand for soda ash in North America is bolstered by trona reserves, especially in Wyoming. While Europe focuses on enhancing energy efficiency and sustainability practices.
- Regions like Latin America and certain areas in Africa are gradually increasing their soda ash production, which is associated with the growth in industrial and detergent manufacturing.
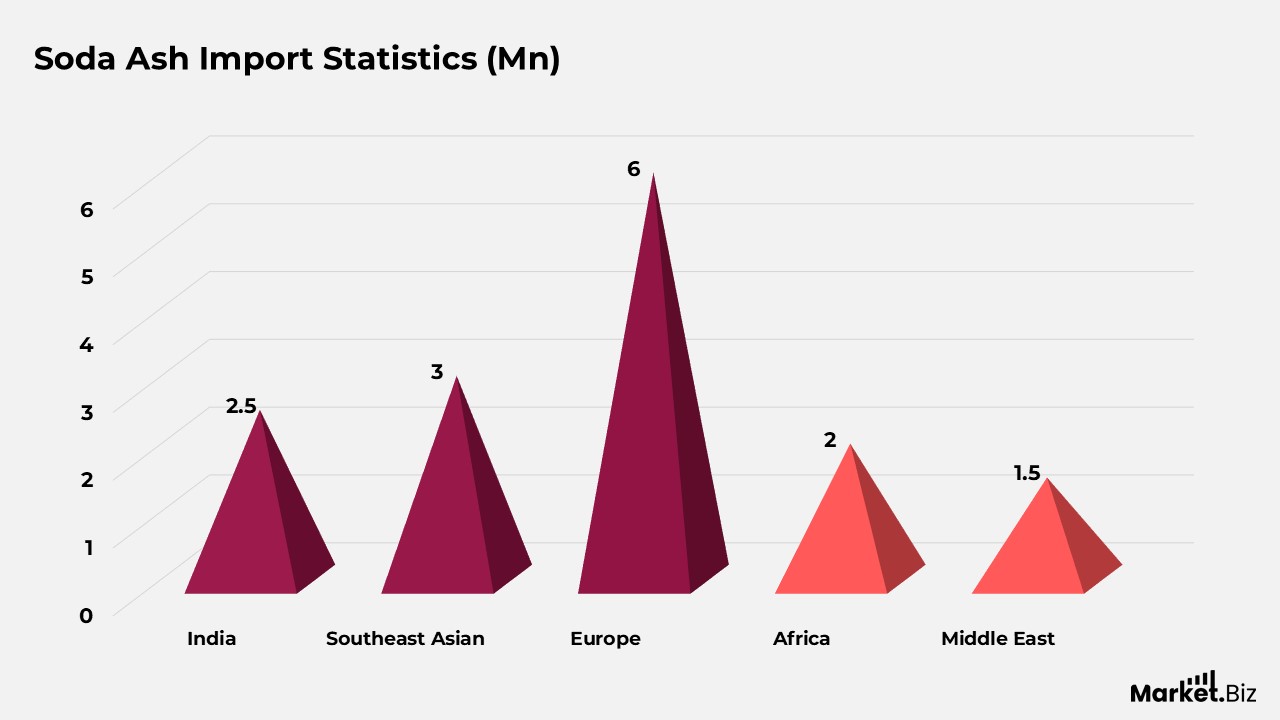
Soda Ash Import Statistics
- In 2024, global imports of soda ash surpassed 22 million metric tons.
- Countries in the Asia-Pacific region represented more than 45% of the total global soda ash imports.
- India’s annual soda ash imports exceeded 2.5 million metric tons.
- Southeast Asian nations collectively imported approximately 3 million metric tons each year.
- Europe’s soda ash imports were around 6 million metric tons in 2024.
- African nations together imported close to 2 million metric tons of soda ash.
- The Middle East’s annual soda ash imports approached 1.5 million metric tons.
- Over 60% of the imported soda ash was utilised in glass manufacturing.
- Detergent manufacturers represented about 25% of the demand for imported soda ash.
- More than 85% of soda ash imports were conducted through bulk maritime shipments.
- Typical sizes for soda ash shipments ranged from 20,000 to 40,000 metric tons per vessel.
- In non-producing countries, the dependency on imports exceeded 90% of the domestic demand for soda ash.
Soda Ash Export Statistics
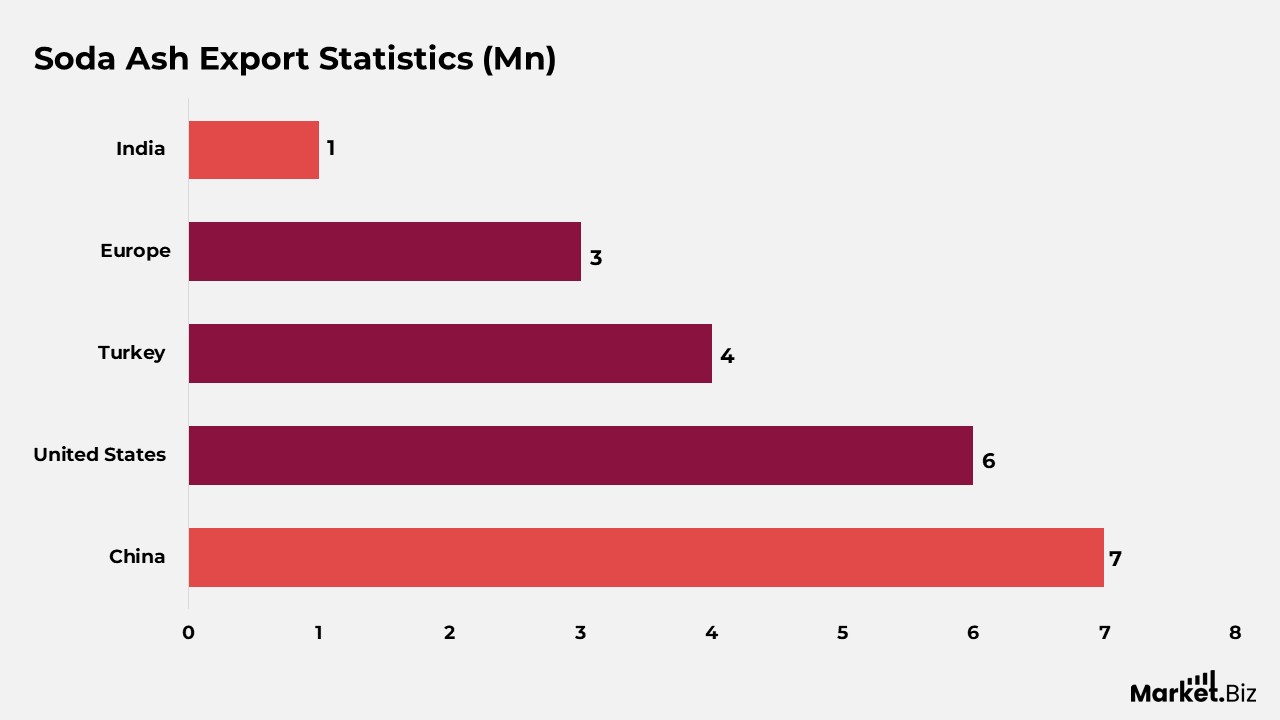
- In 2024, global exports of soda ash reached approximately 25 million metric tons.
- China was the leading exporter, sending out over 7 million metric tons. Thus securing its position as the largest exporter by volume worldwide.
- The United States followed with exports of around 6 million metric tons, primarily sourced from its natural soda ash reserves.
- Turkey ranked among the top three exporters globally, with nearly 4 million metric tons exported.
- Europe’s exports amounted to about 3 million metric tons, largely facilitated through intra-regional trade.
- India contributed over 1 million metric tons of soda ash to the global market annually.
- Destinations in the Asia-Pacific region received approximately 50% of the total global soda ash exports.
- Latin America represented around 12% of the total volumes of soda ash exported globally.
- Africa accounted for nearly 10% of the soda ash traded internationally.
- Dense soda ash constituted over 65% of the total shipments exported.
- Long-term supply contracts encompassed roughly 70% of the global soda ash exports.
- Export volumes from natural soda ash producers exhibited a 5–7% lower energy intensity compared to those from synthetic sources.
Recent Developments
- In 2022, Solvay revealed its intentions to construct a new soda ash facility in Wyoming, United States. Which will have a production capacity of 6 million tonnes annually.
- In 2023, Ciner Group declared its plans to transition to renewable energy sources at its soda ash facility in Turkey.
- In 2024, Mainland China experienced its most substantial annual capacity expansion ever recorded. With initiatives such as Inner Mongolia Berun achieving 5 MMTPA, thereby contributing significantly to global supply.
Soda Ash Future Prediction
- By the year 2027, it is anticipated that the soda ash market will experience consistent growth, estimated at approximately 3-4% per year, fuelled by the increasing demand for glass. Particularly in the solar and flat glass sectors, as well as a heightened awareness of hygiene that is enhancing the demand for detergents.
- The worldwide market is expected to grow, with certain projections indicating a compound annual growth rate (CAGR) of about 3-5% extending through 2028.
Conclusion
Soda Ash Statistics: In summary, the Soda Ash market is set for ongoing growth, fuelled by its essential applications in multiple industries, especially in glass production, chemicals, and detergents. The market is anticipated to grow considerably, with an expected rise in market size driven by increasing demand from these vital sectors.
Technological advancements and strategic market developments are expected to improve production capabilities and efficiency, thus bolstering the global need for Soda Ash. Moreover, As Soda Ash remains a crucial element in various uses, its market is projected to stay strong, presenting numerous opportunities for growth and innovation in the years ahead.
FAQ’s
Imports currently represent approximately 20% of the total soda ash supply in India. By 2025, the demand is anticipated to rise by 6%, equating to around 300,000 metric tons. Further, Primarily fuelled by the solar glass industry and sodium bicarbonate, which is utilised for flue gas treatment and food-related applications.
WE Soda has surpassed Solvay to establish itself as the leading global producer of sodium carbonate, commonly referred to as soda ash, following its acquisition of Genesis Alkali for $1.42 billion from Genesis Energy. Genesis is recognised as the largest producer of soda ash in the United States, sourcing it from trona, a mineral abundant in sodium carbonate.
Soda Ash is utilised in the extraction and smelting processes of various metals, particularly in the production of alumina products. Notably, it also plays a crucial role in the manufacturing of Lithium Carbonate, which is essential for Lithium-Ion batteries widely used in electric vehicles and other portable devices.