
Introduction
Digital Marketing Statistics: The digital marketing landscape continues to transform, driven by advancements in technology and shifts in consumer behaviors. As businesses increasingly turn to online platforms, digital marketing has become an essential tool for reaching target audiences.
The widespread adoption of mobile devices, social media, and emerging technologies, including artificial intelligence and big data analytics, drives the growth in digital advertising. As a result, marketers are focusing on personalized content, automation, and data-informed strategies to boost customer engagement and drive conversions.
This evolving environment underscores the growing significance of digital marketing, which is playing a pivotal role in shaping business strategies and transforming the dynamics of consumer-brand interactions across various sectors.
Editor’s Choice
- Approximately 58% of small businesses use digital marketing to engage with their customers.
- For each $1 invested in digital marketing, businesses typically generate a $5 return.
- Global digital advertising expenditure is on a steady rise, with projections to reach $734.6 billion by 2025.
- On average, businesses are expected to spend $45.11 per user on social media advertising.
- By 2026, smartphones are anticipated to account for 69% of total advertising spending.
- Programmatic advertising is forecasted to make up 87% of digital ad revenue by 2026.
- Social media ad spending is expected to surpass $230 billion.
- By 2025, the global number of social media users is expected to reach 5.42 billion.
- On average, individuals will use 6.83 different social networks per month.
- 78% of people prefer learning about new products through short video content.
- 93% of marketers plan to dedicate more time to social media marketing in 2025.
Success Rate of Digital Marketing
- PPC generates $2 in returns for every $1 invested, equating to a 200% return on investment.
- Facebook Ads and Google Ads are reportedly the most effective in terms of ROI among paid advertising channels.
- Nearly half of businesses (49%) identify organic search as the most effective marketing channel for generating ROI.
- Email marketing yields $36 to $40 in returns for every $1 spent.
- Small businesses report that email marketing delivers the highest return on investment compared to other marketing channels.
- More than 20% of businesses consider the volume of leads generated as the key metric for evaluating the success of their marketing efforts.
- According to marketers in a Databox report, content marketing and SEO offer the best ROI.
(Source: ReachLocal, Inc. d/b/a LocaliQ)
Search Engine Optimization Statistics
- Approximately 7 billion searches are performed globally every day.
- 21% of Google searches result in more than one click on the search engine results pages (SERPs).
- Over 96% of online content receives no traffic from Google.
- The top five organic Google search results account for around 69% of all traffic clicks.
- Organic search results appearing on the first page of Google typically have an average of 1,447 words on their web pages.
- To rank well in Google’s algorithm, websites must consider more than 200 ranking factors.
- In the United States, approximately 63% of organic search traffic on Google comes from mobile devices.
- In the U.S., 53% of consumers research products online before purchasing to ensure they are making the best choice.
(Source: Worldometers, Ahrefs, Up Inc., Backlinko, Oberlo, Google, Sixth City Marketing )
Digital Marketing Software Market Size
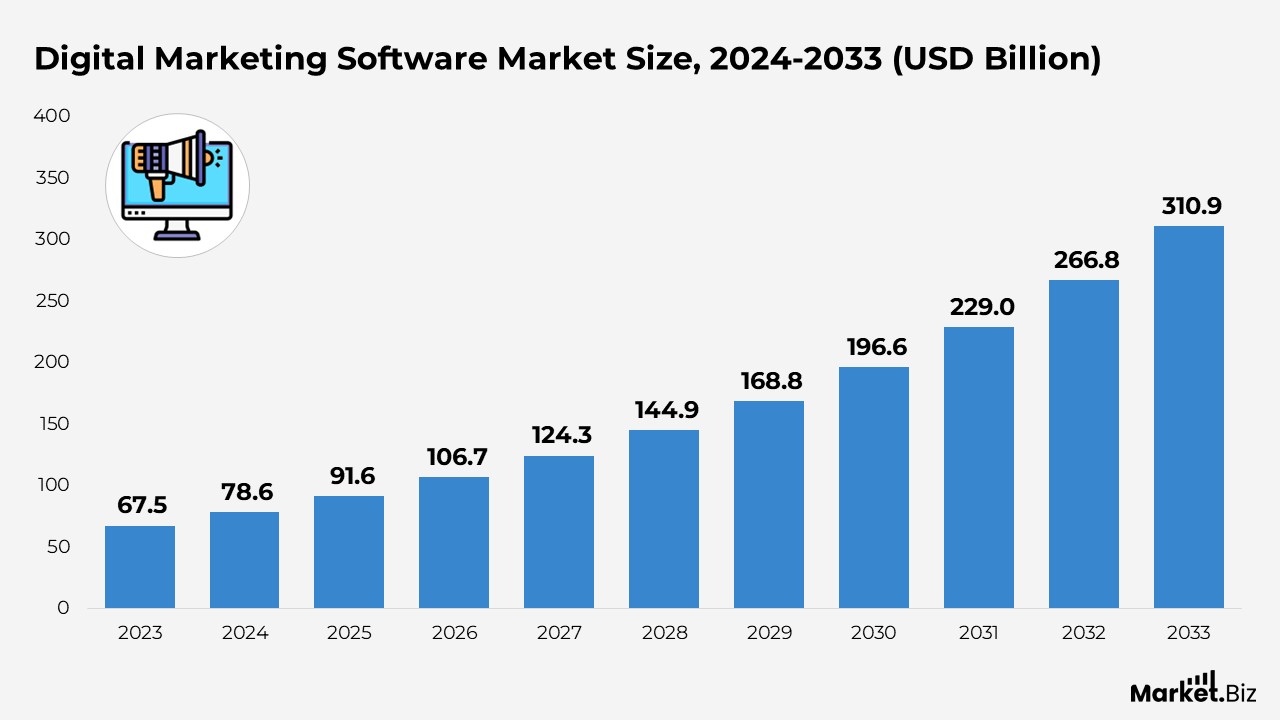
- According to Market.us, the digital marketing software market is projected to grow from $78.6 billion in 2024 to $310.9 billion by 2033, representing a compound annual growth rate (CAGR) of 16.5% from 2024 to 2033.
- The market growth in 2023 is fueled by the growing adoption of digital marketing strategies as businesses transition from traditional methods to digital platforms.
- Cloud-based solutions lead the market in 2023, capturing over 58.4% of the share, offering flexibility, scalability, and cost-effectiveness to businesses of all sizes.
- Email marketing maintains a dominant share of over 31.2% in 2023, due to its proven effectiveness in delivering personalized direct communication with customers.
- Large enterprises hold a significant market share of more than 52.4% in 2023, backed by extensive resources and budgets for comprehensive digital marketing solutions.
- The BFSI sector is expected to continue leading the market in 2023, with an over 21.4% share, driven by its need for personalised marketing to strengthen customer relationships.
- North America dominates the market in 2023, with a share of more than 41.3%, supported by a concentration of major providers and a robust technological infrastructure, resulting in revenues of USD 27.8 billion.
(Source: Market.us)
Email Marketing Statistics
- By 2026, the number of email users worldwide is expected to reach 4.73 billion.
- When opening an email, 63% of people look for a discount.
- Investing in email marketing yields a return on investment of 4,200%.
- Personalizing an email for your target audience can boost business revenue by up to 760%.
- 47% of people will open an email based on the subject line alone.
- 41% of people open their emails on mobile devices, while 39% prefer checking emails on a desktop.
- The best days to send emails for businesses are Tuesdays and Fridays.
- Automated emails generate 320% more revenue compared to non-automated emails.
(Source: Statista, Campaign Monitor, OptinMonster, HubSpot, Techjury, Luisa Zhou, LXA)
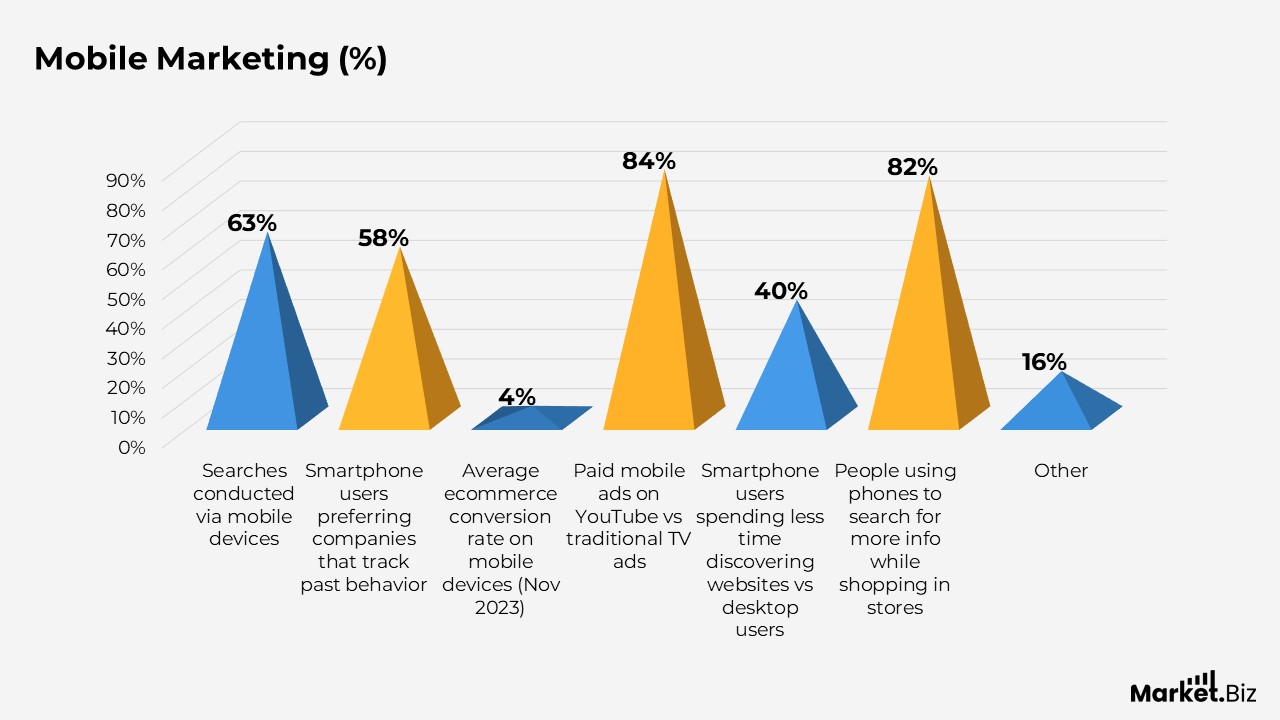
Mobile Marketing Statistics
- 63% of all searches are conducted via mobile devices.
- 58% of smartphone users prefer companies that track their past behavior on mobile websites or apps.
- As of November 2023, the average e-commerce conversion rate on mobile devices stands at 4.18%.
- TikTok is the most popular social media platform globally (Business of Apps).
- Compared to traditional TV advertising, paid mobile ads on YouTube are 84% more effective.
- Smartphone users spend 40% less time discovering a website compared to desktop users.
- 82% of people use their phones to search for additional information while shopping in stores.
(Source: (Pedestal, Google, Oberlo, Business of Apps) )
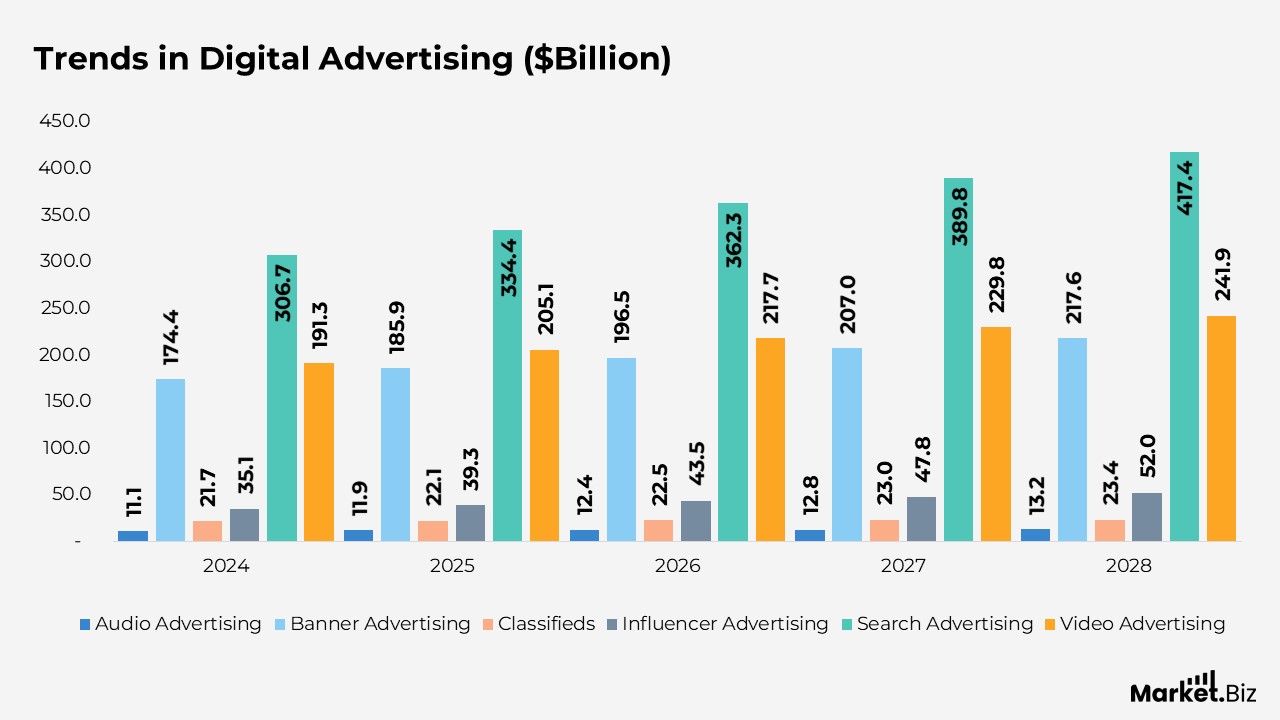
Global Trends in Digital Advertising
- The average ad spend per user in the In-App Advertising market is expected to reach $63.7.
- Mobile devices are expected to drive 65% of total ad spending.
- The United States is forecast to lead global digital advertising spending, with an estimated total of $298 billion.
- Social media ad spending is projected to hit $219.8 billion.
- Programmatic advertising will account for 80% of total ad spending, while non-programmatic ads will represent 20%.
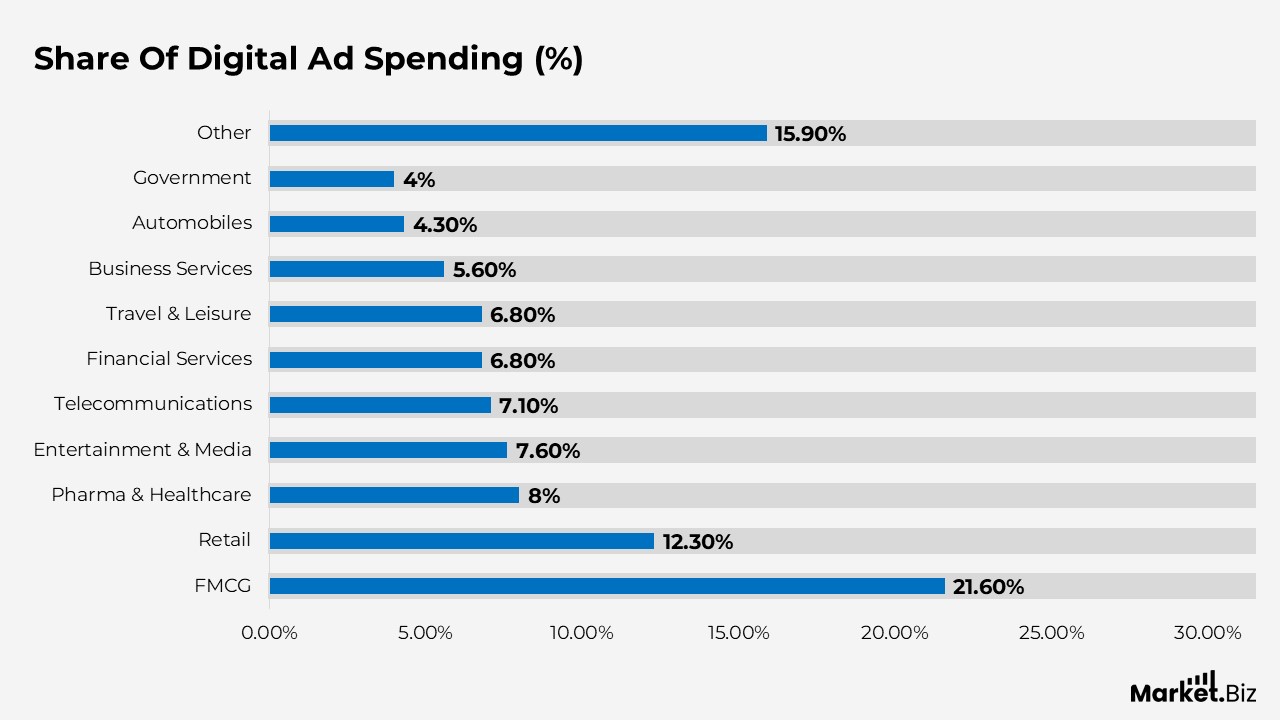
- The FMCG sector is responsible for 21.6% of global ad spending.
- In 2024, the global audio advertising market is projected to reach $11.1 billion, with an expected increase to $13.2 billion by 2028.
- Banner advertising is forecast to grow from $174.4 billion in 2024 to $217.6 billion by 2028.
- The classifieds advertising segment is estimated to rise from $21.7 billion in 2024 to $23.4 billion by 2028.
- Influencer advertising is expected to increase from $35.1 billion in 2024 to $52 billion in 2028.
- Search advertising is expected to grow significantly, reaching $417.4 billion by 2028, up from $306.7 billion in 2024.
- Video advertising is projected to expand from $191.3 billion in 2024 to $241.9 billion in 2028.
- The total global advertising spend is expected to rise from $740.3 billion in 2024 to $965.6 billion by 2028.
(Source: Statista, DemandSage)
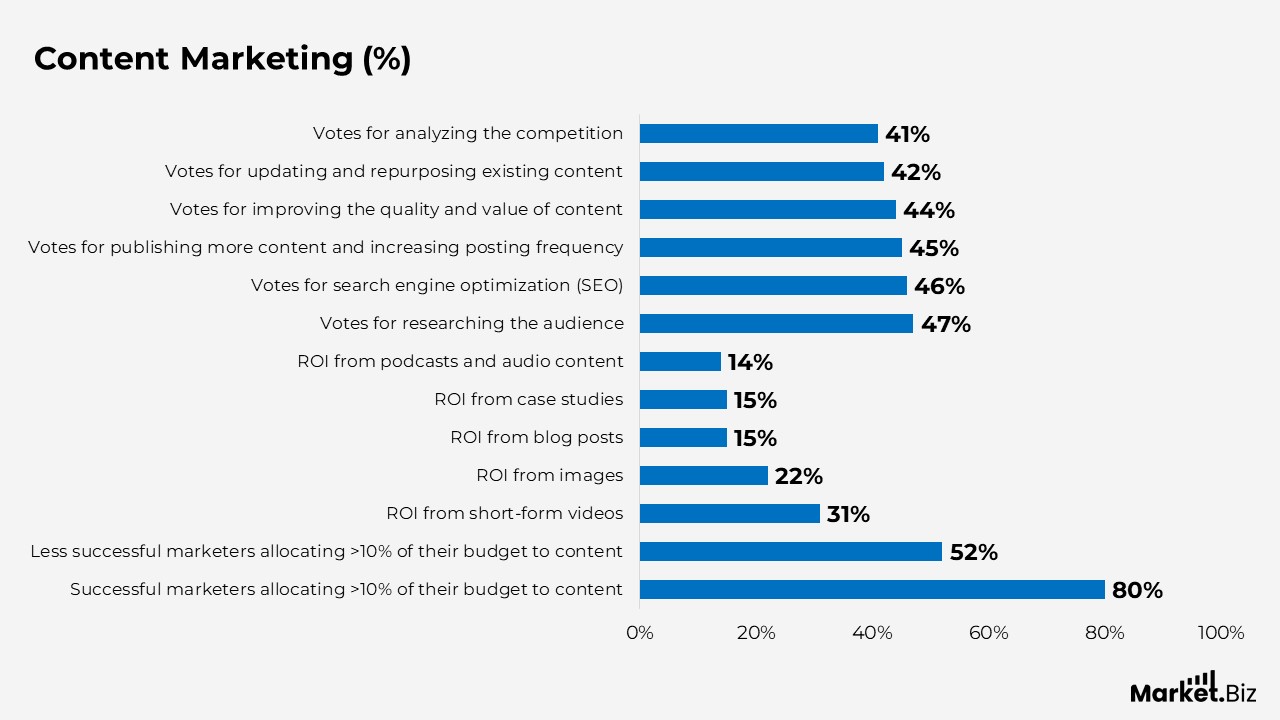
Content Marketing Statistics
- Nearly 80% of highly successful content marketers allocate more than 10% of their total marketing budget to content, compared to just 52% of those who are less successful.
- Short-form videos deliver the highest ROI at 31%.
- Images provide an ROI of 22%.
- Blog posts yield an ROI of 15%.
- Case studies also offer an ROI of 15%.
- Podcasts and other audio content generate an ROI of 14%.
- 47% of votes were received for researching the audience.
- 46% of votes were received for search engine optimization.
- 45% of votes were received in favour of publishing more content and increasing posting frequency.
- 44% of votes were received for improving the quality and value of content.
- 42% of votes were received for updating and repurposing existing content.
- 41% of votes were received for analyzing the competition.
(Source: Statista, DemandSage)
Lead Generation Statistics
- Marketing-nurtured leads result in 20% more sales opportunities.
- Companies focusing on lead nurturing see a 50% increase in sales at 33% lower costs.
- Landing pages achieve the highest conversion rate at 23%, while pop-ups have the lowest conversion rate at 3%.
- The average cost to acquire a B2B sales lead is approximately $200.
- 80% of B2B companies leverage content marketing for lead generation.
- Only 17% of marketers A/B test their landing pages to optimize conversion rates.
- Customers typically expect a page to load within five seconds, after which they are likely to bounce.
- 42% of businesses view email as one of their most important channels for lead generation.
- 73% of leads are not ready to purchase when they first interact with a brand.
- 63% of leads who inquire about a business will not be ready to convert for at least three months.
- 61% of marketers consider lead generation their biggest challenge.
- Leads are 9 times more likely to convert if businesses follow up within five minutes.
- Most midsize and large companies generate fewer than 5,000 qualified leads per month, with an average of 1,877 leads per month.
- 66% of marketers use social media as a lead generation tool.
- Although most marketers decide that LinkedIn is the most real social media platform for B2B lead generation, only 47% actively use it.
(Source: G2.com, Inc., Statista)
Social Media Marketing Statistics
- By 2025, the global number of social media users is expected to reach 4.41 billion.
- 21% of social media workers follow influencers or celebrities.
- 97% of online customers appointment social media at least once per month.
- 37.9% of respondents reported purchasing after viewing a social media advertisement.
- TikTok’s user base has grown by 105% over the past two years, making it the fastest-growing social media platform.
- 62% of the global population uses social media.
- Meta captures 25% of total digital advertising spending.
- 93% of marketers globally use social media for business purposes.
- U.S. businesses invest over $82 billion in social media advertising annually.
- Pinterest shoppers have carts that are 85% larger than those on other platforms.
- Instagram’s engagement rates are approximately six times higher than Facebook’s.
- 77% of marketers use Instagram for business promotion.
- By 2025, ads on X (formerly Twitter) are expected to influence 47 million Americans.
- Mobile ads on YouTube are 84% more engaging than traditional TV ads.
- X (formerly Twitter) has 619 million active users.
- 93% of marketers promote their businesses on Facebook.
- 75% of Instagram users take action after viewing an advertisement.
- Facebook ads can reach 76% of American adults.
- In 2023, marketers rated Facebook as the top social media platform for return on investment (ROI).
- Despite Facebook having double the monthly users, Instagram posts attract 23% more engagement.
(Source: Linearity GmbH)
Online Advertising Statistics
- Ads have the potential to increase brand awareness by 80%, underscoring a crucial element of digital marketing growth.
- 46% of page clicks still go to the top three PPC ads, emphasizing the continued effectiveness of PPC in driving traffic.
- More than 50% of users are unable to distinguish between PPC ads and organic search results.
- According to global digital marketing projections, ad spending is expected to exceed $250 billion by 2024.
- Video marketing is on the rise, with global video ad spending forecasted to reach $60 billion by 2024.
- Mobile ad spending is predicted to surpass desktop spending by a significant margin in 2024.
- The average click-through rate (CTR) for Google Ads remains between 3-5% (Clicta Digital), while Facebook Ads see an average CTR of 0.90%.
(Source: WebFX, Brafton, IIDE, CTV, Statista)
Website Design Statistics
- 75% of people surveyed believe that a website’s credibility is influenced by its design.
- Websites focused on conversion rate optimization generate 400% more leads compared to sites with poor overall design.
- Nearly 81% of people would consider redesigning their website due to low conversion rates.
- The U.S. website design service market is valued at $40.8 billion.
- Users form an opinion about a website in just 0.05 seconds.
- Mobile users are 67% more likely to purchase from a website that is mobile-friendly.
- Over 43% of all websites globally are powered by WordPress.
- Google prioritizes websites that are both mobile-friendly and responsive.
(Source: Kinesis, Google Search Central, Forrester, WP Beginner, CXL, Sagapixel, Forbes)
Google Search Statistics
- Google commands over 91% of the global search engine market share.
- As of 2024, Google maintains the largest market share among all search engines.
- Nearly 50% of people turn to Google first when they have a question.
- The search query How to has been entered 628,000 times on Google.
- Most users typically perform searches with 3-4 words.
- Mobile users generally spend more time deciding their next action after a search compared to desktop users.
- Mobile ads are typically 5 times more effective for businesses than online ads.
- Gmail is available in 105 languages, including Zulu, Nepali, and Sinhala.
(Source: Techopedia, Statista, Fit Small Business, Ahrefs, Semrush, Gitnux)
Influencer Marketing Statistics
- More than half of the brands collaborating with influencers operate in the e-commerce sector.
- Nearly 25% of small businesses on TikTok partner with influencers.
- Approximately 76% of TikTok engagement is driven by influencers with fewer than 10,000 followers.
- On Instagram, influencers can charge wherever from $20 to over $7,000 per post, depending on their reach.
- The most popular type of influencer videos on YouTube is product reviews.
- 80% of marketers have allocated a portion of their budget specifically for influencer partnerships.
- 71% of marketers plan to use AI tools to identify the best influencers to represent their brand.
- As digital platforms continue to rise, Gen Z increasingly trusts influencers more than traditional celebrities.
(Source: Dash App, Hootsuite, Sprout Social, WifiTalents, Digital Marketing Institute)
Trends in Digital Marketing
- It is anticipated that 69% of total advertising spending will be driven by smartphones, highlighting the importance of optimizing social media campaigns for mobile devices.
- Moreover, a statistic reveals that 90% of mobile users are uncertain about their purchasing decisions and tend to search online for products, making it crucial to adapt digital marketing efforts for the growing mobile user base.
- More than 50% of digital marketers plan to increase their content marketing budget, according to insights from the marketing insider group.
- 61% of shoppers prefer to make purchases from businesses that offer augmented reality experiences.
- Voice search is gaining traction, with over 50% of baby boomers using voice assistants for information on the go, as found by Google.
(Source: DemandSage, Statista)
Conclusion
The digital marketing landscape is rapidly evolving, fueled by increasing user engagement and advancements in technology. With billions of email and social media users globally, businesses now have access to a vast and expanding audience, enabling them to implement personalized, data-driven strategies. The impressive return on investment from email marketing, along with the success of customized content, highlights significant growth opportunities.
Furthermore, the rise of mobile devices and automated campaigns is transforming how businesses interact with consumers, emphasizing the need for strategies that prioritize mobile-first experiences and automation.
As the digital realm continues to expand, staying ahead of trends such as SEO, content marketing, and social media advertising will be crucial for businesses seeking to maintain a competitive edge and optimize their marketing efforts.
FAQ’s
The digital marketing landscape is rapidly evolving, driven by technological advancements and a growing emphasis on user engagement. Businesses are leveraging platforms like social media and email marketing to target vast, growing audiences with personalized, data-driven strategies.
Email marketing offers a remarkable return on investment, with some reports indicating a return of up to 4,200%. Personalizing email content can further increase revenue, with some businesses experiencing up to 760% growth in sales.
Around 47% of people decide whether to open an email based solely on its subject line, making it a critical element for successful email marketing campaigns.
In the U.S., 41% of people open emails on mobile devices, underscoring the need for mobile-optimised marketing strategies. Additionally, 69% of global ad spending is expected to be driven by mobile devices by 2026.
According to experts, Tuesdays and Fridays are the most effective days for sending marketing emails, as businesses tend to see higher open rates and engagement on these days.
Programmatic advertising is expected to account for 87% of digital ad revenue by 2026, showcasing its growing dominance in the digital marketing space due to its efficiency and automation.
Marketers often report that content marketing and SEO provide some of the best returns on investment. This is because organic search traffic from high-quality content is an effective way to drive long-term, sustainable growth.