
Introduction
Google Search Statistics: Google Search stands as the dominant global search engine, playing a crucial role in helping users find information, make informed decisions, and engage with online content. As digital habits evolve, Google remains at the forefront, influencing how people access websites, engage with brands, and discover new services.
Through advancements in AI, personalized results, and the growing trend of mobile searches, Google Search continuously refines its approach to deliver more relevant and efficient user experiences. Consequently, staying updated on Google Search trends and statistics is crucial for businesses, marketers, and analysts seeking to refine their strategies and increase visibility in a rapidly evolving digital landscape.
Editor’s Choice
- Every minute, Google processes an estimated 6.3 million searches.
- The size of Google’s search index surpasses 100 million gigabytes.
- In the EU, 59.7% of Google searches result in no clicks.
- Approximately 58.5% of Google searches in the U.S. on both mobile and desktop lead to zero clicks.
- The top organic search result on Google boasts an average click-through rate (CTR) of 27.6%.
- Each day, 15% of Google search queries are entirely new.
- In the U.S., 63% of Google searches are conducted on mobile devices.
- Google dominates the global search engine market, holding a 91.54% share.
- Google generates 66% of all web traffic referrals.
- Most Google searches are composed of three to four words.
- Featured snippets appear twice as often on desktop compared to mobile.
- 46% of Google searches are driven by local intent.
- Google’s Shopping Graph features more than 35 billion product listings.
- Half of the U.S. population utilizes voice-enabled search daily.
Google Search Statistics
- Google handles approximately 5.9 million searches every minute.
- The click-through rate (CTR) for top-ranking Google search results is 22.4%.
- Google processes around 16.4 billion searches each day.
- Every second, Google processes 189,815 searches.
- India leads in Google adoption with a penetration rate of 92.9%.
- The United States accounts for 19.44% of total Google traffic.
- Google holds a global search engine market share of 90.14%.
- The U.S. Google site receives 139.9 billion visits per month, with 6.4 billion of those visits coming from unique users.
- On average, Google processes more than 3.5 billion searches per day, totalling approximately 1.2 trillion annually.
- Google holds 80.41% of the desktop search engine market share.
- Every day, Google encounters 15% of queries that are completely new and never-before-seen.
- Google search volume increases by about 10% each year.
- The majority of Google search queries consist of 3 to 4 words.
- Google’s autocomplete feature saves users over 200 years of typing each day.
- A report reveals that 55% of users utilize voice search, with 20% starting to use it on mobile devices.
- 62.6% of all Google Web searches are conducted through Google Images
- 96.55% of pages do not receive any search traffic from Google, highlighting the difficulty in achieving search visibility.
- Businesses earn $8 for every $1 spent on Google Ads, underscoring the platform’s effectiveness in advertising.
- Approximately 15% of daily Google searches are entirely new, highlighting the dynamic and evolving nature of search behaviour.
- Alphabet’s Google dominates the global search engine market with a share of 89.33%across all platforms.
(Source: Google, Semrush Inc, Backlinko, MageComp LLP)
Voice Search Market Size
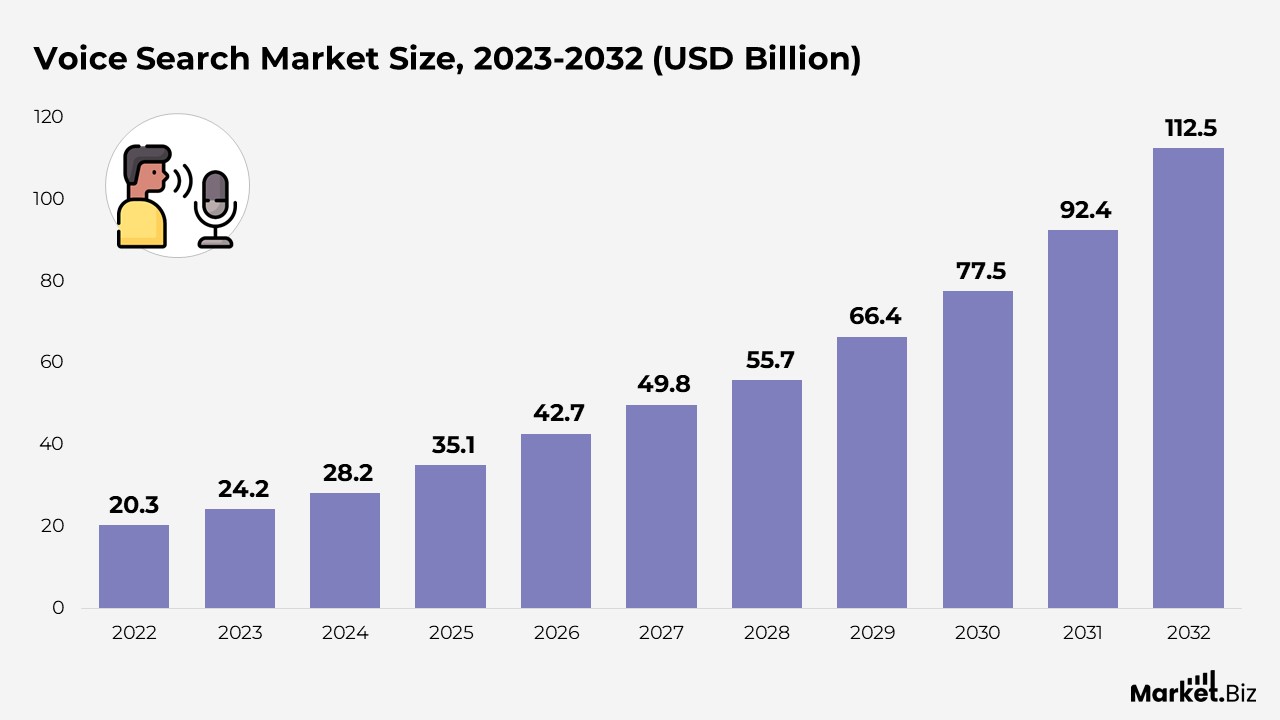
- According to Market.us, the voice search market is projected to grow from $24.2 billion in 2023 to $112.5 billion by 2032, representing a compound annual growth rate (CAGR) of 19.2% from 2023 to 2032.
- The market growth is primarily driven by the rising adoption of voice-enabled devices, such as Amazon Echo and Google Home, which significantly contribute to market expansion.
- The speech recognition segment holds the largest market share globally at 66%, primarily due to its use in smartphones and smart automobiles.
- The cloud deployment segment leads with a 59% share, expected to grow during the forecast period, driven by the widespread adoption of cloud technology in various industries.
- The non-AI-based technology segment holds a 73% market share, driven by its steady growth trajectory, which is attributed to its established presence and accessibility.
- The healthcare sector is the most lucrative industry vertical, accounting for a 29% revenue share, driven by its role in data collection within Electronic Health Records (EHRs).
- North America leads the global voice search market, accounting for a 33% share, and is projected to grow at a high CAGR, driven by the increasing adoption of voice search on various devices, including smartphones, smart TVs, and home appliances.
(Source: Market.us)
How Many Google Searches Occur Daily?
- According to data from March for U.S. Google users, the search engine processes an estimated 16.4 billion searches per day.
- This translates to approximately 189,815 searches per second, or roughly 11.4 million searches per minute on Google.com.
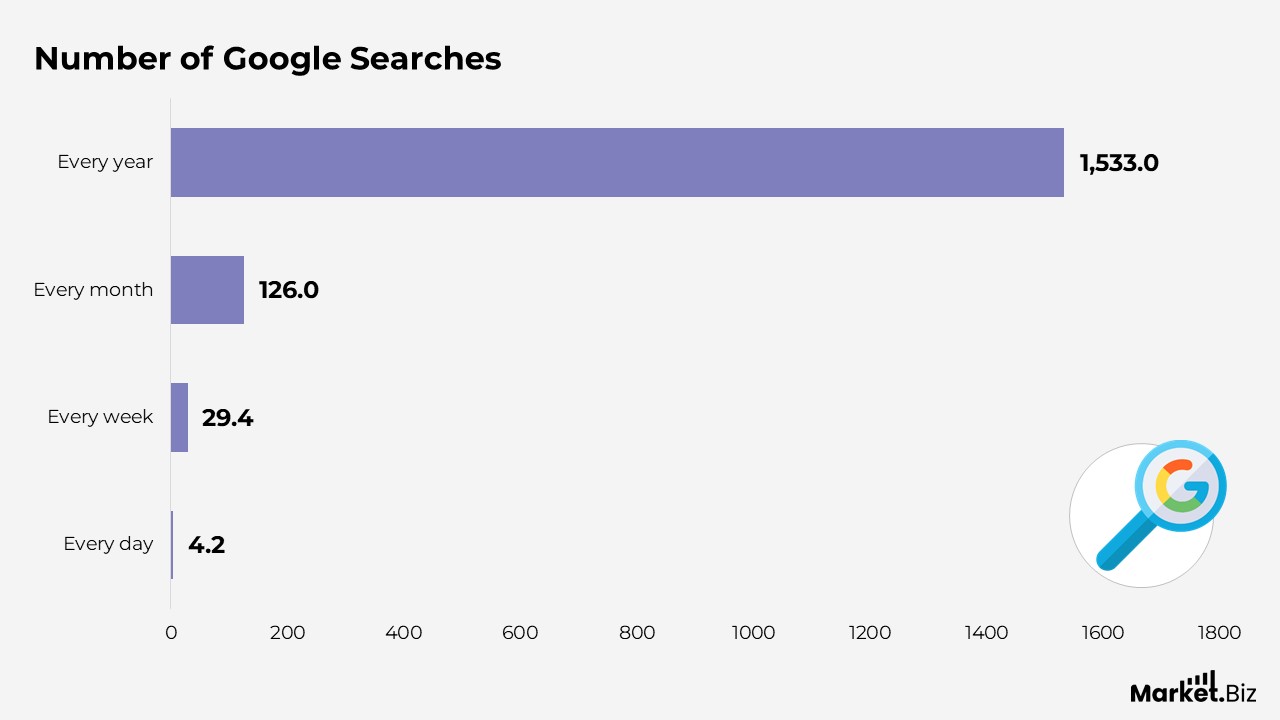
- On average, each Google user performs 4.2 searches daily, although the median number of searches is significantly lower at 1.8 searches.
- This suggests that while most users search infrequently, a smaller group of users conducts a significantly higher number of searches.
- Daily, users typically perform an average of 4.2 searches.
- Over the course of a week, this averages out to approximately 29.4 searches per day.
- In a month, users generally carry out around 126 searches.
- Annually, the average Google user conducts about 1,533 searches.
(Source: Semrush Inc., Exploding Topics)
Key Google Search and Advertising Statistics
- In the first 9 months of 2024, Google generated $144.05 billion in revenue from its search properties.
- Google dominates the global search engine market with a share of 89.33% across all platforms.
- 28.5% of Google searches in the U.S. lead to clicks on platforms owned by Google.
- On average, Google attracts 84.4 billion visits per month in 2024.
- Google holds a 51.9% share of the U.S. search advertising market.
- The U.S. contributes 26.94% of global desktop traffic to Google.
- Google accounts for 63.41% of U.S. traffic referrals..
(Source: Semrush Inc., Backlinko)
Audio Google Searches
- By the end of 2024, 50% of all Google searches are expected to be voice searches.
- Google processes over 1 billion monthly voice searches across Google Assistant-enabled devices.
- 41% of adults and 55% of millennials use Google Voice Search daily.
- Approximately 58% of Google users utilize voice search to locate local businesses, thereby linking voice search with Google Ads.
- 40% of adults use voice search to purchase or seek product information.
- 65% of voice searches are phrased as questions, with the most common query words being what, who, where, when, and how.
- Voice search is now a critical element of mobile-first SEO, with mobile queries making up 60% of all voice searches.
(Source: Semrush Inc., MageComp LLP)
Google Search Query Trends
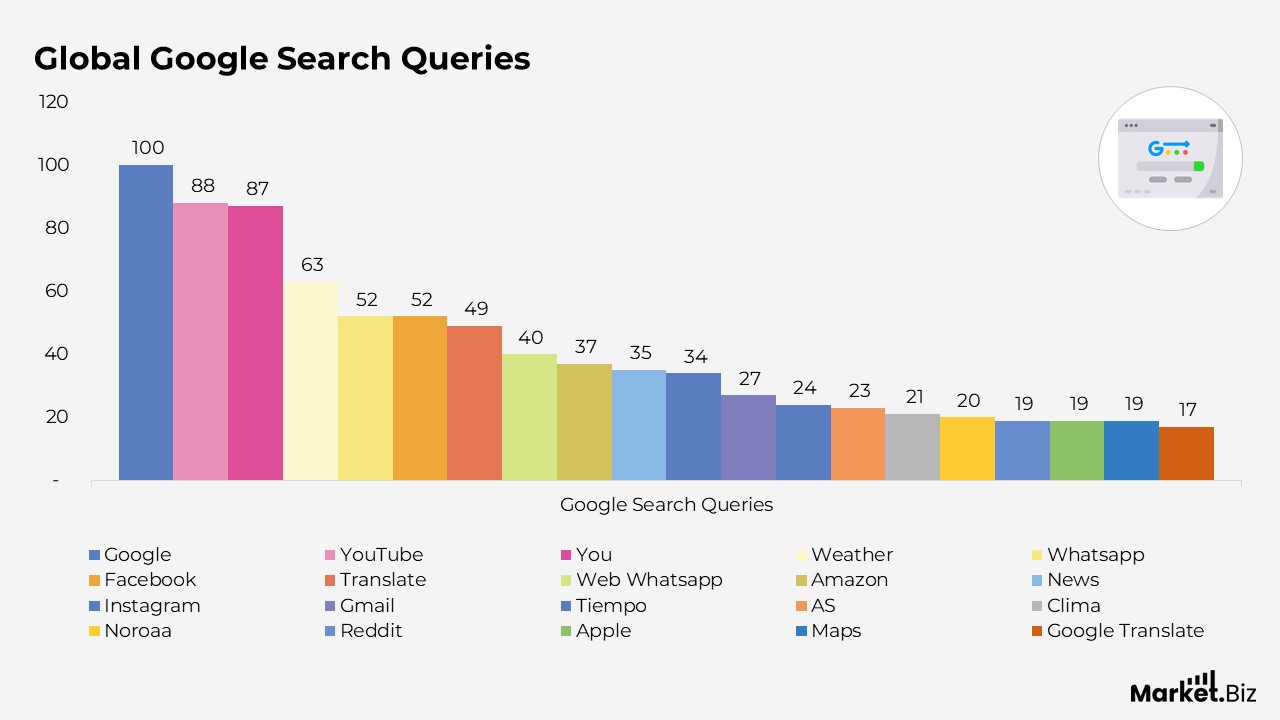
- In 2024, Google topped the list as the most searched query on the platform.
- You secured the 2nd spot with an index value of 79 points.
- YouTube followed in 3rd place, with an index value of 76 points.
- Facebook ranked 5th, holding an index value of 62 points for the top search query.
Local Google Search Statistics
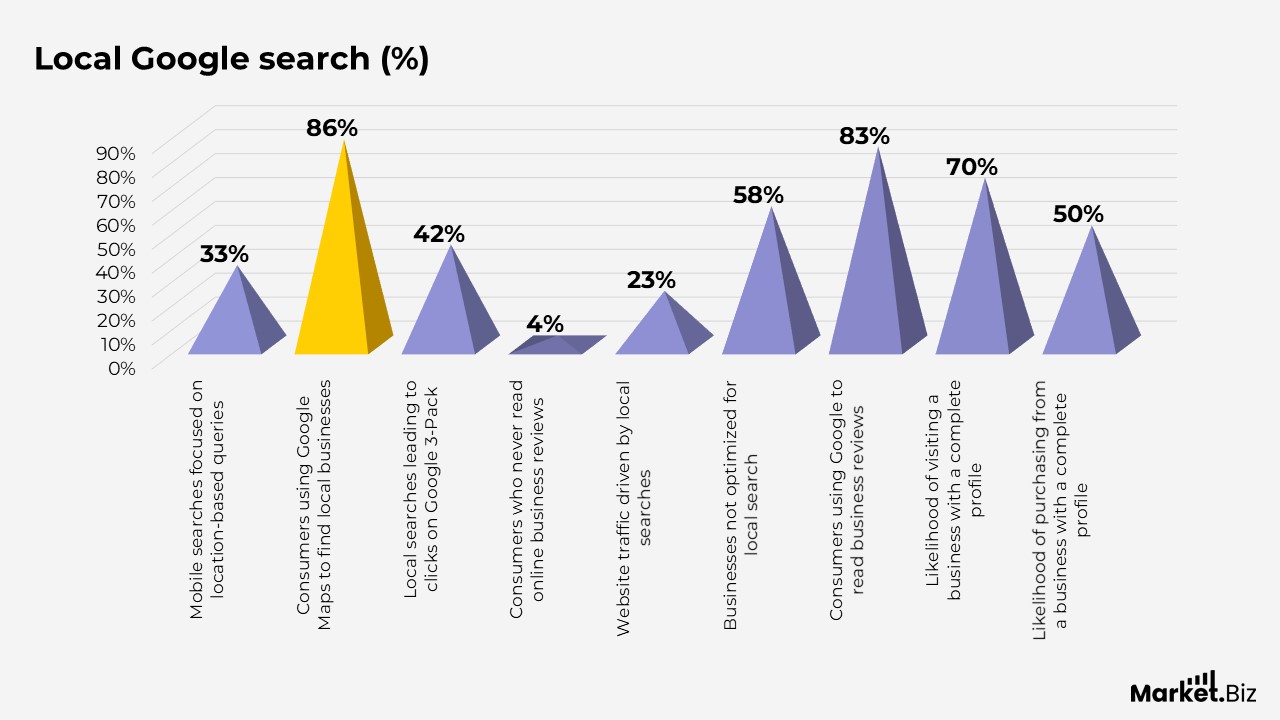
- One-third of mobile searches are focused on location-based queries.
- 86% of consumers rely on Google Maps to locate local businesses
- 42% of local searches result in clicks on the Google 3-Pack.
- Only 4% of consumers report that they “never” read online reviews for businesses.
- Local searches drive 22.6% of total website traffic.
- 58% of businesses fail to optimize their presence for local search.
- 83% of consumers use Google to read reviews about businesses.
- Customers are 2.7 times more likely to perceive a business as trustworthy when it has a complete Business Profile on Google Search and Maps.
- Consumers are 70% more likely to visit and 50% more likely to make a purchase from businesses with a fully completed Business Profile.
(Source: WebFX)
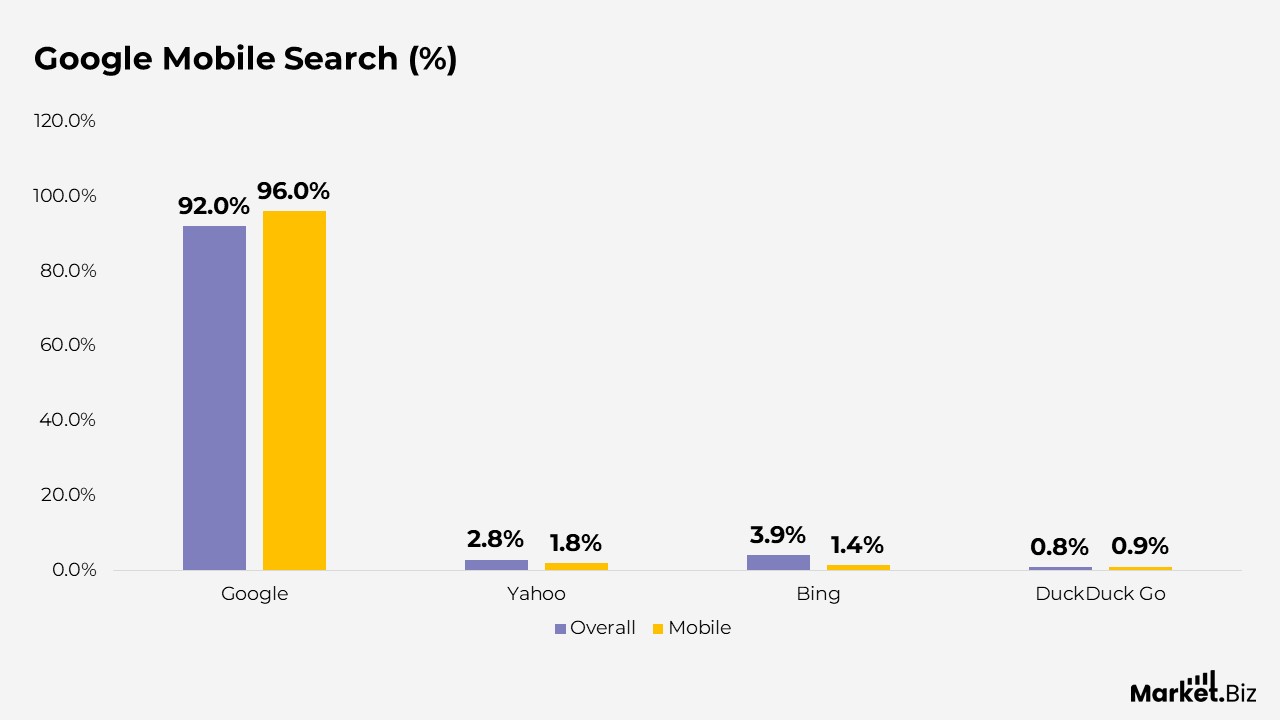
Google Mobile Search Statistics
- •96% of mobile search results are conducted on Google.
- According to a survey, 60% of mobile users are very likely to click on the first two to three search results they encounter.
- Google has stated that 30% of mobile queries are driven by local intent.
- The survey revealed the following hierarchy for near me query categories:
- Food – 84%
- Entertainment – 56%
- Banking – 50%
- Apparel – 41%
- Personal care – 38%
- When it comes to local retail searches, mobile users were looking for:
- Specific store/retailer – 48%
- Product category nearby – 29%
- Specific brand nearby – 23%
(Source: Staista, Search Engine Land)
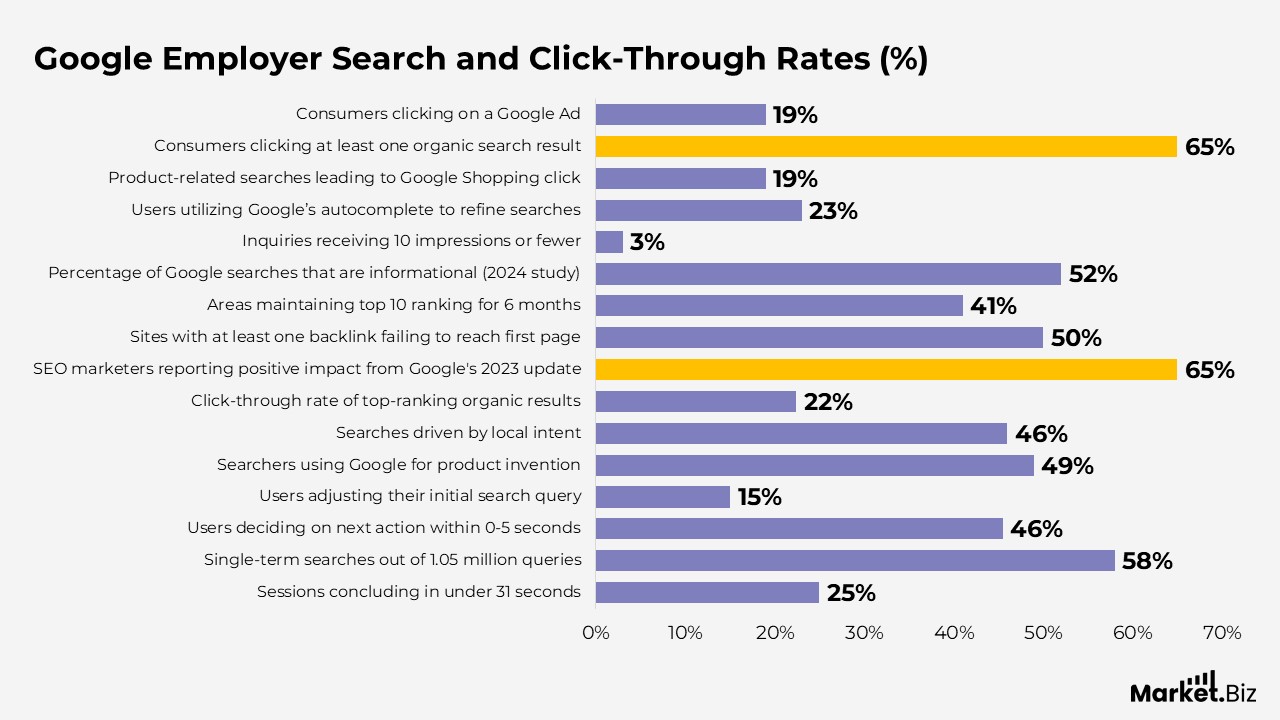
Google Employer Search and Click-Through Rates
- The typical Google search session persists 76 seconds, with 25% of sessions concluding in under 31 seconds.
- Out of 1.05 million queries, 58% are single-term searches.
- On average, users most commonly perform searches with 3-4 words.
- However, longer search queries, ranging from 10-15 words, get 1.76x more clicks than single-word searches.
- 45.5% of users decide on their next action within 0-5 seconds of initiating a search.
- 15% of users adjust their initial search query.
- Less than 1% of searches proceed to the second page of Google effects.
- Users are 19 times more likely to click on the top organic search result compared to the top paid search result.
- 49% of searchers use Google to invention new products.
- 46% of Google searches are driven by local intent.
- The top-ranking organic results on Google achieve a 22.4% click-through rate.
- 65% of SEO marketers report that Google’s 2023 algorithm update positively impacted their web traffic and SERP rankings.
- Web pages with the highest amount of backlinks are more likely to rank better on Google.
- 50% of sites with at least one backlink fail to reach the first page of Google’s search results.
- A click-through rate (CTR) higher than 3% is considered excellent for SEO performance.
- Longer content tends to rank 3.5 times higher than shorter content on Google.
- Keywords on the top 10% performance sites generally range from 3.2 to 3.5 words.
- 41% of areas that ranked in the top 10 positions maintained that ranking for 6 months.
- A 2024 study found that 52% of Google searches are informational, as opposed to transactional, commercial, or navigational searches.
- 3% of inquiries in Google Search Console receive 10 impressions or fewer, indicating a significant presence of long-tail keywords.
- 23% of users utilize Google’s autocomplete proposals to refine their searches.
- 19% of product-related examinations lead to a Google Shopping click.
- Only 3% of users engage with the People Also Ask (PAA) box, but this rises to 13.6% when the intent is related to purchasing.
- Branded search terms generally perform better than non-branded terms, particularly for e-commerce on desktop platforms.
- 65% of Google consumers click on at least one organic search result during their session.
- 19% of users click on a Google Ad, with transactional and commercial searches resulting in more ad clicks.
- 50% of Google consumers click within 9 seconds of starting a search, with the normal time to click being 14.6 seconds.
(Source: Backlinko, Sparktoro, Semrush, SEO.ai, Google)
Smartphone vs Desktop Search Statistics
- Approximately 60% of smartphone users directly contact a business through search results.
- In 2023, 82% of global desktop search marketing spending was directed to Google.
- In the desktop vs. mobile search statistics comparison, 25% of desktop Google searches result in no clicks, while about 17% of mobile searches end without a click.
- Approximately 56% of web traffic searches originate from mobile devices.
- Only 1.94% of Google traffic is generated from tablet devices.
(Source: Meetanshi Technologies LLP)
Paid Search Statistics
- Google Ads offers a substantial return on investment, with businesses earning an average of approximately 700% ROI. For every $1 spent on Google Ads, companies generate $8 in profit from both search and advertising.
- In 2024, the average click-through rate (CTR) for Google Ads across all sectors is 6.42%. The industries with the highest CTRs include Entertainment and Arts (13.04%), Sports and Recreation (9.66%), and Real Estate (9.20%).
- The average conversion rate (CVR) for Google Ads in 2024 is 6.96%. The highest conversion rates are seen in Automotive Repair and Parts (12.96%), Animals and Pets (12.03%), and Physicians and Surgeons (11.08%).
- The average cost per click (CPC) for Google Ads in 2024 is $4.66. The most expensive sectors include Attorneys and Legal Services ($8.94), Home and Improvement ($6.96), and Dental Services ($6.82).
- 63% of people are likely to click on a Google paid search advertisement, compared to 15% on Amazon, 9% on YouTube, and 5% on Bing, making Google ads four times more likely to be clicked.
- In 2023, Google took significant action by removing 5.5 billion ads, suspending 12.7 million advertiser accounts, restricting 6.9 billion ads, and blocking ads from appearing on 2.1 billion publisher pages.
(Source: Keywords Everywhere, Statista)
Google Ads Statistics
- 63% of individuals have clicked on a Google Ad at least once while browsing search results.
- Google Ads accounts for 29% of the total global digital ad expenditure.
- In 2019, Google Ads captured 73.1% of the paid search market share.
- Approximately 80% of businesses are projected to use Google Ads for their pay-per-click (PPC) campaigns.
- Google Ads generated $59 billion in revenue during Q4 of 2022.
- Google recommends a daily ad spend between $10 $50 for newcomers to advertising.
- 4 in 5 consumers prefer ads that are tailored to their location.
- In 2023, the average cost-per-click (CPC) for Google Ads was $4.22.
- The average conversion rate for Google Ads between 2022 and 2023 was 7.04%.
- For every $1 spent on Google Search Ads, advertisers can expect an average return of $8 in ROI.
(Source: CNBC, TechReport, Upbeat, Semrush, Sixth City Marketing, WordStream, Fit Small Business)
Google Business Profile Statistics
- 42% of users searching for local queries click on results within the Google Map Pack.
- 86% of people search for a business location directly on Google Maps.
- 46% of Google search queries reflect local search intent.
- 58% of businesses fail to optimize their online presence for local search.
- Consumers are 2.7x more likely to trust a business with a complete Google Business Profile on Search and Maps.
- 63.6% of consumers say they would check reviews on Google before visiting a business.
- Google Business Profile posts with titles receive nearly twice the number of clicks and double the conversions compared to those without titles.
- Posts with non-all-caps titles see almost twice the clicks compared to those with all-caps titles.
- Posts containing emojis garner twice the clicks and more conversions than those without emojis.
- Posts with images containing text receive nearly 4x more clicks than those without text.
- Posts featuring non-stock photos achieve 5.6x more clicks than those with stock images.
- Posts with calls-to-action on Google Business Profiles receive an average of 2.71 clicks per post.
- Posts conveying urgency receive an average of 2.68 clicks per post.
- Posts with the message “We are open” receive an average of 1.93 clicks per post.
- Posts highlighting awards or unique selling points receive an average of 1.36 clicks per post.
- Posts with questions generate an average of 1.23 clicks per post.
- Posts featuring products or services receive an average of 1.04 clicks per post.
- “Who we are” posts receive an average of 1.03 clicks per post.
- Seasonal posts generate an average of 0.75 clicks per post.
- Posts with reviews receive an average of 0.71 clicks per post.
(Source: Backlinko, AIOSEO, ReviewTrackers, Google, Sterling Sky)
Popular Search Keywords and Their Monthly Search Traffic
| Search Term | Average Monthly Search Volume |
|---|---|
| YouTube | 375,751,580 |
| 241,926,500 | |
| Amazon | 176,446,250 |
| Translate | 150,472,990 |
| Weather | 147,678,760 |
| 129,303,360 | |
| ChatGPT | 125,739,030 |
| Gmail | 110,366,650 |
| WhatsApp Web | 109,074,380 |
| NBA | 84,255,310 |
(Source: Similarweb, DemandSage)
Conclusion
Google remains the leading force in the search engine market, with the majority of mobile searches taking place on its platform. The rising significance of local intent in search behaviour underscores the importance for businesses to enhance their visibility, particularly for mobile and location-based queries.
Google plays a pivotal role in shaping consumer decisions, from helping users find businesses to reading reviews, making a robust online presence essential. As mobile and voice search technologies continue to develop, businesses must adjust to these changes in consumer behavior to maintain their competitive edge in a digital-first world.
FAQ’s
Google dominates the global search engine market, handling more than 90% of worldwide search queries.
Google processes approximately 6.3 million searches each minute.
Google accounts for 66% of all website traffic referrals globally.
Most Google search queries are generally three to four words in length.
About 30% of mobile searches on Google are motivated by local intent.
Approximately 83% of consumers rely on Google to read reviews, which significantly impact their purchasing choices.
By the end of 2024, it is projected that 50% of all Google searches will be voice searches.