
Introduction
Social Media Marketing Statistics: Social media marketing has become a vital tool for businesses seeking to connect with their audience and accelerate brand growth. With platforms such as Instagram, TikTok, and LinkedIn taking the lead, companies are harnessing the potential of social media to build meaningful relationships with their customers.
By using a mix of organic content and paid advertising, brands can effectively target specific audiences, strengthen connections, and boost brand awareness. Beyond just promoting messages, social media marketing also enables businesses to track campaign performance and make real-time adjustments.
As digital advertising continues to evolve, understanding key trends and statistics is crucial for businesses looking to stay ahead of the competition. This introduction delves into the influence of social media marketing, focusing on the strategies that drive success in today’s digital landscape.
Editor’s Choice
- Globally, there are 5.22 billion active social media users.
- Facebook remains the leading social media platform, with 3.07 billion users.
- 77% of marketers utilize Facebook and Instagram retargeting as part of their advertising strategy.
- 77% of businesses use social media to engage with their target audience.
- Retail social commerce in the United States generated USD 68.92 billion in sales by 2023.
- Short-form video content on social media proves to be 2.5 times more engaging than other types of content.
- A significant 71% of businesses plan to produce more video content for social media marketing.
- 33% of marketers believe Instagram delivers the highest return on investment compared to other platforms.
- On average, individuals use 6.7 different social networks each month.
- China holds the title of the world’s largest social media market.
- In 2024, the global average time spent on social media daily is expected to be 143 minutes.
- Facebook leads in popularity, with 3 billion, 65 million active users monthly.
- The number of global social media users is projected to exceed 6.05 billion by 2028, representing more than half of the world’s population.
General Social Media Marketing Statistics
- 58.4% of the global population, or 4.26 billion people, currently use social media.
- The average person spends 2 hours and 27 minutes per day on social media platforms.
- On average, a social media user is active on 6.6 different platforms.
- Since 2012, social media has experienced an average compounded growth rate of 12%.
- In 2021, social media grew at an average rate of 13.5 new users every second.
- Nearly 75% of the global population aged 13 and above engages with social media in some capacity.
- 93% of regular internet users also use social media.
- 72% of Americans actively participate in social media activities.
- Over 60% of people worldwide actively use social media platforms.
- By 2029, the United States is expected to have 335 million social media users.
- Currently, there are approximately 302 million social media users in the United States.
- On average, people spend 143 minutes daily on social media.
- By 2027, the global number of social media users is projected to reach 6 billion.
- Currently, there are around 5.2 billion social media users globally.
- The social network penetration rate in the United States stands at 69.7%.
- The global social network penetration rate is 63.9%.
(Source: Statista, searchlogistics.com)
Social Media Adoption Statistics
- As of January 2024, 5.35 billion people worldwide are internet users.
- The global social media penetration rate currently stands at 62.3%.
- Out of the 5.35 billion internet users, 5.04 billion people, or 62.3% of the global population, are active on social media.
- Northern Europe leads globally in social media usage with a penetration rate of 81.7%.
- By 2027, the number of social media users is projected to reach 5.85 billion.
- 75% of individuals aged 13 and above engage with social media in some form.
- The monthly operator base of X (formerly Twitter) is expected to decline by 5.1% in 2024.
- 69% of North American online shoppers, who frequently visit Meta platforms, made purchases after viewing personalized ads on Facebook or Instagram.
- 85% of US online shoppers are open to discovering new products through online platforms.
- 60% of marketing professionals acknowledged difficulty in measuring the ROI of social media marketing.
- 54% of teens admit that quitting social media would be challenging, according to a survey by Pew Research Center.
Moreover
- 61% of US online shoppers are more likely to try new brands or products if suggested by social media.
- In 2025, the average time spent on social media by internet users worldwide decreased slightly to 141 minutes per day, down from 143 minutes in the previous year.
- Brazil leads the world in social media engagement, with users spending an average of 3 hours and 49 minutes per day on social platforms.
- In contrast, the United States has a lower average, with users spending just 2 hours and 16 minutes on social media daily.
- Northern Europe tops the global rankings, with a social media penetration rate of 81.7%.
- Eastern and Middle Africa have the lowest penetration rates, with 10.1% and 9.6% of the population, respectively, using social media.
- Social media serves various purposes for users, including finding entertaining content, sharing photos and videos, and primarily staying updated on current events and connecting with friends.
(Source: Pew Research Center, Statista, searchlogistics.com)
Digital Marketing Outsourcing Market Size
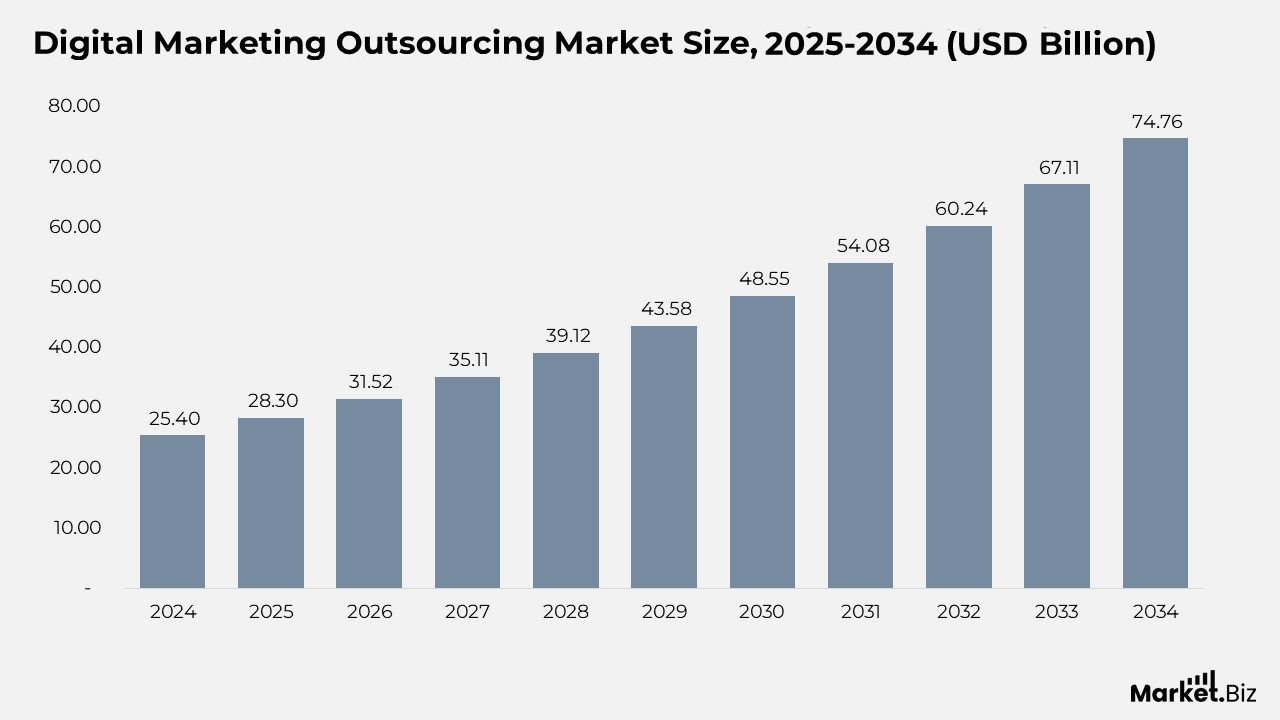
- According to Market.us, the digital marketing outsourcing market is expected to rise from $28.30 billion in 2025 to $74.76 billion by 2034, representing a compound annual growth rate (CAGR) of 11.4% from 2025 to 2034.
- Growth of the market is fueled by enhanced performance and innovation, leveraging specialized external expertise to outsource digital marketing activities like SEO, content creation, social media management, paid media strategy, and performance analytics.
- The Digital Marketing segment held a dominant market share of 53.7% in 2024, driven by its critical role in navigating the digital consumer journey and advancements in technology and automation.
- The IT & Telecommunications segment captured 23.8% market share in 2024, reflecting the industry’s rapid digital transformation and increased reliance on marketing technologies.
- North America dominated the market with a share of 38.6% in 2024, generating USD 9.8 billion in revenue, thanks to early adoption of digital technologies, a skilled talent pool, and data-driven industries.
- The US Digital Marketing Outsourcing Market was estimated at USD 8.8 billion in 2024 and is projected to grow to USD 23.5 billion by 2034, expanding at a CAGR of 10.3% from 2025 to 2034.
(Source: Market.us)
Digital Media Subscription Market Size
- According to Market.us, the digital media subscription market is expected to grow from $36.6 billion in 2025 to $323.3 billion by 2034, representing a compound annual growth rate (CAGR) of 27.4 % from 2025 to 2034.
- Market growth is driven by the proliferation of high-speed broadband and mobile internet, fueling the expansion of the Video-on-Demand (VoD) Subscription Market.
- In 2024, the video segment held a dominant market share of 36.2%, led by the rapid growth of streaming platforms and increasing demand for on-demand visual content.
- The smartphone segment captured 34.2% of the market in 2024, reflecting the global penetration of mobile devices, with over 5.61 billion people owning smartphones.
- The marketing & advertising segment held 38.6% market share in 2024, driven by the shift of marketing budgets towards digital channels, with 77.7% of US media ad spending flowing through digital.
- The monthly payment model dominated the market with a 35.6% share, reflecting consumer preference for flexibility, lower upfront costs, and the ability to cancel services without long-term commitments.
Moreover
- The tiered subscriptions segment captured 42.4% of the market, driven by its ability to cater to different consumer segments with basic, standard, and premium tiers.
- The entertainment segment led the market with a 28.5% share in 2024, due to the rising demand for entertainment-related digital content.
- North America held 34.8% of the digital media subscription market in 2024, generating USD 9.9 billion in revenue, thanks to high internet penetration and widespread digital content consumption.
- The US digital media subscription market was valued at USD 7.9 billion in 2024 and is projected to reach USD 77.2 billion by 2034, growing at a CAGR of 25.6% from 2025 to 2034.
- By 2029, the market is expected to reach around USD 24.7 billion, supported by technological innovations and evolving media consumption behaviors.
- The monthly payment model held 35.6% market share, indicating a preference for flexible billing cycles over annual commitments.
- Video content dominated the content category with 36.2% market share, driven by the increasing demand for streaming platforms and exclusive content.
- Smartphones led as the primary platform with 34.2% market share, fueled by mobile-first consumer behavior and app-based media consumption.
(Source: Market.us)
Platform-Specific Social Media Statistics
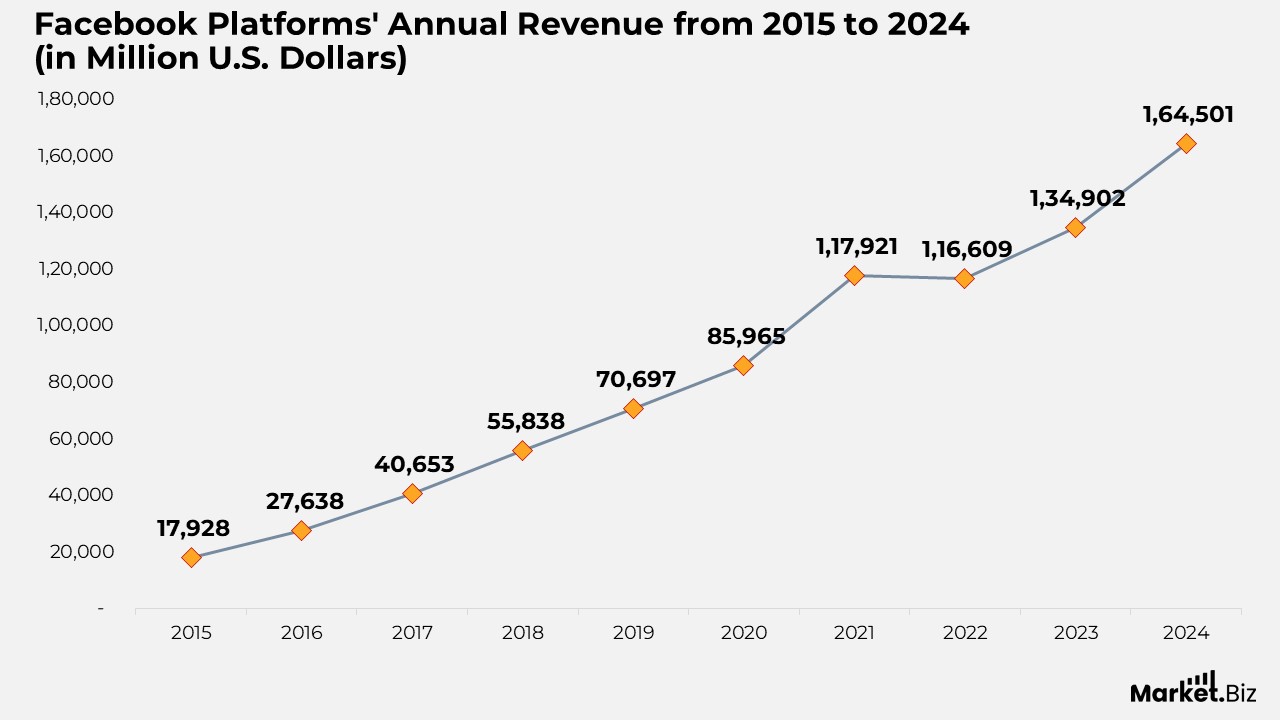
- Meta Platforms (formerly Facebook Inc.) generated $164.5 billion in total revenue.
- 3 billion people globally are active on Facebook, with 2 billion engaging daily.
- The advertising revenue from Meta is $162 billion.
- $13.12 is the average revenue per user for Facebook.
- Over 1.1 billion fake accounts are removed quarterly.
- 86% of marketers use Facebook for advertising purposes.
- 72.13% of Facebook’s US user base is active.
- 44% of marketers view Facebook as the most vital social media platform.
- Pinterest enjoys a global monthly user base of 570 million.
- 69.4% of Pinterest’s audience is female.
- 96% of Pinterest’s top searches are unbranded.
- 80% of weekly Pinterest users discover new brands on the platform.
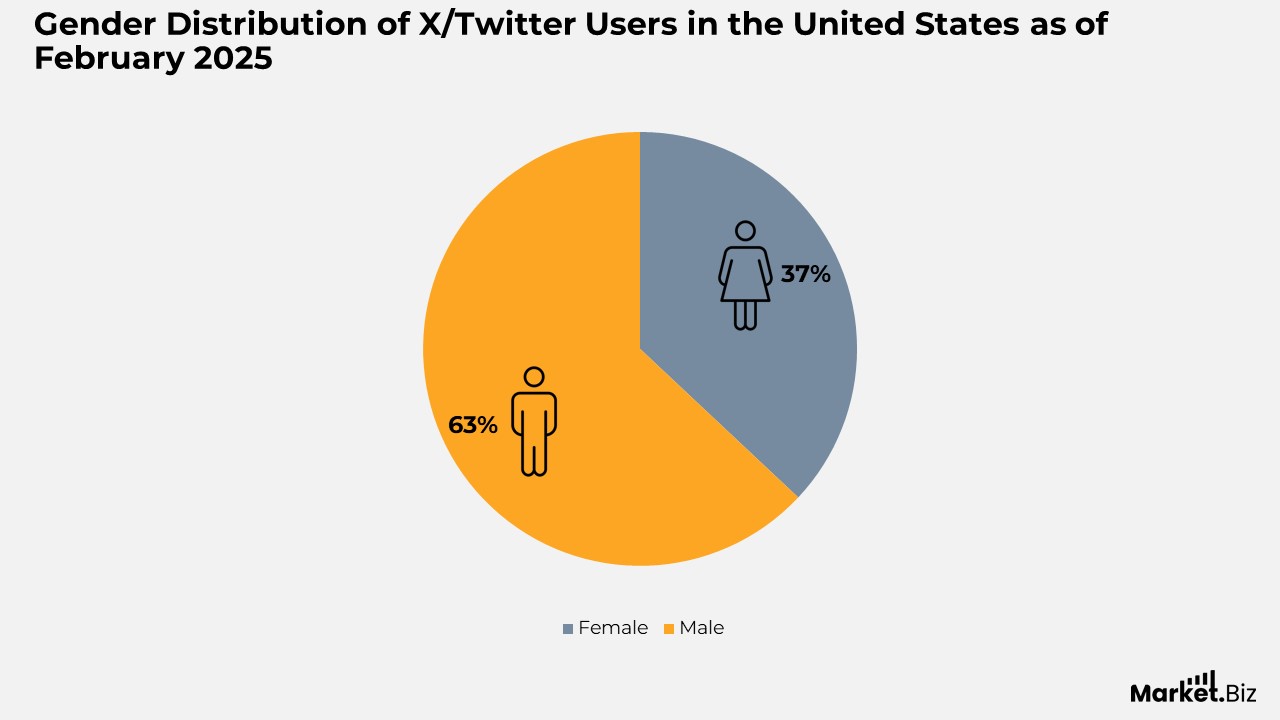
X (formerly Twitter)
- Users spend over 7 billion minutes on X daily.
- The platform has 429 million active users, with 106 million in the US.
- 640,000 users subscribe to Twitter Blue.
- 80% of X’s US users access the platform for entertainment.
- The average X user spends more than 32 minutes on the platform daily.
- Every day, 1.5 million people sign up for X.
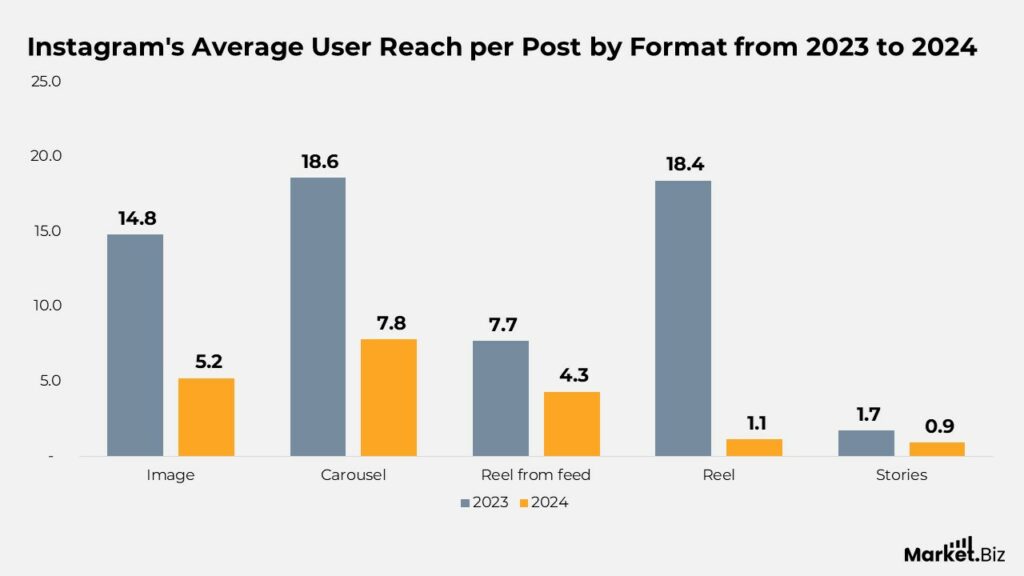
- 2 billion people are active on Instagram each month.
- 547 million times has the Instagram app been downloaded globally.
- 169 million Instagram users reside in the US.
- Instagram users have an average reach of 5,200 per image post.
- 80% of marketers use Instagram for their advertising campaigns.
- Over 50% of Instagram users globally are under 34 years old.
- 31.7% of Instagram’s audience is aged between 18 and 24 years.
TikTok
- TikTok’s brand value in 2025 is projected to exceed $106 billion.
- 44.3% of TikTok’s users are female.
- Users spend over 34 hours monthly on TikTok worldwide.
- The app has been downloaded 825.5 million times globally.
YouTube
- YouTube’s global advertising revenue reached over $10.4 billion in Q3 of 2024.
- 100 million users in the US subscribe to YouTube Premium.
- 2.5 billion people visit YouTube each month.
- Mobile and smartphone devices account for 70% of YouTube’s traffic.
- YouTube attracts 240 million users in the US.
Snapchat
- The platform has 548 million global users and 453 million daily active users.
- Snapchat generated $5.36 billion in annual revenue for 2024.
- 48% of US internet users aged 15-25 use Snapchat.
- LinkedIn generated $16.37 billion in revenue in the fiscal year 2024.
- 56% of LinkedIn’s global user base is male users.
- 44% of LinkedIn’s users are female.
- 175.5 million LinkedIn users are located in North America.
- 65% of online marketers use LinkedIn for advertising.
(Source: Pew Research Center, Statista, searchlogistics.com)
Social Media Strategy Statistics
- 70% of marketers employ a dedicated person to oversee social media commerce channels within their organizations.
- 86% of marketers recognize that having an active online community is a key element for a successful social media strategy.
- Engagement on social media content increases by 1.6 times when creators actively respond to comments.
- 62% of marketers plan to integrate social listening tools into their social media strategies.
- 82% of social marketers feel they are well-informed about the latest trends and updates in the social media landscape.
- For about 25% of organizations, content on social media is predominantly created with an entertainment focus, ranging from 80-100%.
- Social media posts with comments between 10 and 99 characters tend to drive the highest engagement rates.
(Source: HubSpot, Hootsuite, Sixth City Marketing)
Social Media Advertising Statistics
- Globally, over US$296 billion is spent on social media advertising. The mobile segment dominates, with a value of US$212.68 billion.
- By 2028, social media advertising is projected to reach 6,054 million users.
- 89% of marketers use Facebook for advertising, making it the most popular platform. Instagram follows with 80% usage among marketers.
- The cost-per-mile (CPM) for social media advertising is US$6.06 for 1,000 impressions.
- 70% of marketing teams have an employee dedicated to social commerce management.
- The United States is the leading market for social media ads globally.
- Marketers rank increased exposure as the top benefit of social media advertising, followed by enhanced lead generation, traffic, and increased fan loyalty.
- 22% of consumers report using social media more often than search engines to discover products and brands.
- 73.8% of internet users use social media platforms to research businesses, and 87% of social media marketers view social search as critical to their strategies.
- 52% of marketers sell products directly through social media apps, and 25% of consumers have purchased products through these platforms.
- 69% of businesses use engagement as the primary metric for measuring the success of their social media campaigns. 51% measure impressions and views, 49% track followers, and 43% measure clicks and traffic for ROI.
- 28% of Gen Z and millennials use social media to research brands.
- Social media impressions have increased by 20% in recent years, driven mainly by passive ad types such as stories and videos.
(Source: Statista, HubSpot, Hootsuite, Influencer Marketing Hub)
Social Media Influencer Statistics
- 93% of marketers have incorporated influencer marketing into their strategies.
- Half of Millennials trust product recommendations from influencers, emphasizing their significant role in online marketing.
- In the past three months, 33% of Gen-Z consumers made purchases based on an influencer’s recommendation.
- 67% of marketers plan to increase their influencer marketing budgets in 2023.
- The global influencer marketing industry is expected to reach US$21.2 billion in 2023.
- China leads the world in influencer marketing spending, with an expenditure of US$16.76 billion.
- Worldwide, 25% of brands dedicate 10-20% of their marketing budget to influencer marketing.
- TikTok is the most popular platform for influencer marketing, with 56% of marketers incorporating it into their strategies.
- Instagram remains a top platform for influencer marketing, with 3.8 million posts featuring the hashtag ad in 2021.
- Micro-influencers generate up to 60% more engagement than macro-influencers, demonstrating their power in campaigns.
(Source: Morning Consult, Ocean Sky Network Co., Ltd., Mandala AI, HubSpot, Business Industry, Sprout Social, Forbes, Emplifi)
Conclusion
Social media marketing remains a powerful force in the digital realm, with billions of active users across numerous platforms. The data underscores the vast reach and impact of platforms such as Facebook, Instagram, and X, highlighting how businesses can strategically utilize these channels to engage with their audience and foster growth.
As social media continues to evolve, marketers need to stay attuned to user behavior, platform-specific trends, and emerging opportunities. By adjusting strategies to align with shifting user preferences, companies can maintain a competitive edge, improve brand awareness, and optimize their return on investment.
The future of social media marketing promises even more innovation, as new formats and technologies continue to redefine how businesses connect with their audiences.
FAQ’s
Social media marketing is the practice of using platforms like Facebook, Instagram, LinkedIn, and Twitter to promote a business’s products, services, or brand. It involves creating engaging content, running paid advertisements, and interacting with users to boost brand recognition, drive traffic, and increase sales.
Social media marketing plays a vital role in helping businesses connect with a vast audience, foster customer relationships, and raise brand awareness. It offers a cost-effective way to reach specific demographics, track marketing performance, and measure return on investment (ROI), enabling companies to stay competitive.
The best social media platforms for marketing depend on a business’s target market and objectives. However, platforms such as Facebook, Instagram, LinkedIn, X (formerly Twitter), and TikTok are popular choices due to their large user bases, advanced targeting features, and diverse content formats that facilitate engagement.
As of 2024, the average person spends approximately 141 minutes daily on social media. This duration varies depending on the region and platform, with some users engaging for longer periods.
Businesses can evaluate the success of their social media marketing through metrics such as:
– Engagement rate (likes, shares, comments)
– Click-through rate (CTR) on posts and ads
– Conversion rates (sales or sign-ups driven from social media traffic)
– Follower growth and reach
– Return on investment (ROI) comparing campaign costs to generated revenue