
Introduction
Facebook Video Statistics: Videos are extensively used by marketers, content creators, and businesses to increase brand recognition, increase conversions, and promote various products and services on Facebook. With more than 3 billion users, Facebook is undoubtedly the largest social media platform in the world. The site has connected individuals with unmatched connectivity and a vast array of content.
Therefore, one of its most significant attractions is its videos, which generate billions of views each day. Indeed, Facebook has begun as a competitor to some of the largest dedicated video streaming services regarding viewership. It has also established itself as a viable channel for video marketing initiatives.
Editor’s Choice
- More than 100 million hours of video are viewed on Facebook daily.
- 46% of social media users use Facebook for video viewing.
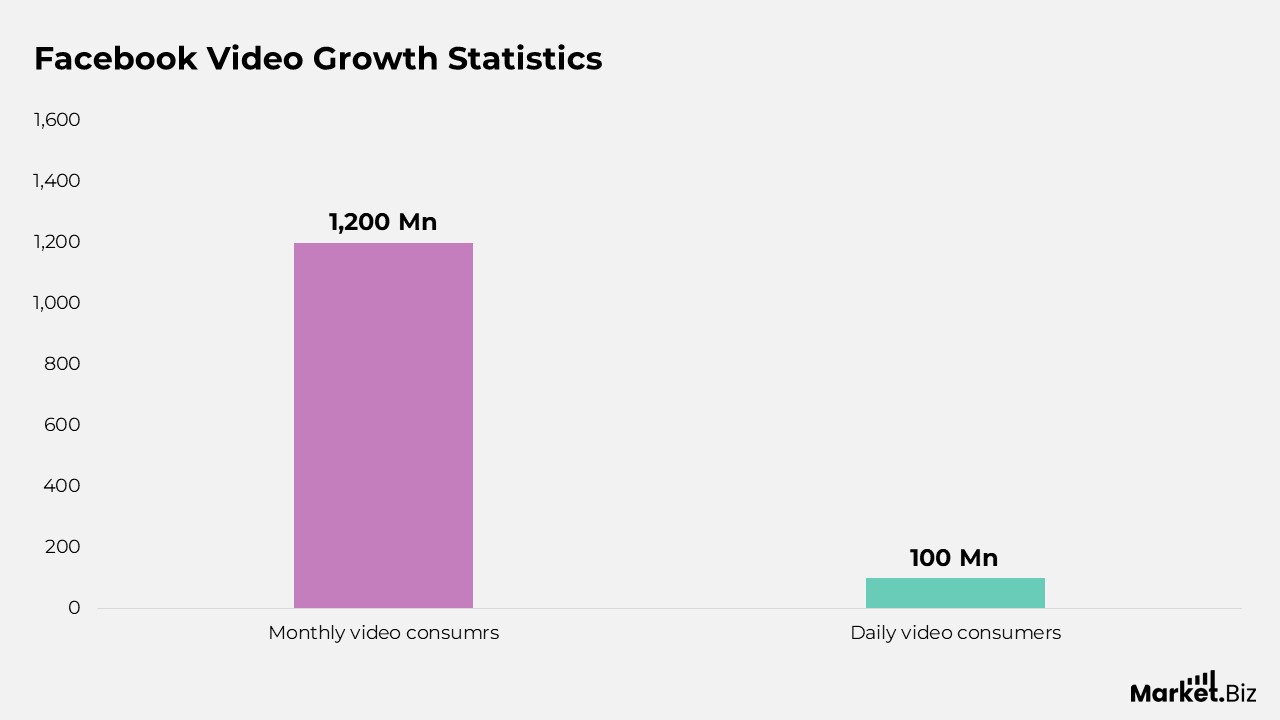
- Facebook has an impressive 1.2 billion users who watch videos each month.
- Facebook’s video advertisements contribute to over 50% of its total advertising revenue.
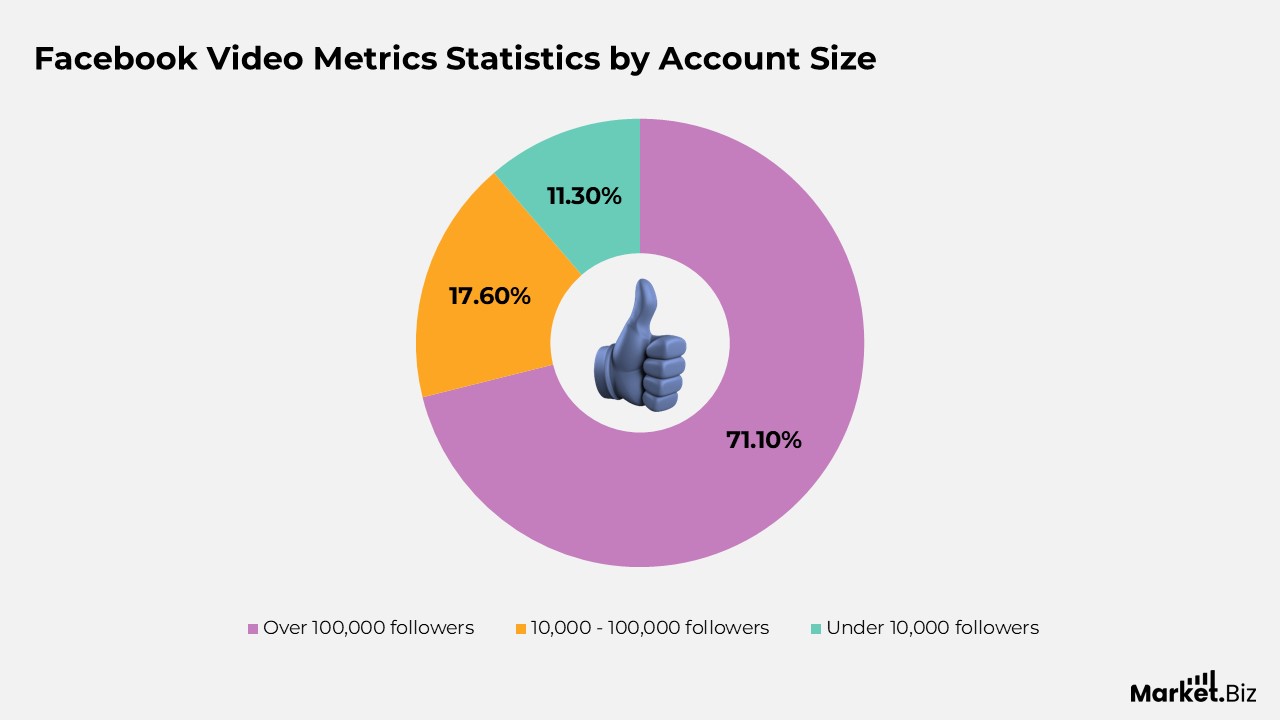
- For accounts with audiences between 0 and 5,000, Facebook videos ensured a click-through rate (CTR) of 29.66%.
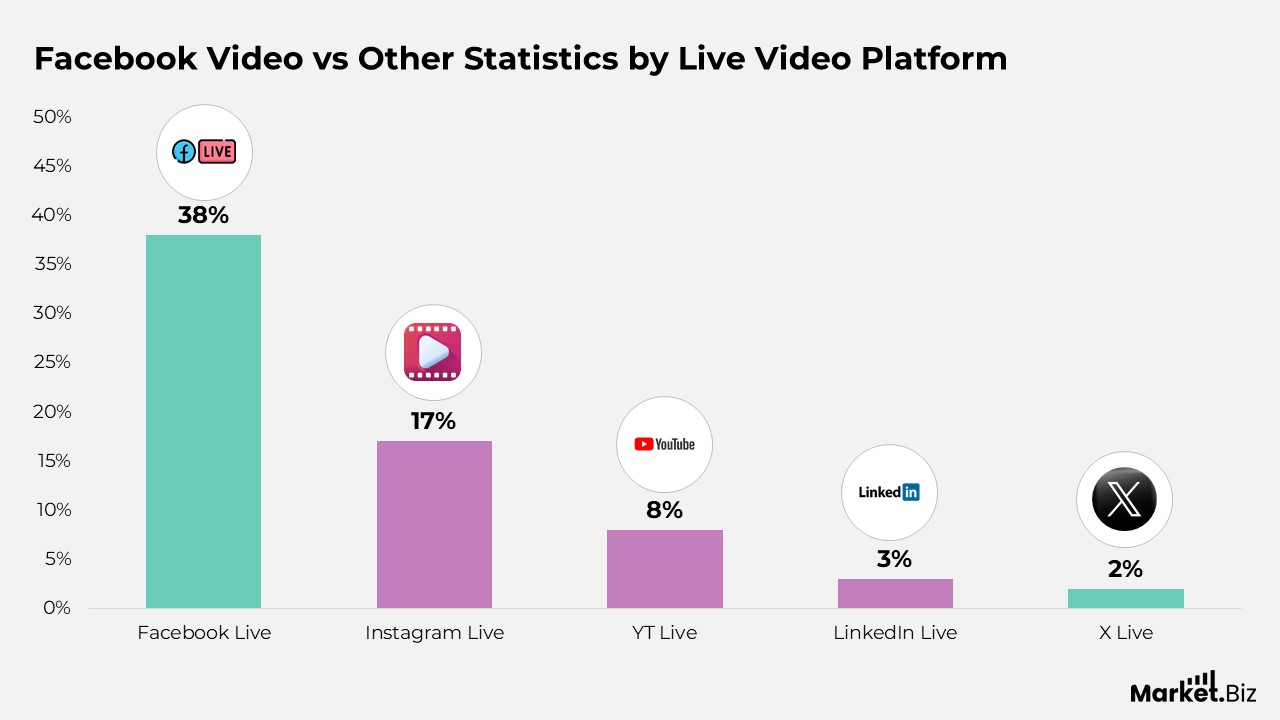
- The likelihood of viewing a live stream is four times greater. Engagement with live stream videos on Facebook is 26% higher than on other platforms.
- Facebook video posts show an average engagement rate of 6.01%.
- In 2024, the typical cost per click for Facebook video advertisements is approximately USD 1.86.
- According to Facebook Video Statistics, the cost for 1,000 impressions of Facebook video advertisements is USD 7.19.
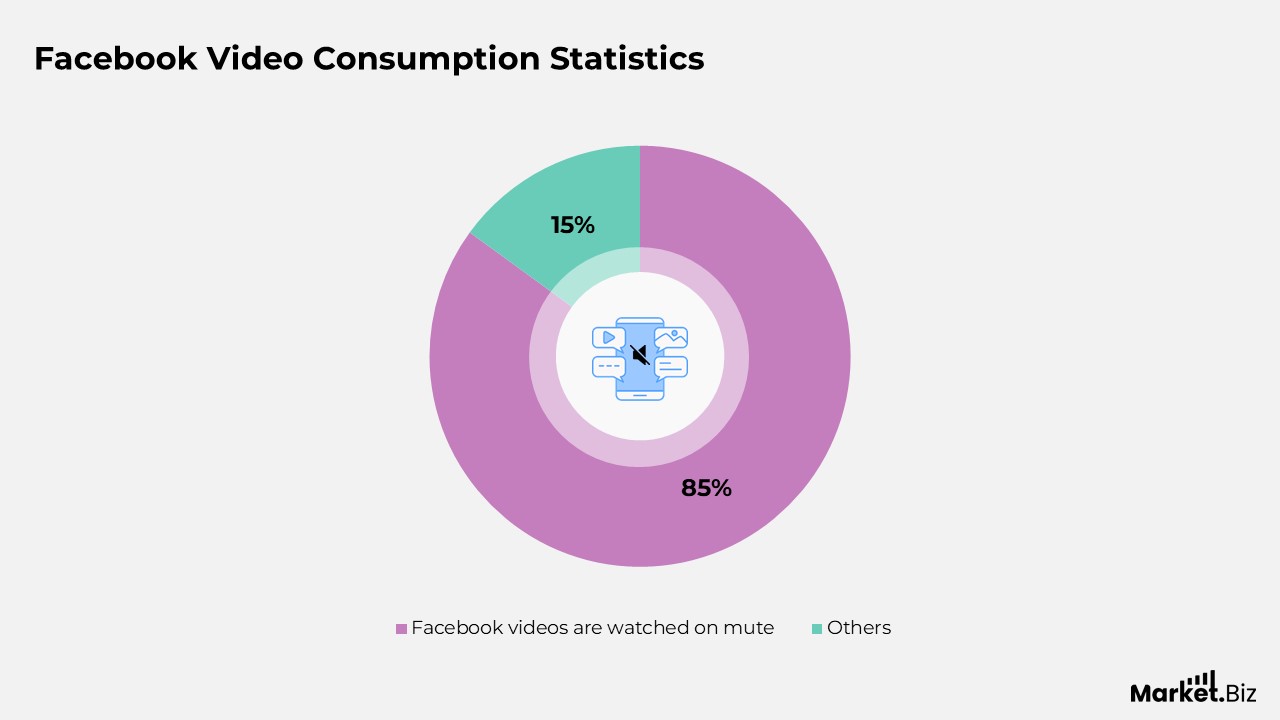
- 85% of Facebook videos are watched on mute. Highlights the unexpected statistic regarding soundless video viewing.
- Mobile-optimized Facebook videos can uplift brand awareness by as much as 67%.
General Facebook Video Statistics
- This estimate is likely old-school, considering that the 8 billion figure originates from 2015. The user base of the platform has grown considerably over the past 6 years, suggesting that the current number is probably much higher.
- Interestingly, those 8 billion views were generated by only 500 million users who engage with videos on the platform, indicating that the average user watches 16 videos daily.
- This amounts to over 6 billion minutes, 4.1 million days, or 11,000 years of content consumed each day.
- More than 100 million hours of video are viewed on Facebook daily.
- Currently, video constitutes nearly 50% of all time spent on Facebook.
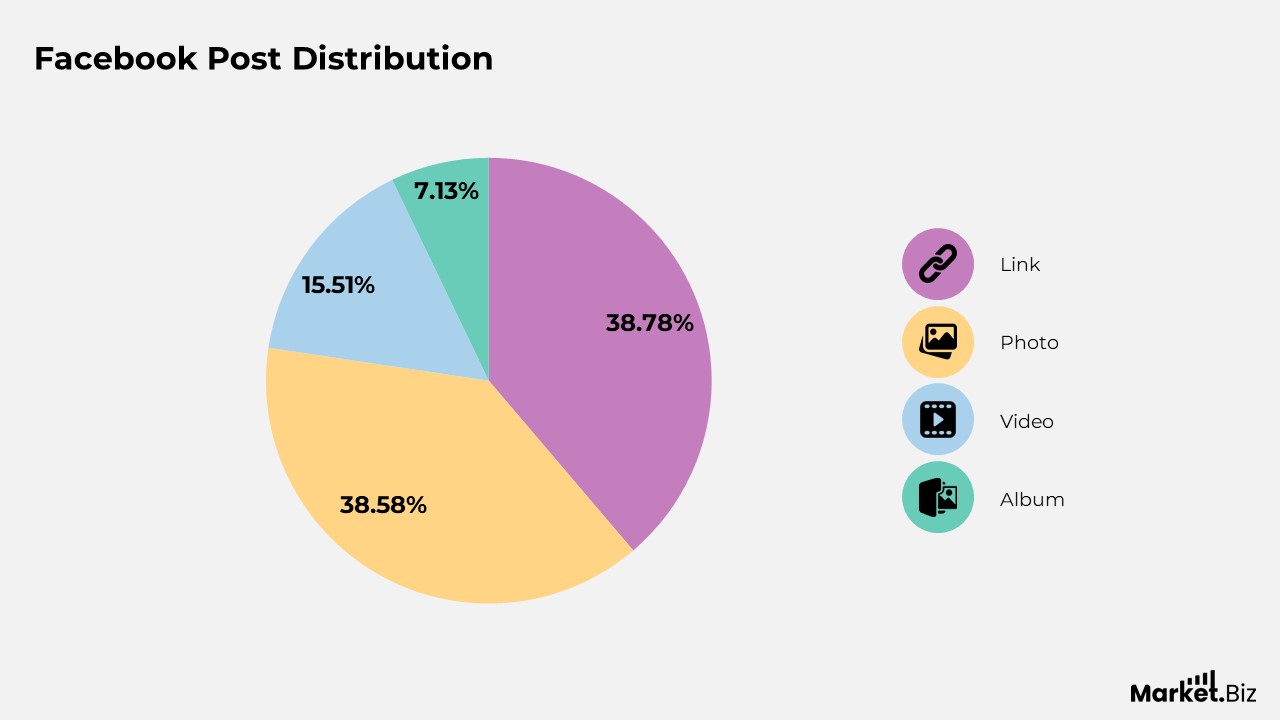
- 15.5% of posts on Facebook are videos.
- This is an increase from 12% last year, indicating a growing popularity of video content. This trend somewhat supports Zuckerberg’s forecast that video will play an increasingly significant role in how users interact with the platform.
- Nevertheless, this statistic also indicates that Facebook is not yet mainly a video platform, as the majority of posts remain photos (38.6%) and links (38.8%).
- 46% of social media users use Facebook for video viewing.
- According to a Statista report from 2019, 46% of participants reported using Facebook to watch videos. This places it slightly behind Instagram (51%) and Snapchat (50%), but well ahead of Pinterest (21%) and Twitter (32%).
- For users in this demographic, online video consumption has become almost instinctive, with 61% often finding themselves watching multiple videos consecutively. Furthermore, 58% admitted to doing so without deliberate thought.
- 68% of respondents indicated that they watch videos on Facebook and Instagram on a weekly basis.
FB Video Growth Statistics
- Facebook has an impressive 1.2 billion users who watch videos each month.
- Reels have experienced significant growth, achieving over 200 billion daily plays on Facebook, thereby creating a substantial market for short-form videos.
- Users dedicate 100 million hours each day to watching videos on Facebook, which equates to approximately 11 thousand years of video viewing.
- As per user feedback, 62% indicate they are more inclined to buy a product after watching a video on Facebook.
- Video posts receive 59% more engagement compared to any other type of post. Indeed, moving images convey much more than mere words.
- A remarkable 84% of businesses utilize Facebook videos as a key component of their advertising strategy.
- Marketers who employ video advertisements for their brands experience a 20% higher conversion rate compared to traditional static ads.
- Facebook’s video advertisements contribute to over 50% of its total advertising revenue.
- Viewers engage with live videos six times more than with pre-recorded content.
Facebook Video Engagement Statistics
- Individuals allocate five times more time to viewing video content compared to static content.
- The same research indicated that viewers maintained their gaze on 360° videos for 40% longer than on standard videos.
- The complexity of filming 360° videos, which is significantly greater than that of regular videos, may contribute to their limited adoption, even though they have been shown to be more attractive.
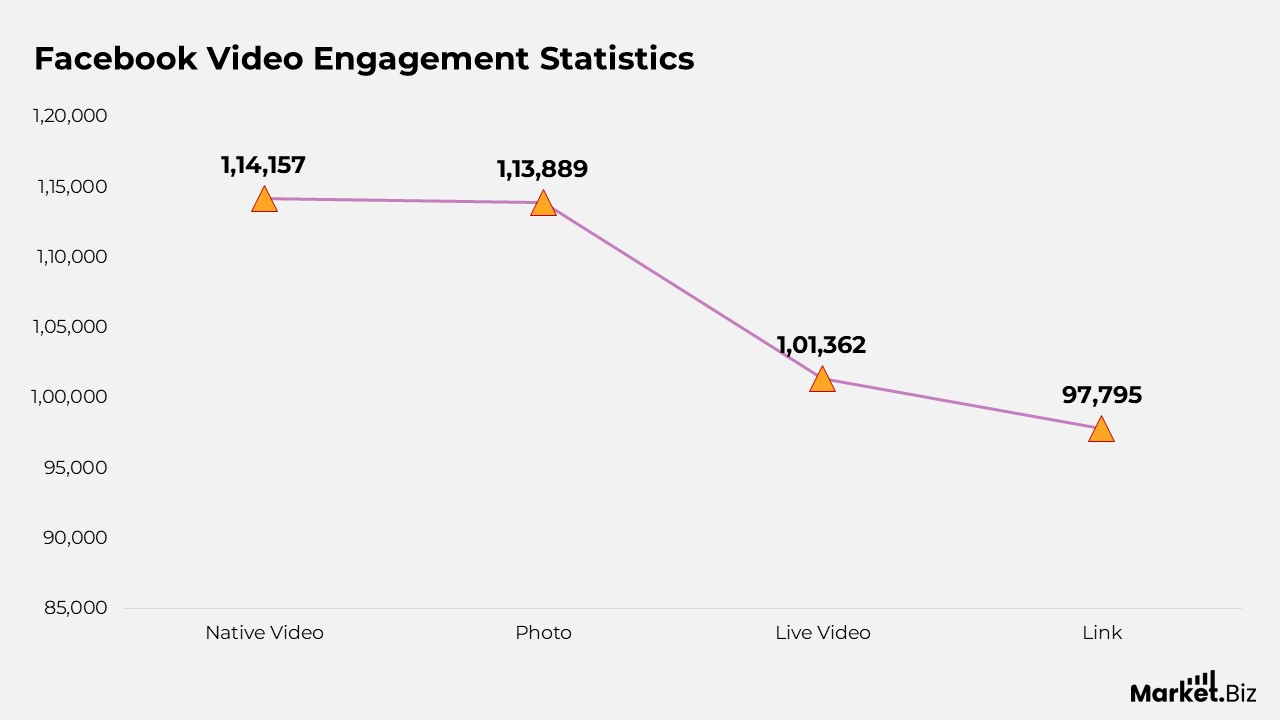
- Native videos on Facebook yield ten times the number of shares compared to videos on YouTube.
- An analysis encompassing over 6.2 million profiles revealed that native Facebook videos achieved a share rate that is 1055% higher than that of YouTube videos, along with 110% more interactions.
- Consequently, due to Facebook’s obvious preference for native videos, 90% of profile pages use native videos, in contrast to only 30% that incorporate YouTube.
FB Video Demographics Statistics
- Individuals aged 25 to 34 represent the largest segment of Facebook users, making up 31.6% of the total.
- When analysed by gender, the main male demographic on Facebook is within the 25–34 age range, constituting 18.8% of all users. Compared to the largest female demographic also falls within the 25-34 age range, accounting for 12.8% of the total user base.
- Additionally, in the United States, 32% of individuals aged 12 to 34 are the most active users of Facebook.
- The platform has a usage rate of 69.25% across various income levels. Specifically, 70% of users earning less than $30,000 use the platform, 77% of those earning between $30,000 and $49,999, 61% of individuals with incomes ranging from $50,000 to $74,999, and 70% of users earning over $75,000.
- Regarding educational background, college graduates represent the highest percentage of Facebook users at 73%, followed closely by individuals with some college experience at 71%, and high school graduates or those with lower education levels at 64%.
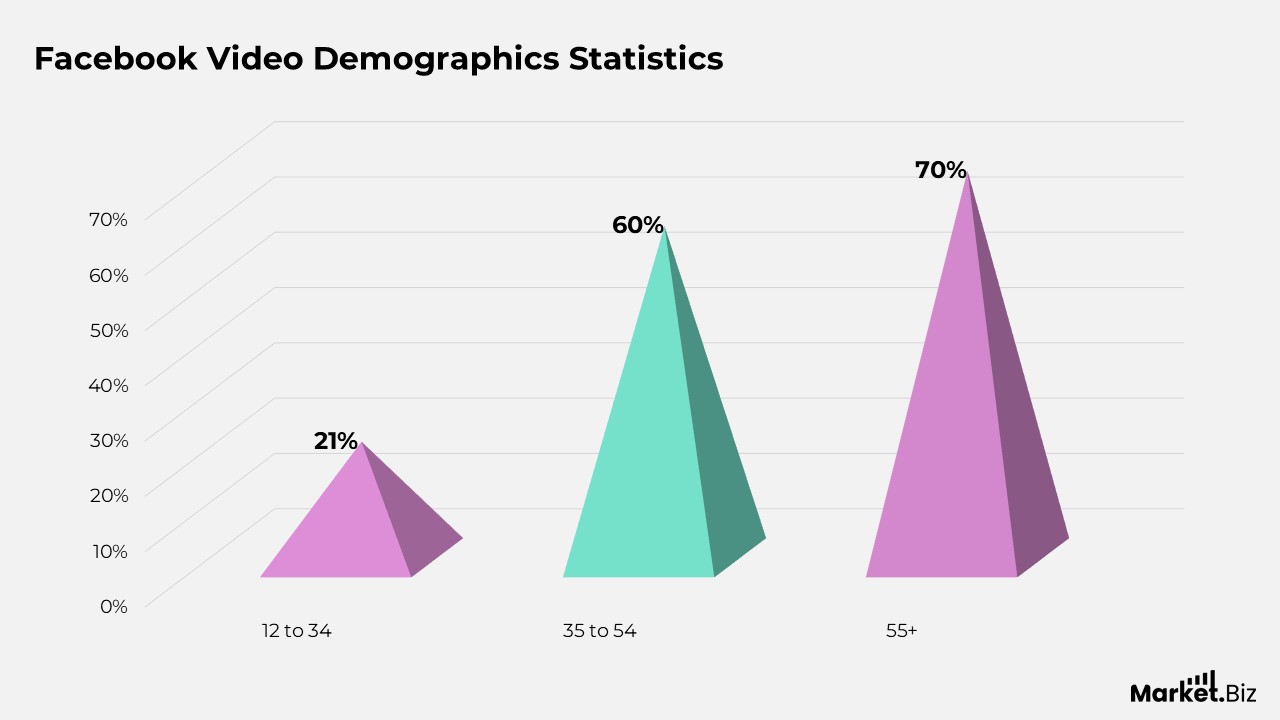
- Moreover, 47% of social media users prefer Facebook over other applications. Among these users, 70% are aged 55 and older, 60% fall within the 35-54 age range, and 21% are aged 12 to 34.
- Currently, India holds the title for the highest number of Facebook users, totalling 378 million, followed by the United States with 190 million, Indonesia with 140 million, Brazil with 130 million, and Mexico with 93 million.
- In March 2021, 75.83% of social media users accessed Facebook via their mobile devices.
Facebook Video Metrics Statistics
- The best time for posting Facebook videos in 2022 was between 12 and 1 PM.
- Mornings, specifically from 9 to 11 AM, were also effective for sharing Facebook videos.
- Videos on Facebook Marketplace had a maximum length of 240 minutes, whereas in-stream videos were limited to a duration of 5 to 120 seconds.
- In 2021, pre-recorded Facebook videos experienced lower engagement levels compared to live videos.
- For audiences ranging from 0 to 5,000, Facebook videos achieved an engagement rate of 1.11%, while live videos had a significantly higher engagement rate of 2.44%.
- A study conducted in 2021 revealed that Facebook videos featuring captions of 10 to 20 words had an engagement rate of 0.38%, those with 20 to 30 words had a rate of 0.29%, and videos with captions exceeding 30 words achieved a 0.36% engagement rate.
- For accounts with audiences between 0 and 5,000, Facebook videos ensured a click-through rate (CTR) of 29.66%.
- As per a 2021 survey, the average CTR for Facebook video posts was recorded at 7.97%.
- Nevertheless, Facebook videos lasting between 5 and 10 minutes, viewed by an audience of 0 to 5,000, exhibited the highest engagement rate of 2.93%.
FB Video Marketing Statistics
- Every day, more than 1 billion stories are shared across Meta applications, including WhatsApp, Facebook, and Instagram.
- Facebook’s native videos receive over 530% greater engagement compared to other video formats.
- A significant 85% of viewers consume Facebook videos without sound, underscoring the necessity for compelling visuals and on-screen text to attract attention.
- Videos that cause emotions such as laughter, surprise, or awe result in a 34% increase in brand recall, demonstrating the effectiveness of emotional storytelling.
- Videos that include clear calls to action (CTAs) improve conversion rates by 38%, illustrating the importance of directing viewers towards the intended goal.
- According to 84% of consumers, a brand video has persuaded them to make a purchase, highlighting the strong impact of video in driving sales.
- Facebook video contributes to over 17% of total traffic volume, reinforcing the significance of video content on the platform.
Facebook Business by Video Statistics
- Video content has transformed, becoming a significant contributor to the Facebook user interface, with nearly 40% of all time spent on the platform dedicated to watching videos. This growing preference highlights the immense power that videos hold for both users and marketers.
- Reels, in particular, are experiencing substantial engagement, with 3.5 billion Reels being re-shared daily across Facebook and Instagram.
- The rapid growth indicates that businesses not using Reels may be missing out on a significant opportunity. Currently, videos represent 17.4% of all posts on Facebook and have the second-highest engagement rate, surpassed only by Reels.
- Approximately 50% of the time users allocate to video content confirms that Facebook has evolved into a video-first platform.
- From an advertising standpoint, over 2 billion individuals view Facebook video advertisements each month, establishing video as one of the most far-reaching formats available.
- Reels rank highly in terms of engagement, achieving a 0.23% engagement rate, which exceeds the engagement rates of standard video posts (0.17%), photo posts (0.08%), and text-only posts (0.07%).
Moreover
- Facebook has modified its algorithm to prioritize Reels over other formats. Therefore, it is a wise decision for any brand aiming to improve interaction and reach. The most effective videos on this platform are vertical videos accompanied by audio.
- Vertical video advertisements with sound yield a 12% higher conversion rate compared to any other ad format.
- While Facebook videos may not achieve engagement levels as high as those on TikTok, they still provide an average engagement rate of 0.06%.
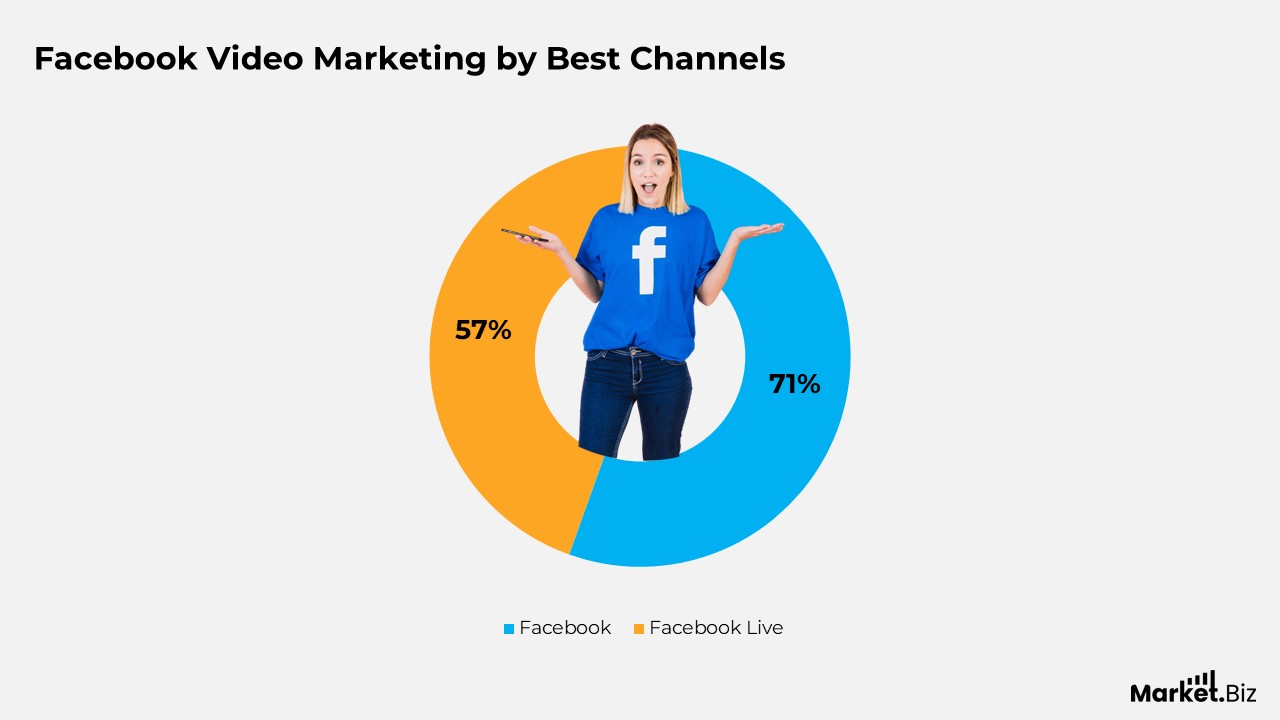
- Many marketers recognize this potential; 71% believe that Facebook remains one of the most powerful platforms for video marketing.
- Facebook Stories continues to hold a significant position within the platform’s ecosystem.
- Every day, 500 million users engage with Facebook Stories, and a billion Stories are shared across Meta’s suite of applications daily.
- This aspect has caught the attention of the advertising community; currently, over 4 million brands are using Stories for advertising.
- Investing in video on Facebook is particularly attractive from a business standpoint.
FB Video vs Other Videos Statistics
- However, regarding total engagements, videos, totalling 3.65 billion, fall short of links, which have 5.17 billion, and photos, which account for 5.11 billion.
- The most common activity on Facebook is viewing photos, comprising 65% of user interactions, followed by posting or sharing content at 57% and watching videos at 46%.
- In terms of the types of content shared, links dominate, constituting 47.2% of all Facebook posts, followed by photos at 35.6%, videos at 15.1%, and status messages at 2.1%.
- On the other hand, status messages show the highest average engagement rate per post at 0.19%, with photos at 0.18%, videos at 0.13%, and links at 0.05%.
- Furthermore, while Facebook may be the most used social media platform among adults at 69% as of February 2021, it ranks second to YouTube, which has a usage rate of 81% when considering video streaming platforms.
Facebook Video Types Statistics
- The likelihood of viewing a live stream is four times greater. Engagement with live stream videos on Facebook is 26% higher than on other platforms.
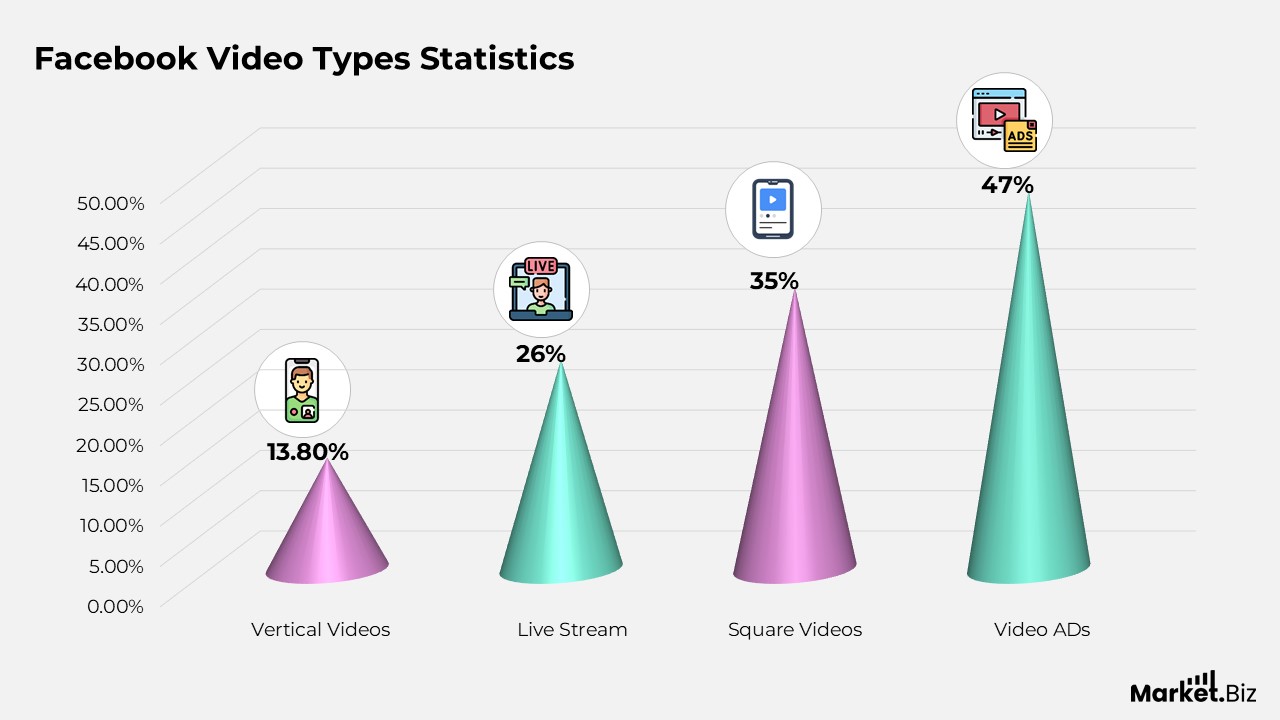
- Users also prefer square videos, which are viewed 35% more often than landscape videos.
- However, vertical videos enjoy 6 to 9 times more engagement than square videos, and they also achieve 13.8% greater visibility.
- Video advertisements lasting over 15 seconds tend to have a higher abandonment rate. The first three seconds of a Facebook video ad account for 47% of the total campaign value.
- Consequently, 65% of users who view the first three seconds of a video are likely to continue watching it for up to 10 seconds.
- Improve viewing time by 12% by incorporating captions.
- Boost brand awareness by 67% through mobile video advertisements.
- Facebook video posts show an average engagement rate of 6.01%.
Video Users’ Behaviour Statistics
- Facebook Video Statistics indicate that daily, individuals view more than 4 billion videos on Facebook.
- More than half of American adults use Facebook videos to stay updated with the latest news.
- In 2024, it is projected that about 47% of individuals will watch video advertisements on Facebook, with 74% of users having an above-average income.
- A significant 80% of Facebook users consider auto-playing video ads in their news feed to be bothersome and intrusive.
- 62% of respondents reported an increased interest in products after encountering them on Facebook Stories.
- Users intentionally watching Facebook videos engage with them five times longer than those who stumble upon them, and they also spend more time on video posts.
- Young users, specifically those aged 18 to 24, dedicate 75% of their time on Facebook to viewing video advertisements.
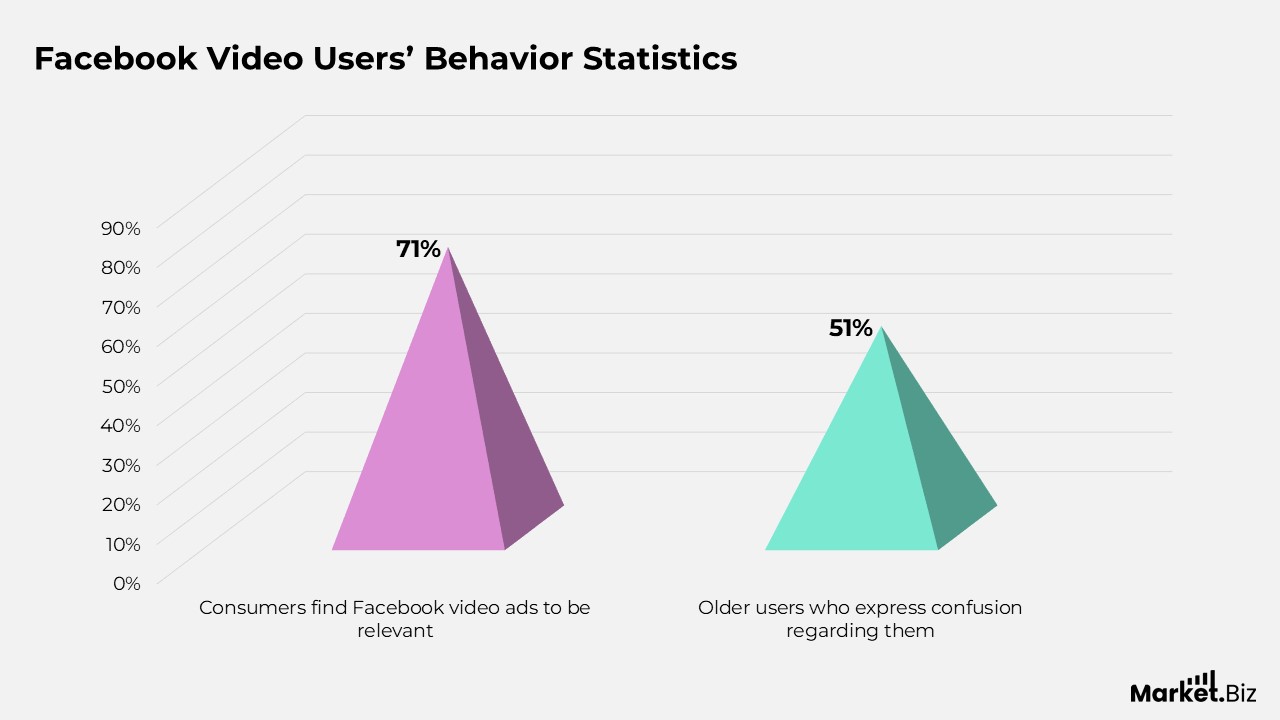
- Additionally, around 71% of consumers find Facebook video ads to be relevant, although 51% of older users express confusion regarding them.
Video AD Statistics
- In 2024, the typical cost per click for Facebook video advertisements is approximately USD 1.86.
- On average, Facebook video advertisements achieve a click-through rate of 1.84%.
- In contrast, advertisements on Facebook Stories are 63% less expensive than those on Instagram Stories.
- Additionally, the average cost to view a Facebook video advertisement varies between USD 0.01 and USD 0.15.
- According to Facebook Video Statistics, the cost for 1,000 impressions of Facebook video advertisements is USD 7.19.
- As of 2024, the frequency of Facebook video advertisements is 3.24 times. Their click-to-play rate is approximately 1.2%.
FB Video Consumption Statistics
- 85% of Facebook videos are watched on mute. Highlights the unexpected statistic regarding soundless video viewing.
- A billion users strong. Highlights the extensive user base of Facebook Watch.
- Users are four times more likely to engage with live videos. Stresses the improved interaction with live content.
- 500 million daily active users on Facebook Stories. Showcases the popularity of Stories.
- 80% of stories featuring voice-over yield improved results. Highlights the impact of audio in Stories.
- 62% increase in product interest following video viewing. Links video consumption to heightened interest in products.
Facebook Videos Performance Statistics
- Facebook video posts typically achieve an average engagement rate of 6.01%.
- Videos that include numbers in their titles tend to garner more views.
- Facebook videos that feature captions also perform effectively, and they can improve viewing time by 12%.
- Mobile-optimized Facebook videos can uplift brand awareness by as much as 67%.
- The expense associated with a Facebook video advertisement is merely 10% of the cost of a carousel or single image advertisement.
- Television advertising expenses are 20 times greater than those of Facebook ads. Furthermore, Facebook reaches an audience that is double that of a television advertisement.
- A call to action positioned in the middle of the video achieves the highest conversion rate at 16.95%.
FB AI Video Statistics
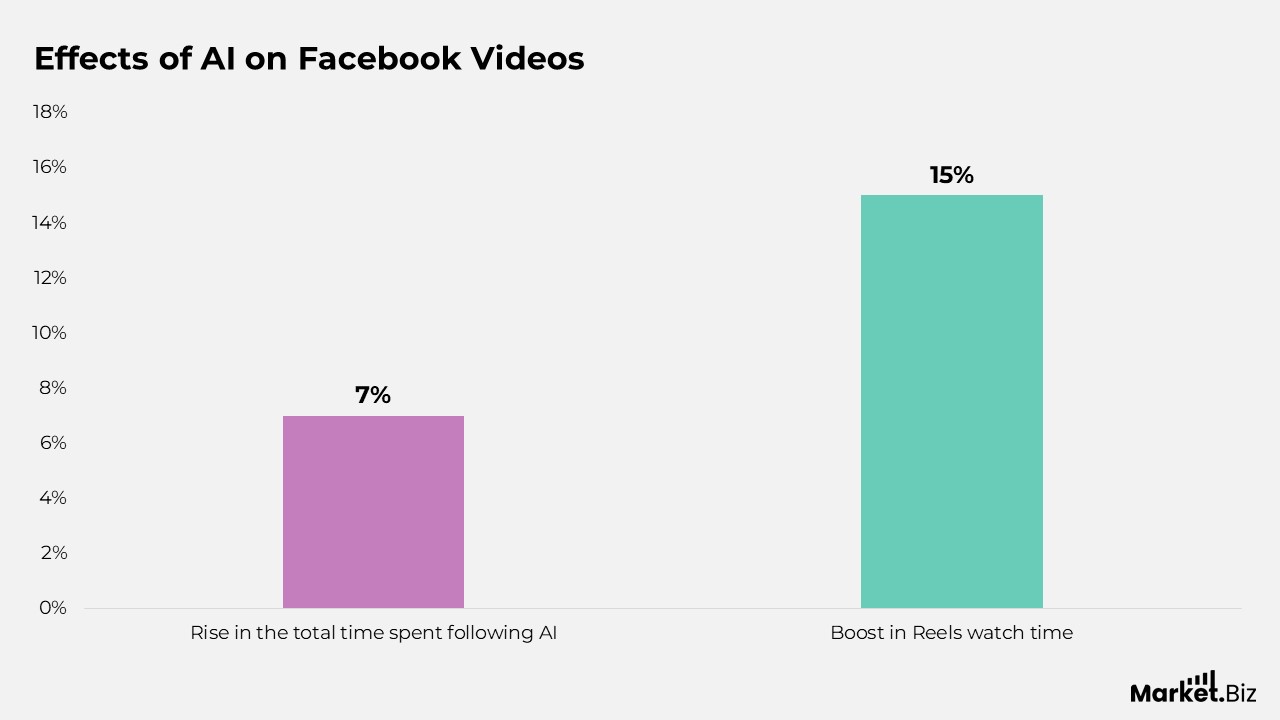
- Meta has experienced a 7% rise in the total time users spend on Facebook, attributed to AI recommendations.
- AI-driven automated bidding techniques such as Target CPA and Target ROAS are increasingly popular, with 84% of Facebook advertisers employing them to improve campaign effectiveness.
- The introduction of Facebook’s new AI recommendations model resulted in a 15% boost in Reels watch time, highlighting AI’s capability to customize content suggestions for better user interaction.
- In the first half of 2022, Facebook used AI to automatically identify and eliminate 5,057,300 pieces of content. This illustrates the extensive role of AI in content moderation and in ensuring a secure platform environment.
Conclusion
Facebook videos serve as an exceptional means to captivate audiences; however, the specific type of video is important. Live videos tend to produce superior performance, showing higher engagement rates in comparison to standard video posts. These live videos draw increased attention due to their closeness and interactive connecting features.
Although standard video posts retain their value, they may cause a different degree of user interaction. Highlighting live videos can assist businesses and creators in increasing their reach and engagement. Selecting the appropriate format is important for improving results on Facebook.
FAQs
The video that holds the record for the most views on Facebook is a Facebook Live broadcast featuring Candace Payne. Popularly known as “Chewbacca Mom.” In this video, she is seen wearing a Chewbacca mask and laughing uncontrollably, achieving over 159 million views, as reported by Guinness World Records. This video was uploaded in May 2016 and quickly became a viral phenomenon.
Facebook determines a video view when a user watches the video for a minimum of three seconds, regardless of whether the video is played automatically or started manually. Views from the same user are counted multiple times as long as each viewing lasts at least three seconds. Additionally, Facebook provides more detailed analytics, including total minutes viewed and views lasting at least ten seconds.
The record for the most viewed Facebook Reel is held by a video of Muhammad Rizwan executing a football kick behind the Keralamkundu Waterfall, amassing over 554 million views. This reel, which went viral in January 2025, highlights Rizwan’s exceptional football skills and accuracy. Furthermore, this video has also secured him a Guinness World Record.