Introduction
Smart devices statistics offer a structured, quantitative overview of how connected technologies are spreading and evolving across consumer, commercial, and industrial settings. These metrics capture essential indicators such as adoption rates, usage patterns, connectivity levels, and ecosystem expansion, enabling a clear assessment of market scale and technological maturity.
By examining data from smartphones, wearables, smart home solutions, and IoT-enabled devices, these statistics reveal changing user behaviour, increasing interoperability, and the growing role of digital infrastructure. Collectively, smart device statistics provide a reliable basis for evaluating market trends, measuring the impact of innovation, and guiding strategic decisions in a highly connected digital environment.
Editor’s Choice
- Smart device satisfaction is highest for practical, everyday solutions, with connected lights leading at 85%, followed by activity trackers at 81% and smartwatches at 79.9%. Indicating strong consumer preference for utility-driven devices.
- Household adoption of smart security solutions has accelerated rapidly. Rising from 17% in 2022 to 30% in early 2024, nearly doubling in just two years as safety concerns gain prominence.
- Despite increasing adoption, cybersecurity risk scales with device volume: 29% of households with 30+ connected devices experienced multiple data breaches in the past 12 months, compared to just 11% in homes with 1–15 devices.
- Consumer value perception remains positive overall, with 77% of smart device owners reporting improved quality of life. Even though 41% express frustration with device management, updates, and the complexity of security.
- Convenience and control are the primary adoption drivers, as improved safety and security influence 43% of users. While remote monitoring (36%) and time savings (34%) outweigh cost savings (11%) as key motivators.
- Smart ecosystems appear to be maturing rather than expanding endlessly, with the average number of connected devices per U.S. household declining from 25 in 2021 to 21 in 2023, reflecting consolidation and selective usage.
- Europe shows strong but uneven smart device adoption: 70.9% of EU residents used connected devices in 2024, led by the Netherlands (94.8%) and lagging in Poland (46.1%), highlighting regional digital gaps.
- Purchase intent remains robust: 40% of consumers are already invested in home automation, and another 40% plan future purchases, leaving only 20% resistant to adoption.
- Brand recognition in smart home devices is highly concentrated, with Nest (37.5%) and Amazon (36.46%) dominating awareness. While most other brands remain below 10%, underscoring the power of ecosystem-driven branding.
(Source: Infinum)
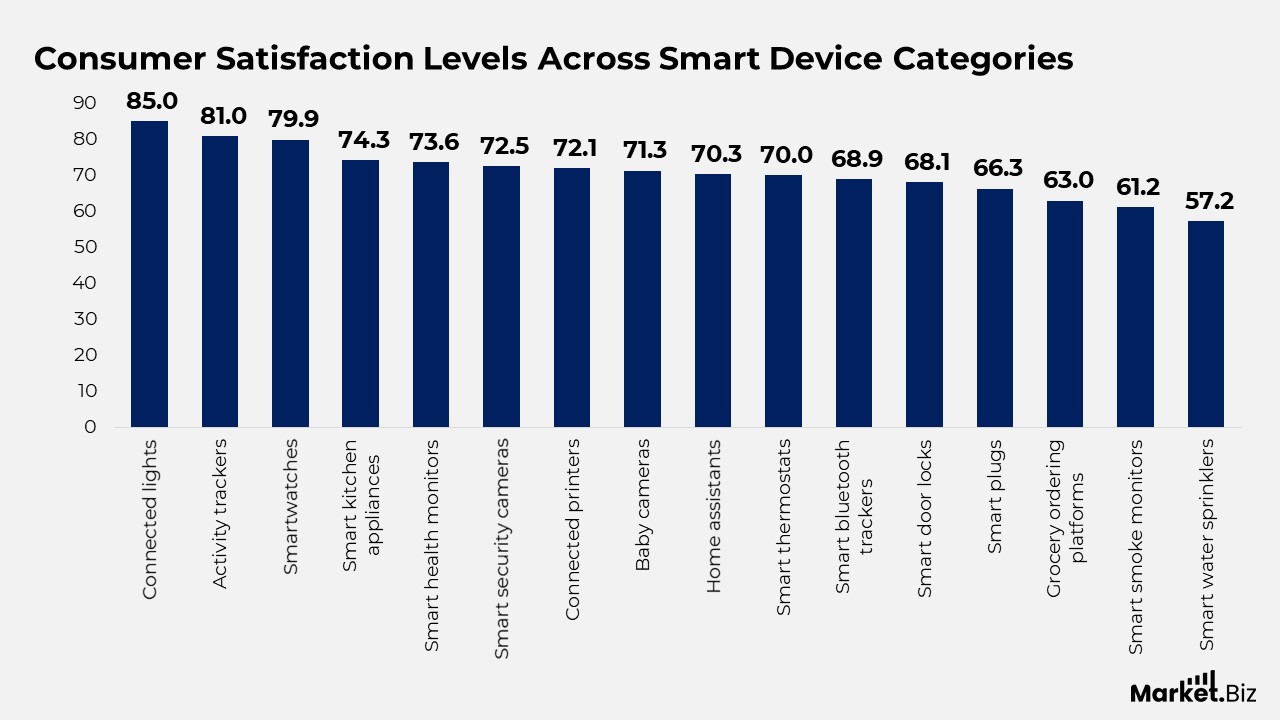
Consumer Satisfaction Levels Across Smart Device Categories
- Connected lights record the highest satisfaction level at 85%, indicating strong consumer approval for smart lighting solutions.
- Activity trackers follow closely, with 81% of users reporting positive satisfaction, driven by health and fitness monitoring benefits.
- Smartwatches achieve a satisfaction rate of 79.9%. Reflecting their versatility in daily use and health tracking.
- Smart kitchen appliances report 74.3% satisfaction. Showing growing acceptance of connected cooking and home management devices.
- Smart health monitors reach 73.6% satisfaction. Supported by rising demand for personal health data and remote monitoring.
- Smart security cameras register 72.5% satisfaction. Highlighting trust in connected home security technologies.
- Connected printers maintain a 72.1% satisfaction rate, emphasizing their continued relevance in home and office environments.
- Baby cameras achieve 71.3% satisfaction, reflecting steady adoption among households with young children.
- Home assistants achieve 70.3% satisfaction, supported by voice control and smart home integration features.
- Smart thermostats report 70% satisfaction, driven by energy-efficiency and automated climate-control benefits.
- Smart Bluetooth trackers achieve 68.9% satisfaction, indicating moderate but consistent consumer acceptance.
- Smart door locks reach 68.1% satisfaction, reflecting cautious but growing trust in connected access control.
- Smart plugs show a satisfaction rate of 66.3%, supported by basic automation and energy management use cases.
- Grocery ordering platforms record 63% satisfaction, suggesting room for improvement in user experience and reliability.
- Smart smoke monitors achieve 61.2% satisfaction, indicating selective adoption within home safety categories.
- Smart water sprinklers report the lowest satisfaction at 57.2%, highlighting challenges in perceived value and usability.
(Source: Infinum, Statista)
Adoption Trends of Smart Devices and Connected Solutions in Households
- The adoption of smart home security tools such as connected alarms, cameras, and video doorbells has nearly doubled since 2022, with 30% of people using these solutions in the first half of 2024, compared with 17% previously.
- Smart energy management technologies, including thermostats, smart meters, and lighting controls, are used by 28% of households, up 6 percentage points from the same period in 2022.
- Around 15% of users now rely on smart home appliances both indoors and outdoors, such as robot vacuum cleaners, connected kitchen equipment, lawn mowers, and irrigation systems, up from just 6% in 2022.
- Usage of virtual assistants such as Google Home, Alexa, and Apple HomePod remains stable, with 41% of internet users continuing to rely on voice-enabled smart assistants.
- Internet-connected television adoption remains high, with 76% of users accessing smart TVs or streaming devices like Chromecast, up from 70% in 2022.
- 37% of users use internet-connected gaming consoles, while an equal share uses smart home audio systems or connected speakers.
- Wearable smart devices, including smartwatches and fitness trackers, are worn by 54% of users. In comparison, 11% use smart monitoring solutions to track health indicators such as blood pressure, glucose levels, or body weight.
(Source: Infinum, Statista)
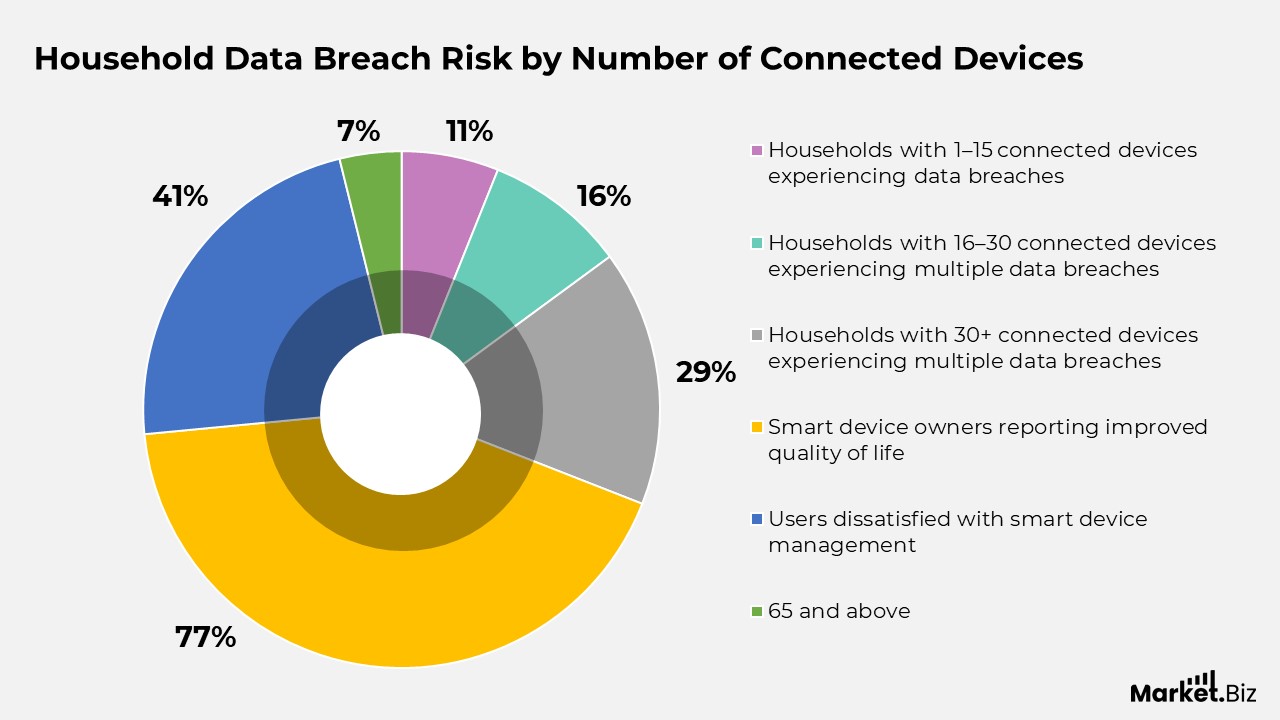
Household Data Breach Risk by Number of Connected Devices
- Households with 1–15 connected devices reported data breaches at a rate of 11%, indicating lower exposure to cybersecurity incidents.
- For homes with 16–30 smart or connected devices, the share experiencing at least two data breaches increased to 16%, reflecting rising risk with device volume.
- Households with 30+ connected devices were the most vulnerable, with 29% reporting 2 or more data breaches over the past 12 months.
- Despite growing security concerns, 77% of smart home device owners stated that connected technologies positively improved their quality of life.
- However, 41% of users expressed dissatisfaction with smart device management, citing challenges related to troubleshooting, software updates, and security compliance.
(Source: Deloitte Insights, Consumer Affairs)
Consumer Benefits Driving Smart Device Adoption
- Improved safety and security are the primary benefits of smart devices, cited by 43% of users, underscoring strong demand for connected protection solutions.
- In-home remote monitoring and control are valued by 36% of consumers, reflecting the convenience of managing homes from anywhere.
- Time savings represent a major advantage, with 34% of users reporting improved efficiency through automation and connected features.
- Enhanced comfort is recognized by 30% of users, driven by personalized and automated living environments.
- 16% of consumers report reduced energy usage, indicating moderate but growing awareness of efficiency benefits.
- Cost savings motivate 11% of users, suggesting financial benefits are secondary to convenience and security.
- Home upgrades and the perceived “cool factor” appeal to 8% of users, reflecting lifestyle-driven adoption rather than functional necessity.
(Source: Deloitte Insights, Consumer Affairs)
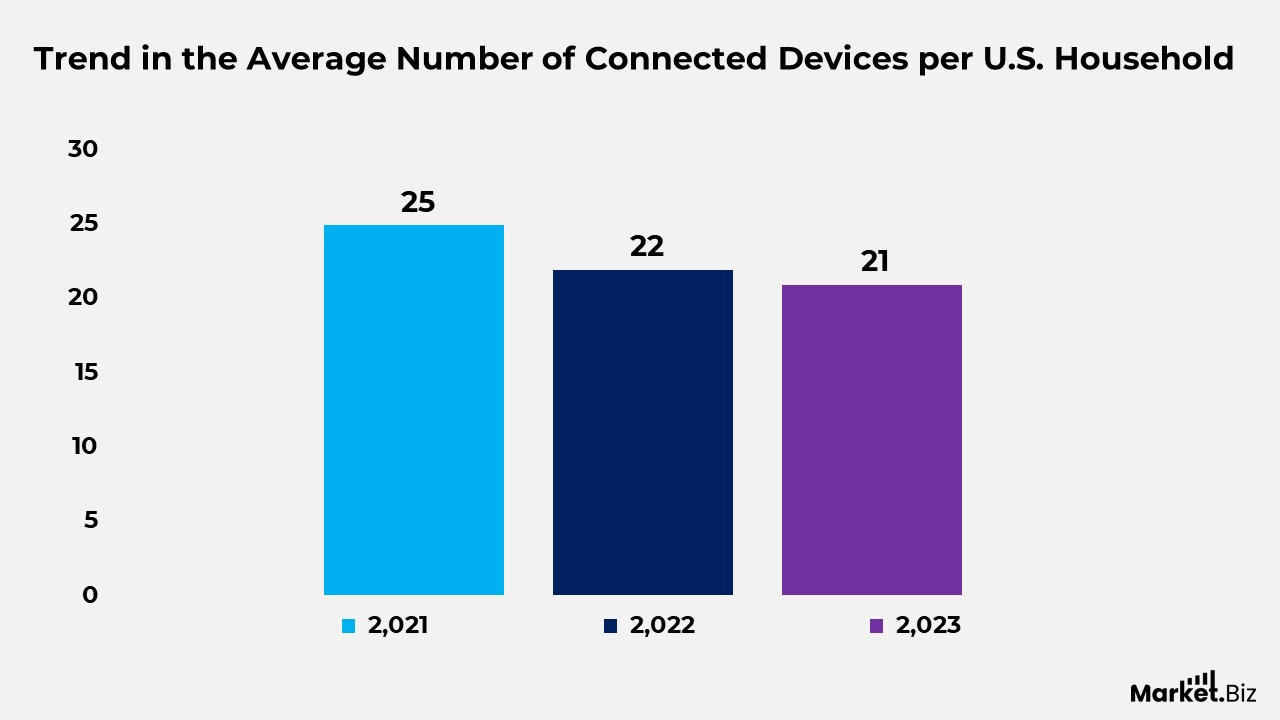
Trend in the Average Number of Connected Devices per U.S. Household
- In 2021, U.S. households owned an average of 25 connected devices. Reflecting the rapid adoption of smart home and digital technologies.
- The average number of connected devices per household declined to 22 in 2022. Indicating a period of consolidation and more selective device use.
- By 2023, the average further decreased to 21 connected devices, suggesting increased focus on device optimization, security concerns, and streamlined smart home ecosystems.
(Source: Deloitte Insights, Consumer Affairs)
Adoption and Ownership Levels of Smart Connected Devices
- A large majority of respondents (87.3%) report using smart connected devices, indicating widespread exposure and familiarity with connected technologies.
- Ownership levels are also high, with 75.9% of respondents stating that they own at least one smart connected device, reflecting strong household penetration.
(Source: Deloitte Insights, Consumer Affairs)
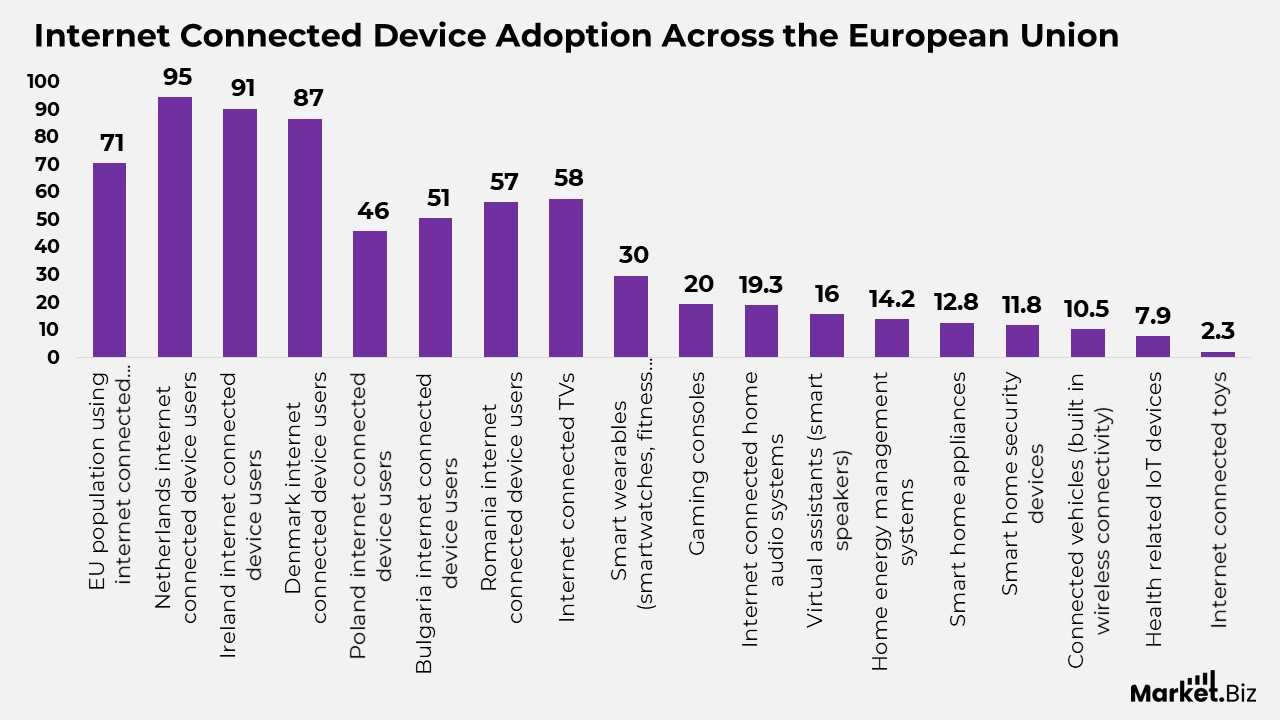
Internet Connected Device Adoption Across the European Union
- In 2024, 70.9% of people across the European Union reported using internet-connected devices, commonly referred to as smart devices or Internet of Things technologies.
- The Netherlands recorded the highest adoption rate, with 94.8% of individuals using internet-connected devices, followed by Ireland at 90.6% and Denmark at 87.0%.
- In contrast, usage levels were significantly lower in several EU countries. Including Poland at 46.1%, Bulgaria at 50.8%, and Romania at 56.6%.
- Among all categories, internet-connected televisions emerged as the most widely used smart device, with 57.9% of individuals reporting use in 2024.
- Smart wearables, such as smartwatches and fitness trackers, ranked second, with 29.9% of the population using them.
- Gaming consoles and internet-connected home audio systems showed similar adoption levels, used by 19.5% and 19.3% of individuals, respectively.
- Virtual assistants in the form of smart speakers were used by 16.0% of people, reflecting moderate uptake of voice-enabled technologies.
- Home automation solutions remained less common, with 14.2% using connected energy management systems, 12.8% using smart home appliances, and 11.8% relying on smart home security devices.
- Connected vehicles with built-in wireless connectivity were used by 10.5% of individuals, while health-related IoT devices were reported by 7.9%.
- Internet-connected toys represented the smallest segment, with only 2.3% of people reporting use, indicating limited penetration.
(Source: Eurostat)
Consumer Intent and Investment Patterns in Home Automation Products
- A significant share of consumers, accounting for 40%, are already invested in smart home and home automation products, indicating established market adoption.
- 40% of individuals report plans to purchase home automation solutions in the future, reflecting strong near-term demand potential.
- A smaller segment, representing 20% of consumers, states that they do not intend to buy home automation products. Highlighting ongoing resistance or a perceived lack of need.
(Source: GoodFirms)
Home Automation Device Features Consumers Are Most Interested In
- Nearly half of consumers (47.5%) show the strongest interest in smart devices that can be centrally controlled and adapt based on user behaviour.
- Connected devices that allow remote control attract 35.83% of consumers, highlighting demand for off-site access and convenience.
- Automated devices designed to perform predefined actions appeal to 16.67% of users, indicating a comparatively lower preference for rule-based automation over intelligent systems.
(Source: GoodFirms, Statista)
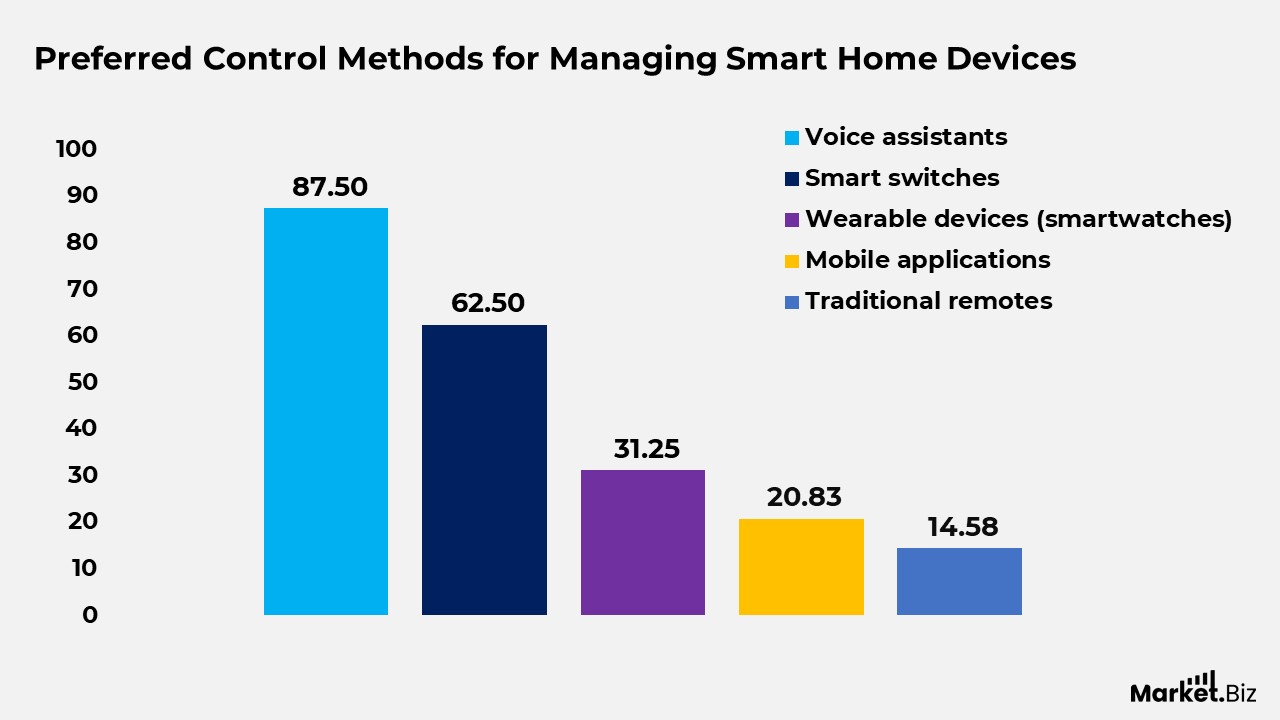
Preferred Control Methods for Managing Smart Home Devices
- Voice assistants are the most widely used control system, with 87.5% of smart home device owners relying on voice-based commands for daily operation.
- Smart switches are the second most common control method, used by 62.5% of respondents, reflecting continued demand for physical yet connected controls.
- Wearable devices, such as smartwatches, are used by 31.25% of users to manage smart home functions, indicating moderate adoption of on-body control interfaces.
- Mobile applications serve as a control option for 20.83% of users, highlighting selective reliance on smartphone-based management.
- Traditional remotes are the least preferred control system, used by only 14.58% of respondents, suggesting declining relevance in modern smart home ecosystems.
(Source: GoodFirms, Statista)
Primary Use Cases of Smart Devices Among Consumers
- Personal assistance functions rank as the leading use case, with 70.83% of users relying on smart home devices for everyday support and task management.
- Entertainment-related applications follow closely, used by 64.58% of consumers for media streaming and content control.
- Home security represents a major application area, with 56.25% of users adopting smart devices for monitoring and protection.
- Household management tasks, such as scheduling and routine coordination, are supported by smart devices for 39.58% of users.
- Energy efficiency use cases account for 35.42% of adoption, reflecting growing interest in energy monitoring and optimization.
- Home décor and comfort-related applications are used by 33.33% of consumers, driven by ambient lighting and climate control features.
- Healthcare and wellness applications remain a niche segment, with only 12.5% of users leveraging smart devices for health-related purposes.
(Source: GoodFirms, Statista)
Consumer Purchase Intent Across Smart Home Device Categories
- For home décor and comfort solutions, 26.04% of consumers plan to buy within the next 12 months, 39.58% may consider purchasing after 12 months, while 34.38% do not intend to buy more.
- Household management devices show strong near-term demand: 45.83% plan to purchase within 12 months, 37.50% are considering a later purchase, and only 16.67% express no further buying interest.
- Home security products attract high purchase intent, as 43.75% of consumers plan to buy within 12 months, 31.25% may buy later, and 25.00% do not plan additional purchases.
- Energy efficiency solutions show balanced interest: 42.71% plan to buy within 12 months, 33.33% are considering a delayed purchase, and 23.96% are not planning further investment.
- Personal assistance devices reflect moderate demand, where 32.29% plan to purchase within 12 months, 35.42% may buy later, and 32.29% do not intend to purchase more.
- Healthcare and wellness devices show mixed intent: 33.33% plan near-term purchases, 44.79% consider purchases after 12 months, and 21.88% do not plan additional purchases.
- Entertainment-related smart devices maintain steady demand, with 37.50% planning to buy within 12 months, 34.38% planning to purchase later, and 28.13% not intending to expand their device usage further.
(Source: GoodFirms, Statista)
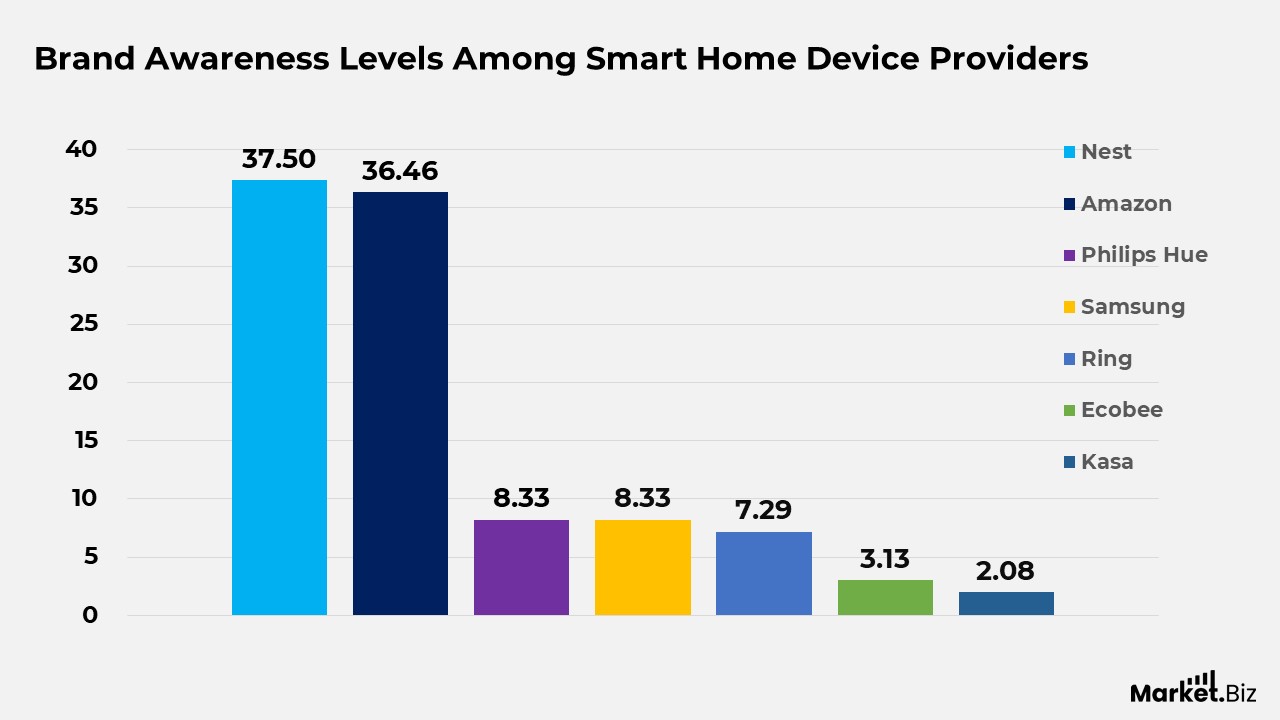
Brand Awareness Levels Among Smart Home Device Providers
- Nest ranks as the most recognized smart home brand, with 37.5% of respondents identifying it as a familiar provider.
- Amazon follows closely, cited by 36.46% of consumers, reflecting strong brand visibility through its smart home and voice assistant ecosystem.
- Further, Philips Hue records moderate recognition, with 8.33% of respondents associating the brand with smart home devices.
- Samsung also holds a recognition level of 8.33%, supported by its broad consumer electronics presence.
- Moreover, Ring is recognized by 7.29% of users, largely driven by its focus on smart security solutions.
- Ecobee shows lower brand awareness, with 3.13% of respondents identifying the brand.
- Kasa registers the lowest recognition level among listed brands, with 2.08% of consumers citing it, indicating limited market visibility.
(Source: GoodFirms, Statista)
Conclusion
Smart device statistics highlight the growing role of connected technologies in daily routines and reflect changing consumer behaviour and priorities.
Adoption and satisfaction data show a strong preference for solutions that deliver clear functional value, including wearables, smart security, lighting, and connected entertainment, alongside more cautious adoption of advanced or specialised devices.
At the same time, patterns of device rationalization, rising awareness of security risks, and usability concerns suggest consumers are moving toward more intentional and streamlined smart ecosystems.
Overall, these statistics point to a maturing smart device landscape in which efficiency, reliability, and trust are increasingly central to long-term adoption and sustained use.
FAQ’s
Smart device statistics consist of structured numerical data used to evaluate the adoption, utilisation, performance outcomes, and overall impact of connected technologies. This includes smart home solutions, wearables, connected appliances, and IoT-based systems, helping illustrate how these technologies are embedded in everyday activities and digital networks.
These statistics are important because they offer data-driven insight into consumer usage patterns, levels of technology penetration, and market development stages. They inform strategic decision-making, policy development, and innovation planning by identifying growth trends, user preferences, and areas of limited adoption.
Smart device statistics typically encompass a broad range of connected products, including smart home equipment, wearable devices, connected entertainment systems, virtual assistants, health monitoring tools, and other IoT-enabled technologies used in household or personal contexts.
Smart devices statistics capture key behavioral indicators such as ownership rates, usage frequency, satisfaction levels, and future purchase intentions. Analytically, these metrics reveal how factors such as ease of use, perceived security, comfort, and efficiency shape consumer adoption choices.
Geographic insights within smart devices statistics reveal how adoption varies across regions and countries. The availability of digital infrastructure, economic conditions, regulatory frameworks, and cultural acceptance of connected technologies shapes these differences.