Introduction
Smart Home Statistics: The smart home sector has experienced significant growth, revolutionizing the way individuals interact with their homes. Fueled by the increasing demand for convenience, energy savings, and enhanced security, smart home technologies are gaining widespread adoption.
Products like smart thermostats, lighting controls, security cameras, and voice-activated assistants have become integral to modern households. The convergence of the Internet of Things (IoT), artificial intelligence (AI), and 5G connectivity is driving the rapid integration of these intelligent solutions.
As consumers seek greater automation and better living environments, the popularity of smart home devices continues to rise, transforming daily life and residential settings.
Editor’s Choice
- In 2023, 78% of potential home buyers expressed a willingness to pay a premium for a smart home.
- Consumer spending on smart home devices reached US$127 billion in 2022.
- Around 75% of smart home consumers are under the age of 55.
- Nearly two-thirds of smart home consumers have concerns regarding their data security.
- 97% of smart home device owners report being at least somewhat satisfied with their devices.
- In the U.S., smart homes average 8 smart devices per household.
- The estimated revenue from the U.S. smart home market in 2022 was US$31.45 billion.
- Globally, there were 259.89 million smart households in 2021.
- The U.S. had 52.22 million smart homes in 2021.
- As of Q3 2022, 16.4% of people worldwide owned a smart home device.
- Smart appliances led the market with a valuation of US$44.25 billion in 2022.
- In the first half of 2022, the average home had 17.1 connected smart devices.
- A total of 895 million smart home devices were shipped worldwide in 2021.
- Young millennials aged 25-34 were the most likely demographic to own a smart home device.
General Smart Home Statistics
- Men are more likely to use smart home devices to lower utility bills, with 17% of men compared to 13% of women.
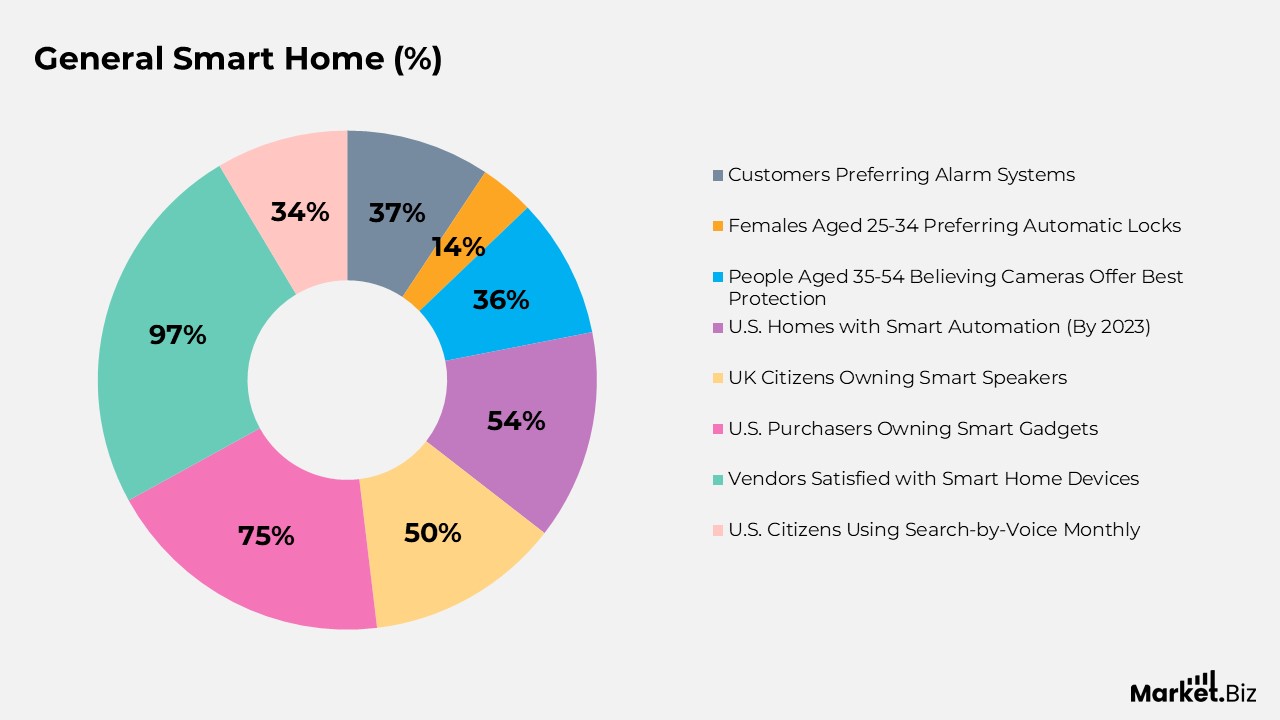
- 37% of customers reflect fire and theft alarm systems as the most important protective devices for their homes.
- Women are more inclined to use smart home devices for security, with 19% of women versus 13% of men using them for this purpose.
- 14% of females aged 25-34 consider automatic locks to be the maximum protective smart home devices.
- 36% of individuals aged 35-54, regardless of gender, believe cameras offer the highest level of protection for their homes.
- By 2023, 53.9% of U.S. homes had implemented smart home automation.
- 50% of UK citizens now own a smart speaker.
- Approximately 32% of U.S. households, or about 39 million homes, have an alarm system.
- 75% of U.S. purchasers already own smart gadgets.
- The UK has over 2.2 million smart homes.
- 97% of smart home device vendors report being at minimum rather satisfied with their devices.
- It is expected that 5.5 million Matter-compliant smart home devices will be shipped by the end of 2030.
- Around 34% of U.S. citizens use a search-by-voice feature at least once a month.
(Source: Market.us, Statista)
Number of Smart Homes Statistics
- There are an estimated 175 million smart homes worldwide.
- 2.56% of U.S. adults report feeling comfortable with smart home technology.
- Converting a home into a smart home costs between US$970 and US$3,310.
- One-quarter of Americans own smart home technology.
- 61% of Americans believe that in about 10 years, smart homes will be as common as smartphones.
- The most common smart home devices include camera systems, appliances, security systems, thermostats, and lighting.
- By 2025, over 37% of new homes are expected to include at least one smart device.
- By 2023, internet infrastructure is projected to support over 3.5 billion active IoT connections.
(Source: Statista, Avast, Forbes, HDL)
Smart Homes Market Size
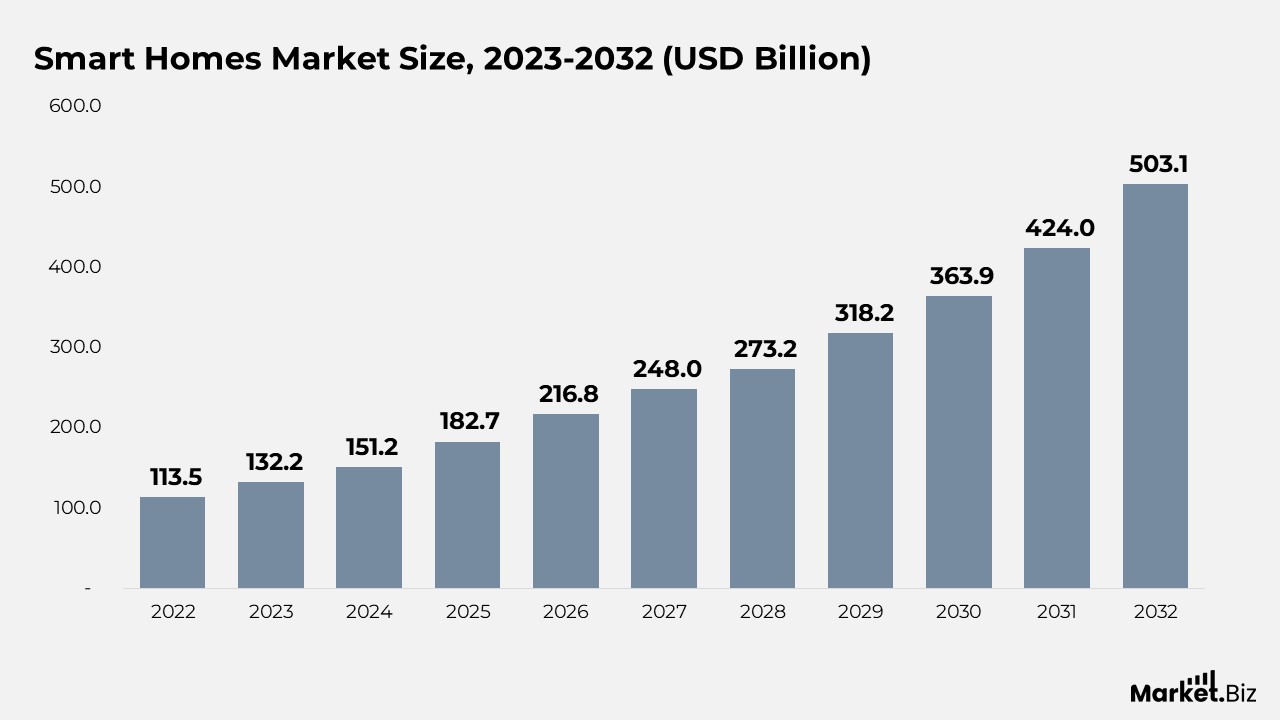
- According to Market.us, the smart homes market is expected to rise from $132.2 billion in 2023 to $503.1 billion by 2032, representing a compound annual growth rate (CAGR) of 16.8% from 2023 to 2032.
- The growth of the smart homes market is fueled by the increasing adoption of IoT technology, rising demand for connected lifestyles, and a focus on energy efficiency and sustainability.
- The new construction segment is projected to experience the highest CAGR from 2023 to 2032, driven by the ease of installing smart home appliances during new construction activities.
- Asia Pacific leads the global smart homes market, accounting for 32.8% of the revenue share, with growth driven by the adoption of smart appliances for energy efficiency.
- 69% of U.S. households currently own at least one smart device, reflecting significant growth in the adoption of smart home technologies.
- Around 12% of U.S. households (approximately 22 million homes) own multiple smart home products, showing a growing trend toward integrated smart technologies.
- Audio-video products have the highest ownership rate among smart home devices, with 56% of households owning them, followed by home networking (34%), home security (33%), energy management (21%), and lighting (15%).
- The most commonly owned smart home products include smart entertainment devices (45% ownership), smart speakers with voice assistants (25%), wireless speakers without voice assistants (26%), smart thermostats (14%), monitored security systems (17%), smart smoke detectors (17%), and video doorbells (12%).
- Global shipments of smart home devices are projected to reach 815 million this year and are expected to increase to 1.4 billion by 2025.
(Source: Market.us)
Smart Home Security Market Size
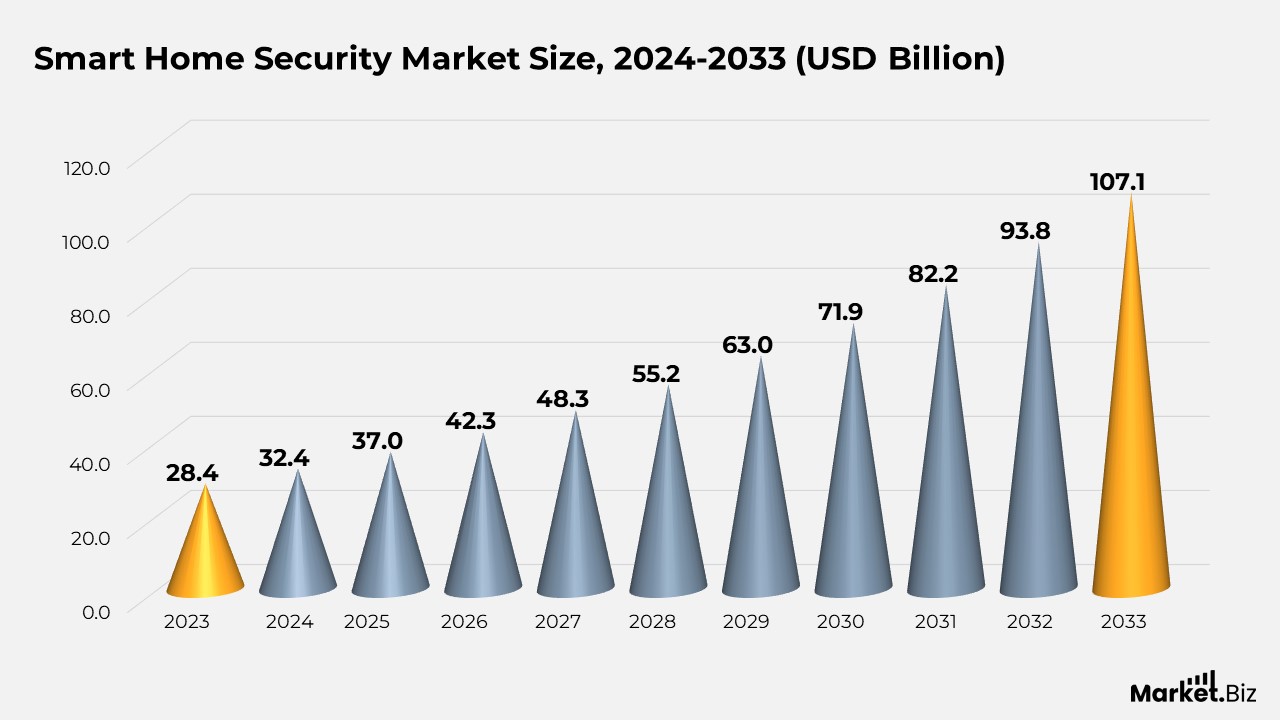
- According to Market.us, the smart home security market is expected to grow from $28.4 billion in 2024 to $107.1 billion by 2033, representing a compound annual growth rate (CAGR) of 14.2% from 2024 to 2033.
- The smart home security market growth is driven by increasing consumer awareness of security, convenience, IoT adoption, and advancements in wireless technology.
- In 2023, the hardware segment dominated the smart home security market, capturing 44.2% of the market share due to its foundational role in home protection systems.
- In 2023, the smart camera and monitoring system segment held 34.5% of the global market share, critical for real-time surveillance, remote access, and intelligent analytics.
- In 2023, the Condominiums/Apartments segment led the market, capturing 57.3% of the share, driven by unique security needs in multi-unit residential buildings.
- In 2023, North America dominated the smart home security market with 42.4% of the share, fueled by high technological adoption and access to advanced infrastructure.
- 69% of U.S. households own at least one smart device, while 12% of those households, or approximately 22 million, have multiple devices.
- 46% of smart device users across all demographics cite convenience as the most significant driver for usage.
- 72% of U.S. households have at least one home security device.
- 51 million U.S. households have installed video surveillance systems, while 39 million have alarm systems.
- The average cost of installing a home security system is US$475.
(Source: Market.us)
Reasons for Using Smart Home Technology
- 46% of users rely on smart home technology for added convenience.
- 17% use it to keep an eye on their home while they are away.
- 15% utilize it to reduce their utility costs.
- 6% use it for various other reasons.
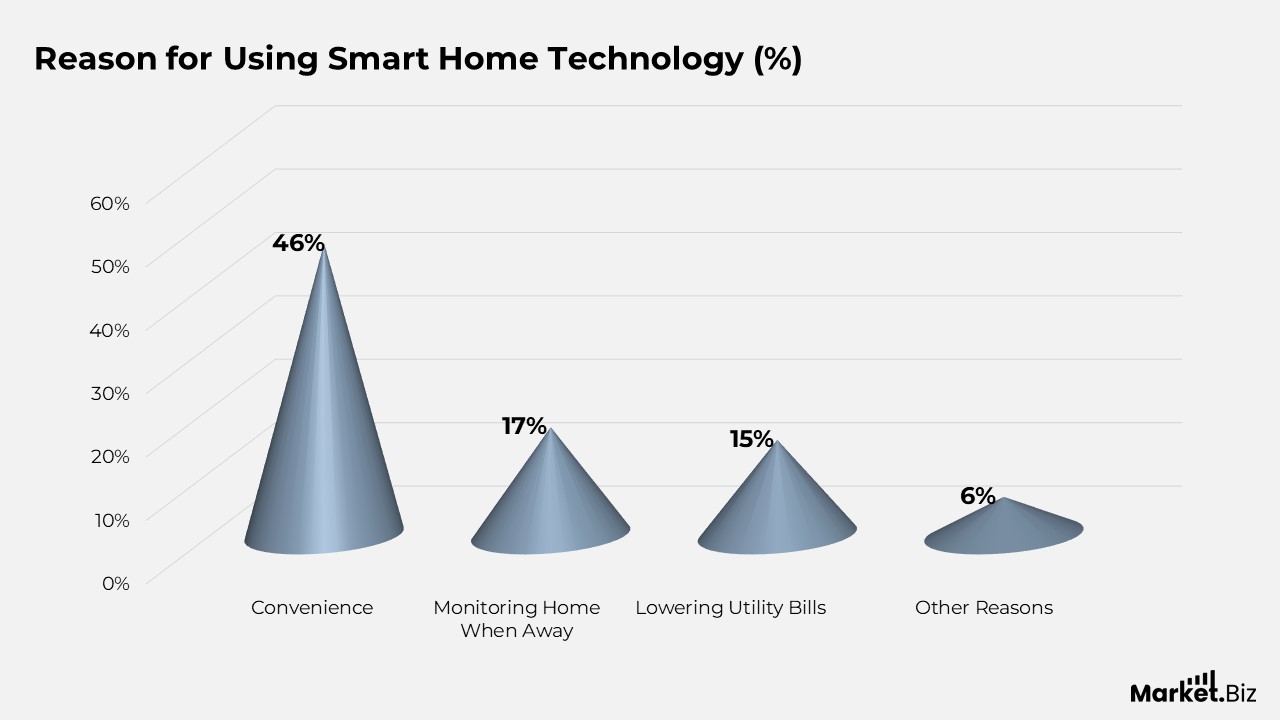
(Source: Statista, Hippo Holdings Inc.)
Consumer Preferences and Smart Home Technology Trends
- 3 out of 4 possible home consumers are willing to pay a premium for a smart home.
- 70% of home buyers are actively seeking smart homes.
- 82% of renters desire at least one smart device or system in their home.
- Among renters, 35% consider having a smart home device important.
The top 3 most popular smart home technologies among renters are:
- Voice control: 50%
- Smart appliances: 41%
- Smart lights: 36%
- 46% of consumers adopt smart home technology primarily for convenience.
- The second most popular reason for using smart home technology is to monitor the house when away (17%).
- 57% of non-adopters of smart homes feel there is no need for them.
(Source: Security.org, Semrush Inc, Rent.com, Hippo, Smart Energy Consumer Collaborative, Exploding Topics)
Smart Home Device Control Systems
- 87.50% of smart home device management is handled through voice assistants.
- 62.50% of individuals use smart switches to control their devices.
- 31.25% rely on wearable devices for managing smart home functions.
- 20.83% utilize mobile apps to control their smart devices.
- 14.58% of users opt for remotes to manage their smart home devices.
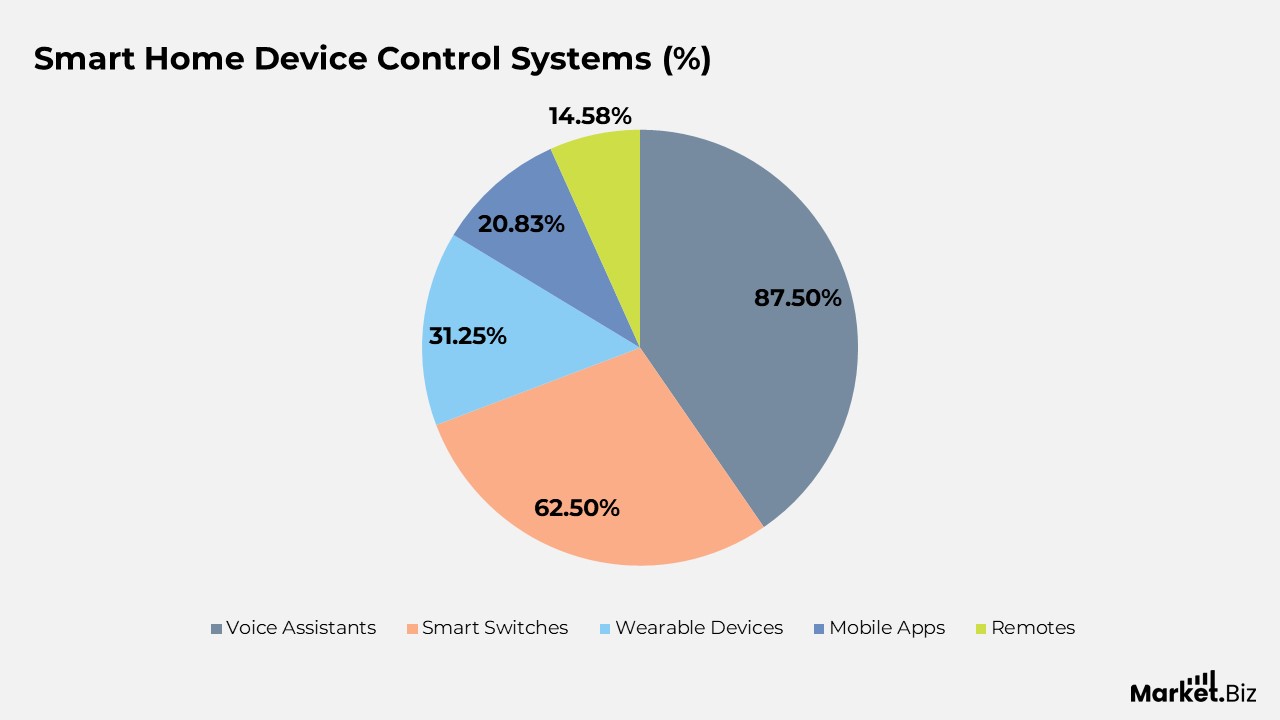
(Source: Good Firms, Statista)
Popularity of Smart Homes Statistics
- 91.9% of households worldwide owned at least one Apple-branded smart device in the first half of 2022, leading the competition by a wide margin. Other brands trail with Microsoft at 72.8%, Amazon at 57.9%, Samsung at 68.7%, and Google at 43.7%.
- Apple boasts the most loyal user base, with 39.1% of households owning 10 or more Apple devices, while other brands have much lower loyalty: Samsung at 4.9%, Microsoft at 2%, Amazon at 2.6%, and Google at 1.1%.
- According to a 2021 survey, 85% of Americans own a smartphone, making it the most popular personal smart device. Other popular devices include tablets with voice control (23.5%), smartwatches (26%), headphones (32.5%), tablets without voice control (23.4%), and fitness trackers (18.9%).
- 35.6% of Americans own a smart speaker, making it more common than smart TVs (25.7%). Other popular living room smart devices include gaming consoles (25%), remotes (9.1%), hubs with built-in screens (21.5%), and robot vacuums (6.6%).
- 4.7% of Americans own a smart fridge, leading other smart kitchen appliances such as ovens (4.2%), smart dishwashers (4.2%), coffee makers (3.4%), microwaves (4.1%), kitchen scales (3.3%), and faucets (2.5%).
- 5.2% of Americans own a smart washing machine, making it more common than smart toothbrushes (3.6%) and smart dryers (4.1%). Other popular bathroom smart devices include skincare systems (2%), mirrors (2%), and bidets (1.8%).
- 5.2% of Americans own a smart fitness scale, followed by home gyms (2.5%). Other popular fitness-related smart devices include smart treadmills and exercise bikes, each with a 2% ownership rate.
- 13.8% of Americans own a garage door opener, making it the most popular outdoor smart device. Other outdoor devices include sprinkler control systems (3.4%), outdoor lighting systems (2.6%), smart gate locks (3.6%), holiday light displays (2%), outdoor weather stations (2.4%), mailboxes (1.6%), and padlocks (1.6%).
(Source: Plume, Reviews.org, Moneyzine)
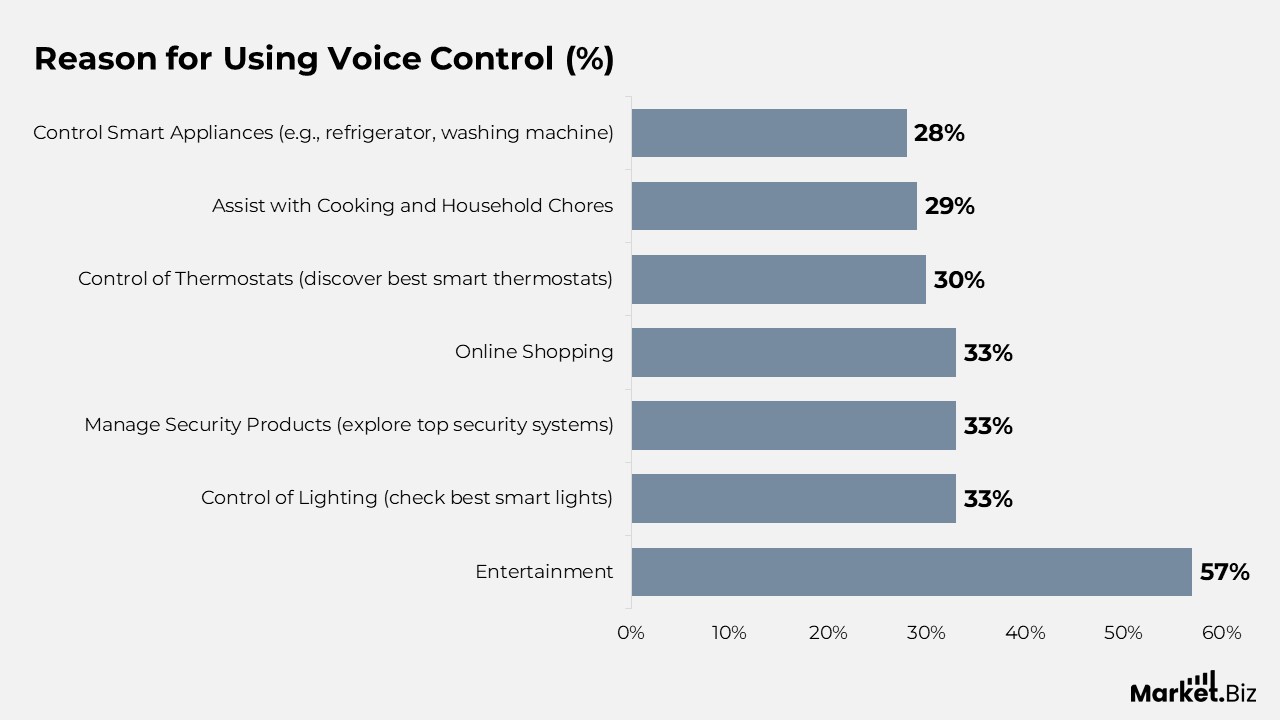
Reasons Americans Use Voice Control Technology
- 57% utilize voice control for entertainment purposes.
- 33% rely on voice control to manage lighting, explore top smart lighting options.
- 33% use voice control to oversee security devices, find the best home security systems and cameras.
- 33% employ voice control for shopping online.
- 30% use it to adjust thermostats. Check out the best smart thermostats.
- 29% turn to voice control for cooking and household tasks.
- 28% use voice control to manage smart appliances like refrigerators and washing machines.
Smart Home Spending Statistics
- In 2022, US$4.6 billion was spent on lighting, making up 1.5% of total smart home expenditures.
- Spending on smart thermostats reached US$8.3 billion, which represents 2.8% of total smart home spending.
- Video entertainment took the largest share with US$192.1 billion, which made up 64.6% of the total smart home market.
- Smart speakers garnered US$27.8 billion in spending, representing 9.3% of total smart home expenses.
- US$16.5 billion was allocated to home monitoring and security, accounting for 5.5% of the overall spending.
- Other smart home products contributed US$48.2 billion, or 16.3%, to the overall expenditure.
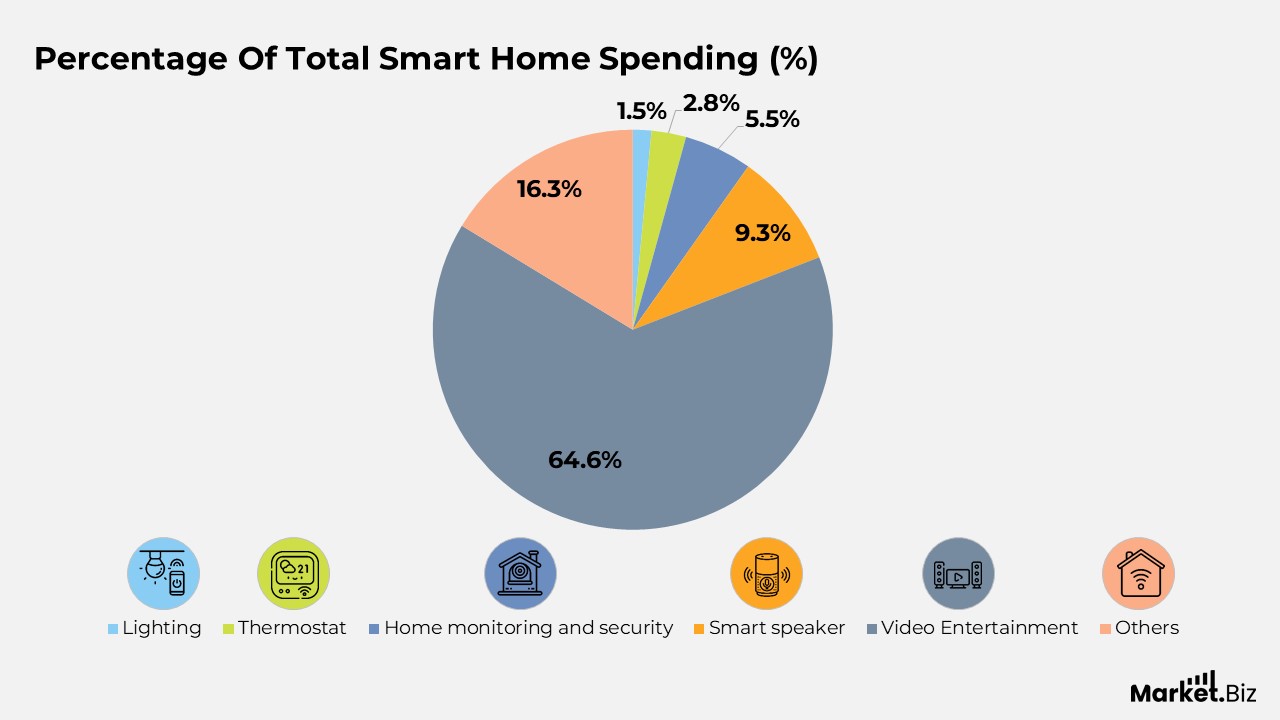
(Source: ThreatLabz report, DemandSage)
Advantages of Home Automation
- 57% of respondents report that smart devices help save time.
- Specifically, 57% of Americans claim that smart products save them about 30 minutes per day, equating to 182.5 hours per year, or approximately a week and a half.
- 33% of real estate agents report that smart homes sell faster than traditional homes.
- Smart heating and cooling systems can reduce energy consumption by up to 50% for smart home users.
- Installing a smart home system can increase a home’s value by at least US$50,000.
- Over 400 people die annually from carbon monoxide poisoning, making a CO detector a valuable addition to a smart home.
- 40% of burglars are deterred when they see a security camera.
- 81% of smart home users would be more likely to purchase a home that features connected technology.
- The average monthly savings from smart home products is US$98.30, which totals US$1,179.60 per year.
- Smart security systems can help lower home insurance rates.
(Source: Forbes, CITyFiED, Statista, HDL)
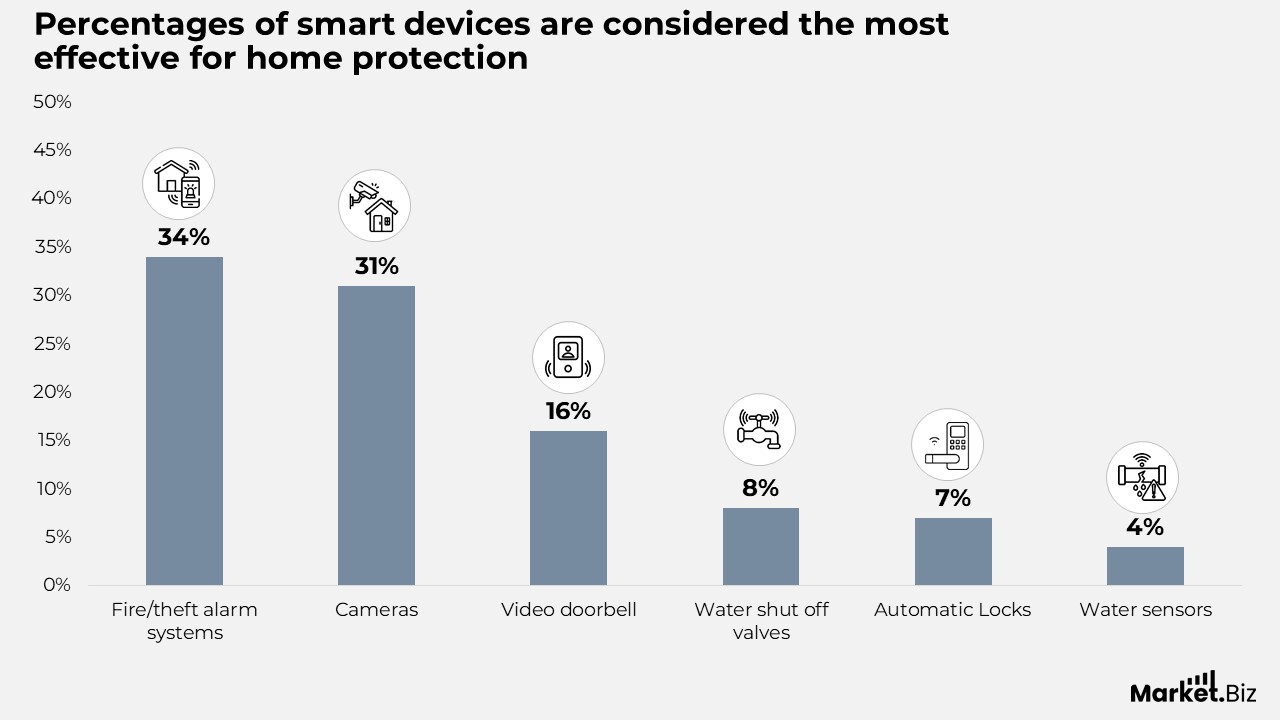
Which Devices Are Considered the Most Effective for Home Protection?
- 34% of individuals believe that fire and theft alarm systems offer the highest level of protection for their home.
- 31% view cameras as the most effective device for home security.
- 16% consider video doorbells to provide the greatest protection.
- 8% feel that water shut-off valves are the most reliable protective device.
- 7% believe automatic locks offer the best security.
- 4% regard water sensors as the most important device for home protection.
(Source: Hippo Holdings Inc., Statista)
Conclusion
Smart home technology is rapidly expanding worldwide, with Apple at the forefront in both market share and customer loyalty. More consumers are incorporating smart devices into their homes, attracted by the convenience and efficiency these products provide.
The range of devices, from smartphones and smart speakers to kitchen appliances and fitness trackers, highlights the increasing desire for connected living.
As adoption grows, the trend is set to accelerate, with a clear shift towards more advanced home automation and enhanced energy management. The future of smart homes is bright, with continuous innovation on the horizon..
FAQ’s
As of 2022, 91.9% of households worldwide owned at least one Apple-branded smart device, making Apple the leading brand. Other brands, such as Microsoft (72.8%), Samsung (68.7%), Amazon (57.9%), and Google (43.7%), follow with lower ownership rates.
The most commonly owned smart devices include smartphones (85% of Americans), smart speakers (35.6% of U.S. households), smart TVs (25.7%), and smart appliances like smart fridges and washing machines.
46% of consumers adopt smart home technology for convenience, while 17% use it to monitor their home when away, and 15% utilize it to lower their utility bills.
Renters tend to favor voice control devices (50%), smart appliances (41%), and smart lights (36%) as their most desired smart home technologies.
69% of U.S. households own at least one smart device, with 35.6% owning a smart speaker. 4.7% own a smart fridge, and 5.2% own a smart washing machine.
Smart home adoption is expected to continue growing, with 37% of new homes projected to include at least one smart device by 2025. As technology advances, smart homes will likely become even more integrated and efficient.
Smart speakers are the most common devices in living rooms, with 35.6% ownership, followed by gaming consoles (25%) and smart TVs (25.7%).