
Introduction
Gemini Statistics provides a concise, data-driven view of Gemini’s performance, adoption, and real-world impact, Google’s advanced generative AI model family. These statistics capture key indicators, including usage growth, application breadth, multimodal capabilities, and productivity outcomes across content creation, data analysis, coding assistance, and enterprise workflows.
By quantifying model accuracy, scalability, and integration within Google’s ecosystem, Gemini Statistics offers valuable insight into how generative AI is shaping decision-making and automation across industries, supporting analysts, developers, and businesses in evaluating the platform’s evolving role in digital transformation.
Editor’s Choice
- Google Gemini logged 1.2 billion total visits in October 2025, with desktop traffic accounting for 813.2 million visits and mobile traffic for 368.8 million visits.
- The platform reached 206.4 million unique visitors in October 2025, up 69% from August 2025.
- Traffic was led by the United States at 12.99%, followed by India at 8.82%, Brazil at 7.53%, Japan at 6.55%, and Indonesia at 6%.
- Users aged 25–34 years were the largest demographic group, accounting for 29.7% of the total audience.
- The gender split among Gemini users is 58% male and 42% female.
- Usage intent shows 40% of users rely on Gemini for research, 30% for creative tasks, 20% for productivity, and 10% for entertainment.
- Gemini 3 Flash ranks as the second-fastest major language model, delivering 207 tokens per second, just behind gpt-oss-120B.
- Pricing for Gemini 3 Flash is set at $0.50 per million input tokens and $3 per million output tokens, compared with GPT-5.2 pricing of $1.75/$14.
- Both Gemini 3 Pro and Gemini 3 Flash support a 1-million-token context window, among the largest available across competing models.
- Gemini 3 Pro shows the strongest performance across code editing, mathematical reasoning, and advanced problem-solving tasks within the Gemini portfolio.
- Around 350 million people use Gemini every month, indicating strong adoption across Google products and consumer applications.
Moreover
- Gemini supports approximately 1.5 billion monthly AI Overview interactions, making it one of the most widely used AI systems in search.
- The Gemini app has about 650 million monthly active users, ranking among the largest AI mobile applications globally.
- Gemini operates across an estimated 1–5 billion devices, giving it one of the broadest AI install bases worldwide.
- Gemini 2.5 Pro achieved a 74.2% score on LiveCodeBench, more than doubling the coding performance of its previous version.
- Gemini 2.5 Flash exceeds 250 tokens per second, ranking it among the fastest major large language models for output speed.
- Long-context accuracy reaches 87% at 128K tokens and remains solid at 69.8% even at 1M tokens.
- Monthly platform traffic consistently surpasses 1.18 billion visits, with average session durations exceeding 7 minutes.
- Google Cloud revenue increased by 34% year over year, supported significantly by rising demand for Gemini-powered AI services.
- Google Gemini has crossed 650 million monthly users, reinforcing its large-scale global presence.
- More than 29.66% of Gemini visitors fall within the 25–34 age range, confirming this group as the core user segment.
- The United States accounts for the highest share of platform traffic at around 15.36%.
- Users in over 230 countries and territories have access to the Gemini chatbot.
- Estimated costs to run a single Bard search query range between $0.006 and $0.031.
- Direct visits account for over 76% of total Gemini traffic, while organic search accounts for 13.55%.
Google Gemini Traffic and User Growth Statistics
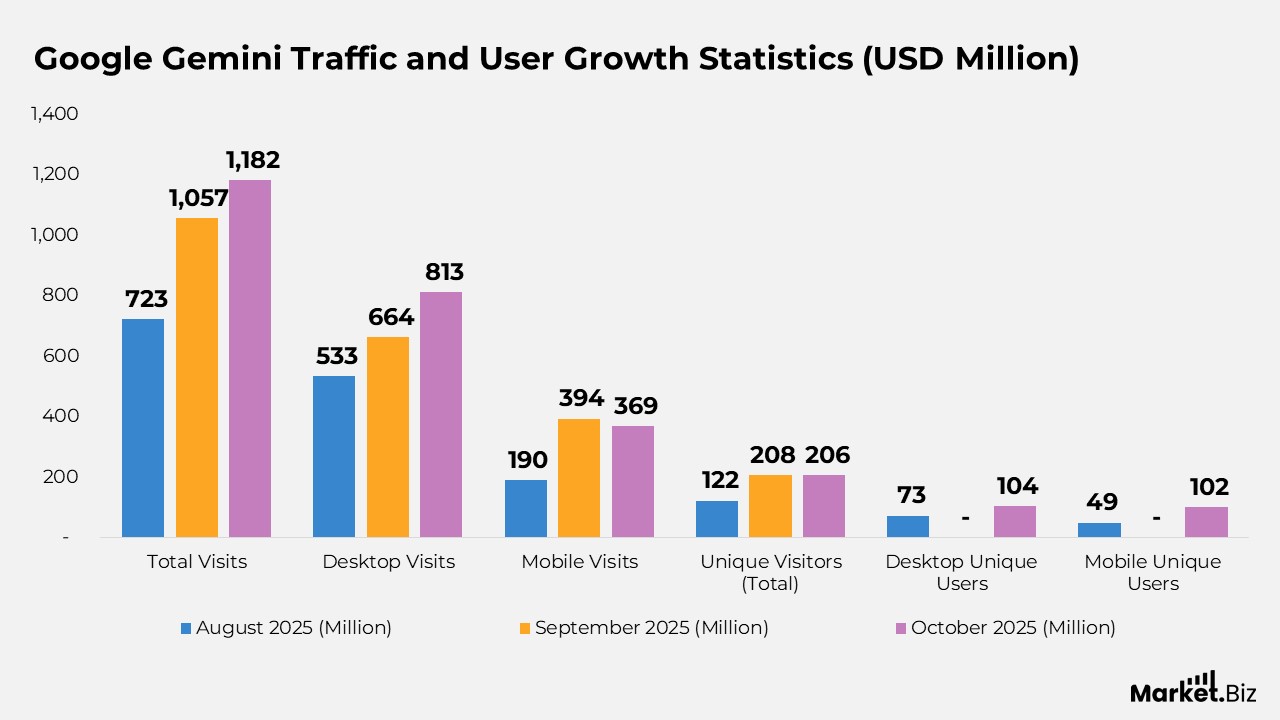
- Google Gemini recorded 1.2 billion total visits in October 2025, marking its highest monthly traffic level to date.
- During October 2025, desktop usage generated 813.2 million visits, while mobile traffic contributed 368.8 million visits.
- Total visits reached 1.182 billion in October, an 11.74% increase from September 2025.
- Mobile usage showed strong momentum, with visits rising from 190.3 million in August 2025 to 393.6 million in September 2025, representing a 106.8% month-over-month increase.
- In August 2025, Gemini logged 723.3 million total visits, which climbed sharply to 1.057 billion in September 2025, posting a 46.24% increase.
- By October 2025, desktop traffic expanded from 533 million in August to 813.2 million, highlighting steady growth in workstation-based usage.
- In comparative platform performance, ChatGPT led global traffic in October 2025 with 6.2 billion visits, while Google Gemini recorded 1.2 billion, and Claude accounted for 197 million visits.
- Google Gemini attracted 206.4 million unique visitors in October 2025, a sharp rise from the previous month.
- Unique visitors increased from 122.1 million in August 2025 to 207.6 million in September 2025, a 69.97% increase.
- Desktop-based unique users grew from 72.69 million in August 2025 to 104.3 million by October 2025.
- Mobile unique visitors more than doubled over the same period, increasing from 49.49 million in August 2025 to 102 million in October 2025, underlining accelerating mobile adoption.
(Sources: DOIT Software, Statista)
Google Gemini Engagement and Usage Performance Statistics
- Google Gemini posted a low bounce rate of 28.96%, ranking among the best-performing platforms for visitor retention compared with key competitors.
- Desktop bounce rates remained stable, moving from 28.46% in August 2025 to 27.24% in October 2025.
- Mobile bounce rates improved more sharply, declining from 41.52% in August 2025 to 32.76% by October 2025.
- In October 2025, Gemini users viewed an average of 4.52 pages per visit, indicating high engagement per session.
- Desktop users accessed an average of 3.45 pages per visit in October 2025, indicating steady interaction levels.
- Mobile engagement was significantly higher, with pages per visit increasing from 4.72 in August 2025 to 6.87 in October 2025.
- The average visit duration on Google Gemini reached 7 minutes 08 seconds in October 2025, reflecting longer user interactions.
- Desktop session time rose slightly from 5 minutes 15 seconds in August 2025 to 5 minutes 30 seconds in October 2025.
- Mobile users spent more time per session, with visit duration expanding from 8 minutes 25 seconds to 10 minutes 46 seconds over the same period.
Further
- Google Gemini now records stronger engagement than several competitors, averaging 4.52 pages per visit, compared with 3.84 on ChatGPT and 3.93 on Claude.
- Average session duration on Gemini is 7 minutes 08 seconds, exceeding ChatGPT’s 6 minutes 25 seconds and Claude’s 5 minutes 59 seconds.
- Gemini’s bounce rate of 28.96% outperforms ChatGPT’s 31.18%, though it remains slightly higher than Claude’s 29.46%.
- User return frequency remains led by ChatGPT with 12.74 visits per unique visitor, followed by Claude at 9.78, and Gemini at 5.73.
- In total monthly traffic, ChatGPT continues to dominate with 6.165 billion visits, compared with Gemini at 1.182 billion and Claude at 196.9 million.
- Google Gemini has a strong mobile footprint, with 32.2% of users accessing it on mobile devices.
- ChatGPT users are primarily desktop-based at 70.3%, with 29.7% accessing via mobile.
- Claude shows the highest desktop dependence, with 89.4% of users on desktop and only 10.6% on mobile.
(Sources: DOIT Software, Statista)
Device Usage Split Across Google Gemini and Competing AI Platforms
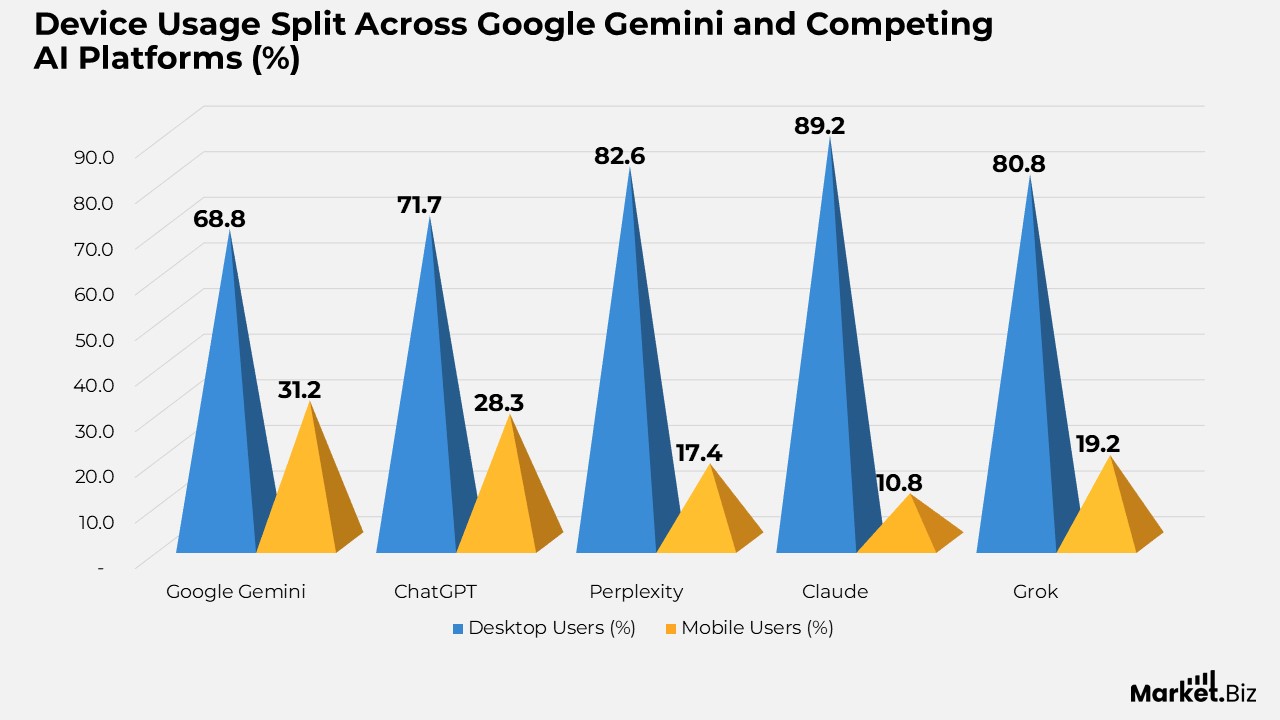
- Google Gemini shows a balanced device mix, with 68.8% of users accessing the platform on desktops and 31.2% on mobile devices.
- ChatGPT usage is more desktop-oriented, with 71.7% of users on desktops and 28.3% on mobile devices.
- Perplexity records a strong desktop preference: 82.6% of its users access the platform on desktop, compared to 17.4% on mobile.
- Claude has the highest desktop dependency among competitors, with 89.2% of users on desktop and only 10.8% on mobile.
- Grok also skews toward desktop usage, accounting for 80.8% of users, while mobile users represent 19.2% of total traffic.
(Sources: DOIT Software, Statista)
Evolution and Development Timeline of Google Gemini AI
- Google introduced Gemini, initially branded as Bard, on February 6, 2023, marking its entry into the generative AI chatbot space.
- The chatbot was designed to support natural conversations using generative AI capabilities powered by Google’s LaMDA language model.
- In March 2023, Google launched limited early access, inviting users in the US and UK to join a waitlist and test the platform.
- Gemini gained major visibility at Google I/O in May 2023, where key updates were announced, including the adoption of PaLM 2, deeper integration with Google products and third-party apps, availability across 180 countries, expanded language support, and new feature rollouts.
- Bard became officially available on February 8, 2023, with broader global access starting on March 21, 2023.
- In December 2023, Google unveiled the Gemini AI model, positioning it as its most advanced AI system to date, with Gemini Pro integrated into Bard and plans for Gemini Ultra to power Bard Advanced in 2024.
- On February 8, 2024, Google unified Bard and Duet AI under the Gemini brand, launching a dedicated Android app and integrating Gemini into the Google app on iOS.
Moreover
- The stable public release of Google Gemini took place on May 21, 2024, enabling widespread adoption across platforms.
- The name Bard was inspired by ancient Celtic storytellers, poets, musicians, and historians known as bards.
- Gemini is built on Google’s LaMDA architecture, which stands for Language Models for Dialogue Applications.
- The LaMDA model leverages Transformer-based neural networks and includes up to 137 billion parameters.
- Google began developing LaMDA in 2017, making Gemini the result of more than 6 years of research and refinement.
- The model was pre-trained on more than 750 GB of diverse data drawn from multiple sources.
- Training datasets include web content, books, and user-generated material such as search queries and translations, though Google has not fully disclosed all sources.
- Gemini was trained on approximately 1.56 trillion words from publicly available datasets.
- In June 2024, Google expanded the Gemini Android app into European markets and announced upcoming features, including Spotify integration, timers, and reminder functionality.
(Sources: Meetanshi, Statista)
Google Gemini Traffic Source Distribution and Referral Channels Statistics
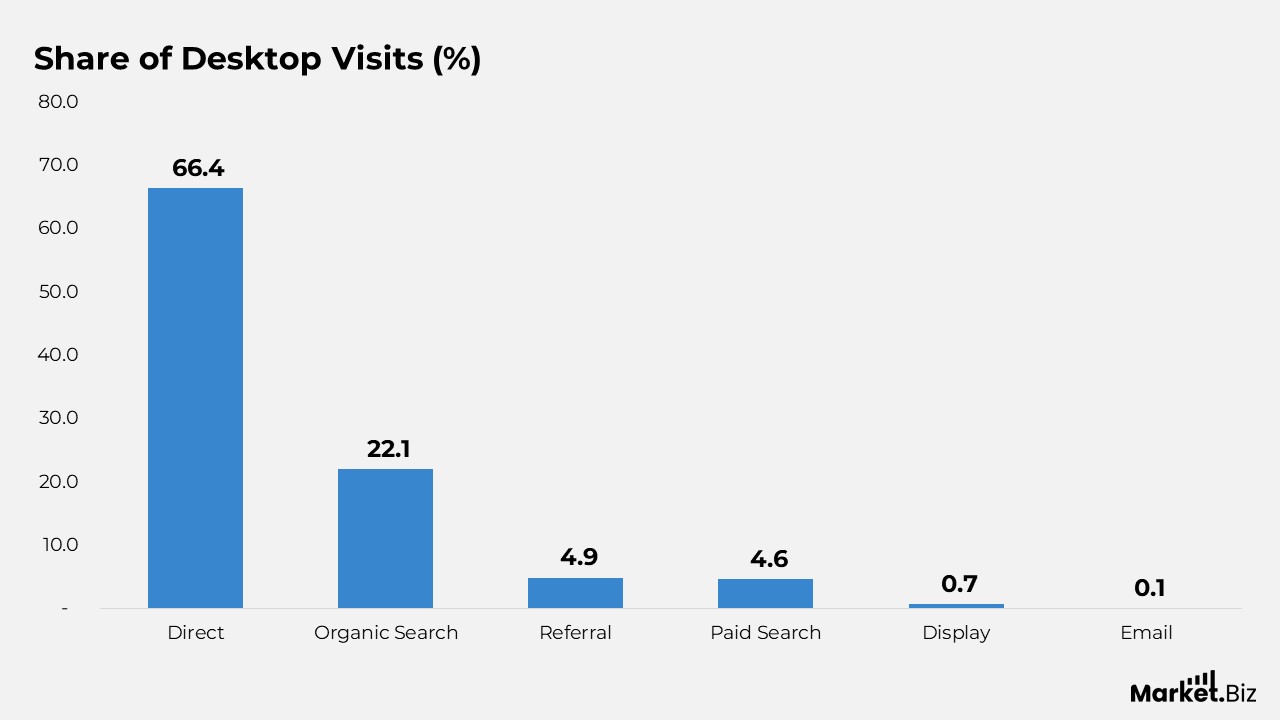
- In June 2024, direct traffic accounted for the largest share of Gemini’s desktop visits at 66.41%, indicating strong brand-led user access.
- Organic search ranked second-largest, accounting for 22.08% of total desktop visits.
- Referral traffic represented 4.88% of visits, reflecting steady inbound traffic from external platforms.
- Paid search generated 4.59% of traffic, showing moderate reliance on advertising-driven discovery.
- Display advertising accounted for a limited 0.71% of visits.
- Email remained the least utilized channel, accounting for only 0.1% of total traffic.
- Gemini’s referral traffic is primarily driven by leading technology news outlets and industry-focused platforms, which significantly boost visibility and user awareness.
- A network of 77 top publishers and 13 major ad networks actively directs traffic to Google Bard.
- Social media traffic is led by YouTube, followed by WhatsApp, Webapp, and Facebook, underscoring video and messaging platforms as key drivers of engagement.
(Sources: Meetanshi, Statista)
Monthly Gemini App Download Trends Statistics
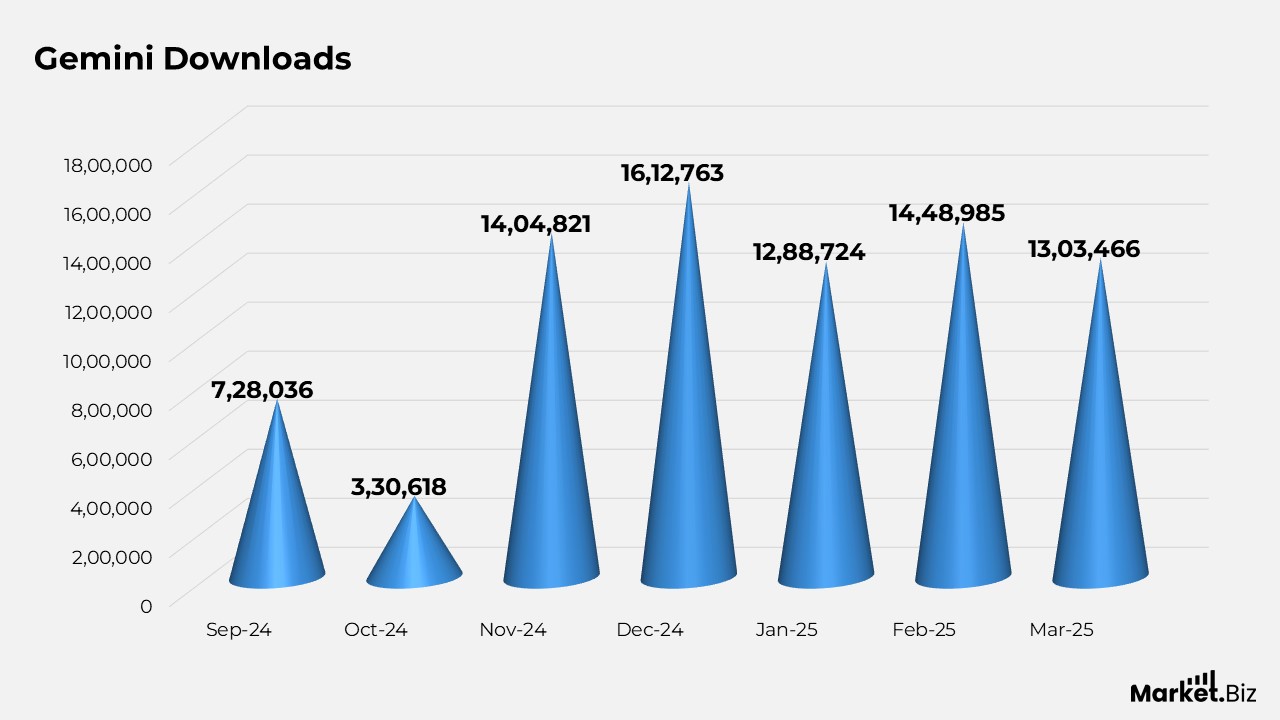
- In March 2025, Gemini recorded 1,303,466 downloads, maintaining strong monthly installation momentum.
- Downloads increased to 1,448,985 in February 2025, marking one of the highest monthly totals in the period.
- During January 2025, the app achieved 1,288,724 downloads, reflecting sustained user interest at the start of the year.
- December 2024 saw the peak monthly performance with 1,612,763 Gemini downloads.
- In November 2024, total downloads reached 1,404,821, indicating accelerating adoption ahead of year-end.
- October 2024 recorded a comparatively lower 330,618 downloads, before adoption began to scale rapidly.
- The upward trend began in September 2024, when Gemini registered 728,036 downloads, laying the foundation for subsequent growth.
(Sources: Meetanshi, Statista)
Google Gemini Model Architecture, Performance Benchmarks, and Speed Comparison Statistics
- The LaMDA model used in the earlier Google Bard version was trained on the Infinite dataset, consisting of 1.56 trillion words and 137 billion parameters.
- Despite its scale, the full training dataset required only 750 GB of storage.
- The dataset composition included 12.5% C4-based data and 12.5% code-related documents sourced from programming tutorials, Q&A platforms, and similar resources.
- It also contained 6.5% English web documents and 6.5% non-English web documents, supporting multilingual understanding.
- Gemini 3 Pro supports a context window of up to 1 million tokens, enabling advanced long-context processing.
- Both Gemini 3 Pro and Gemini 3 Flash match the 1 million-token context capacity of Claude 4.5 Sonnet and Grok 3.
- Grok 4 Fast currently leads in long-context capability with a 2-million-token context window.
- These extended context windows allow near-perfect recall across long documents, source code, audio, video, and mixed-format inputs.
- In comparison, GPT-5 supports 400,000 tokens, Grok 4 handles 256,000, and Claude 4.5 Haiku processes 200,000 tokens.
Moreover
- On the Artificial Analysis Intelligence Index, Gemini 3 Pro achieved a top score of 73, matching GPT-5.2.
- Gemini 3 Flash followed closely with a score of 71, reflecting strong overall reasoning and coding performance.
- Claude 4.5 Opus and GPT-5.1 both recorded 70, while Kimi K2 Thinking scored 67, and Grok 4 scored 65.
- These results show Gemini 3 Pro and GPT-5.2 jointly leading across benchmarks for reasoning, knowledge, mathematics, and coding.
- Gemini 3 Flash ranks among the fastest large language models, processing 207 output tokens per second.
- Only gpt-oss-120B exceeds this speed at 330 tokens per second.
- GPT-5.2 processes 147 tokens per second, while Gemini 3 Pro delivers 132 tokens per second.
- Other models trail behind, including Llama 4 Maverick at 131, Nova 2.0 Pro at 123, and Claude Opus 4.5 at 64 tokens per second.
- Among all Gemini variants, Gemini 3 Pro delivers the strongest overall benchmark performance.
- In mathematics, it achieved 96% on AIME ’25, placing it among the top-performing models.
- For science reasoning, Gemini 3 Pro ranked first with 91% on GPQA Diamond.
- The model scored 90% on MMMU-Pro, demonstrating strong multimodal vision and text understanding.
- Coding performance reached 92% on LiveCodeBench, outperforming several competing models.
- Long-context reasoning accuracy on AA-LCR was 71%, highlighting its capability for extended-context tasks.
(Sources: DOIT Software, Grok, Google Deepmind, Statista, Artificial Analysis)
Google Gemini Traffic Source Breakdown Statistics
- Direct access is the primary traffic driver for Gemini, accounting for 75.64% of total visits, indicating strong brand-led usage.
- Organic search contributes 13.97% of traffic, making it the second-largest acquisition channel.
- Paid search accounts for 4.43% of visits, indicating moderate reliance on advertising campaigns.
- Referral traffic accounts for 4.36% and is supported by external websites and partner platforms.
- Social media channels contribute 1.26% of total traffic, playing a smaller but consistent role in user discovery.
- Display advertising accounts for just 0.22% of visits, showing minimal impact on overall traffic volume.
- Email remains the least used channel, accounting for only 0.12% of Gemini’s total traffic.
(Sources: DOIT Software, Grok, Secondtalent)
Gemini AI Cost Estimates Based on Response Length and Query Penetration Statistics
- When AI handles 10% of Google queries, generating 25 words per response is estimated to cost $0.6 billion, rising to $1.2 billion for 50 words, $1.8 billion for 75 words, and $2.4 billion for 100 words.
- At 20% query coverage, costs scale to $1.2 billion for 25 words, $2.4 billion for 50 words, $3.6 billion for 75 words, and $4.8 billion for 100 words generated per query.
- With 30% of queries processed by AI, estimated spending reaches $1.8 billion for 25 words, $3.6 billion for 50 words, $5.4 billion for 75 words, and $7.2 billion for 100 words.
- At 40% AI query handling, response generation costs increase to $2.4 billion for 25 words, $4.8 billion for 50 words, $7.2 billion for 75 words, and $9.6 billion for 100 words.
- When AI supports 50% of all Google queries, total costs are projected at $3 billion for 25 words, $6 billion for 50 words, $9 billion for 75 words, and $12 billion for 100 words per response.
(Sources: Reuters, Grok, Secondtalent)
Evolution of Google Gemini Statistics
2003
- February 6, 2023: Google announced Bard, its upcoming conversational AI, signalling its entry into generative chat-based assistance.
- March 21, 2023: Bard was opened to public access, allowing users worldwide to begin interacting with the model.
- April 10, 2023: Google introduced an experiments update page, added the “Google it” option, and enhanced Bard’s response capabilities.
- April 21, 2023: Bard expanded support to 20 programming languages and introduced draft responses.
- May 5, 2023: Bard became accessible to Google Workspace account users.
- May 10, 2023: Support for Japanese and Korean languages was added, along with export options to Google Docs and Gmail, plus a new dark theme.
- May 15, 2023: Bard improved its summarization features and began displaying source links for responses.
- May 23, 2023: Image-assisted responses were introduced, enabling visual support for queries.
- June 1, 2023: Bard began delivering more location-aware, context-relevant answers.
- June 7, 2023: Coding, math, and data analysis capabilities were strengthened, with tables exportable to Google Sheets.
- July 13, 2023: Bard expanded to 40 additional languages and 27 new countries, added Google Lens, voice responses, pinned threads, conversation sharing, response editing, and Python code export to Replit.
- September 19, 2023: Bard gained deeper integration with Google apps and services, enabling response verification and broader feature access.
- December 6, 2023: Google unveiled Gemini, its most advanced AI model to date, marking a major shift beyond Bard.
2024
- February 1, 2024: Gemini Pro within Bard became available in over 40 languages and 230+ countries, with image generation support added.
- February 8, 2024: Bard was officially rebranded under Google Gemini, alongside the launch of the Gemini app and the release of Gemini Ultra.
- May 14, 2024: Gemini 1.5 Pro launched for Gemini Advanced subscribers, featuring a 1 million-token context window, a refined conversational interface, and action-based tools.
- December 11, 2024: Google released Gemini 2.0 Flash Experimental, introducing expanded multimodality across text, images, and audio.
2025
- January 30, 2025: Gemini 2.0 Flash became the default model for users.
- February 5, 2025: Gemini 2.0 Pro was released with enhanced performance and broader capabilities.
- March 25, 2025: Gemini 2.5 Pro Experimental launched with advanced reasoning, coding strength, step-by-step “thinking mode,” native multimodality, and a 1 million-token context window.
- April 17, 2025: Gemini 2.5 Flash entered preview as the first hybrid reasoning model balancing speed with adjustable thinking budgets.
- May 20, 2025: Gemini 2.5 Flash became the default model, while Gemini 2.5 Pro was positioned as the most advanced option with Deep Think mode.
- June 17, 2025: General availability was announced for Gemini 2.5 Pro and 2.5 Flash, along with the preview of 2.5 Flash-Lite, the fastest and most cost-efficient variant.
- August 26, 2025: Google publicly released Gemini 2.5 Flash Image (codenamed “Nano Banana”) for image generation and editing.
- September 19, 2025: Gemini was integrated into Chrome desktop for U.S. users, enabling contextual summaries and answers from open tabs.
- November 18, 2025: Google introduced the preview release of Gemini 3 Pro.
- December 16, 2025: Gemini 3 Flash Preview became available and replaced 2.5 Flash as the default model.
(Sources: Reuters, Grok, DOIT, Software)
Conclusion
Gemini Statistics: The overall statistics for Gemini underscore its transformation into a widely adopted, increasingly mature generative AI platform with a strong global presence. Usage and traffic trends point to consistent growth, while engagement indicators such as reduced bounce rates. Higher page views per session, and longer visit durations, especially on mobile, reflect deeper user interaction.
Benchmark results demonstrate competitive strength across reasoning, coding, multimodal performance, and long-context capabilities, supported by scalable speed and cost efficiency. Comparisons with other leading AI platforms show that Gemini performs well in session quality and mobile adoption. Even as further gains in repeat usage remain an opportunity.
Taken together, these insights position Gemini as a steadily strengthening AI system that continues to expand its relevance across users, devices, and real-world applications within Google’s broader AI ecosystem.
FAQ’s
Gemini statistics refer to aggregated quantitative indicators that describe how an AI system performs, scales, and interacts with users. From a theoretical standpoint, they help explain patterns of adoption, engagement behavior, system efficiency, and model capability within a large AI ecosystem such as Google Gemini.
Usage and traffic metrics provide insight into the diffusion and acceptance of an AI system. Theoretically, higher traffic and user volumes signal network effects, platform relevance, and the degree to which an AI tool has become embedded in everyday digital workflows.
Metrics such as bounce rate, pages per visit, and session duration act as proxies for perceived usefulness and cognitive value. In theory, stronger engagement suggests that users find the AI’s responses relevant, coherent, and capable of sustaining interaction over time.
Device distribution highlights how users integrate AI across contexts such as work, research, and mobile decision-making. Theoretically, increasing mobile usage indicates a shift toward real-time, on-demand AI assistance rather than fixed, desktop-centric interaction.
Benchmarks provide standardized ways to evaluate reasoning, coding, mathematical, and multimodal capabilities. From a theoretical perspective, they allow comparisons of model intelligence, generalisation ability, and task competence across different AI architectures.