Introduction
Non-alcoholic Beverages Statistics: Non-alcoholic drinks include a wide variety of beverages that do not contain alcohol, such as soft drinks, fruit juices, water, health drinks, coffee, tea, and dairy-based products. This market is significant and growing, driven by increasing health consciousness and changes in consumer preferences.
Major companies like Coca-Cola and PepsiCo dominate this sector, offering a broad range of products and competing through innovation and brand recognition. The rising consumer inclination towards healthier options boosts the demand for beverages made with natural ingredients that provide functional benefits. It is essential to comply with regulations to ensure product safety and build consumer trust.
The non-alcoholic beverages industry consists of companies engaged in the production and sale of alcohol-free drinking products that are alcohol-free. This segment encompasses a wide array of items, from bottled water to coffee and tea, as well as soft drinks, energy drinks, juices, and more.
Some of the most significant trends in this industry reflect the broader consumer goods trend of heightened attention to health and wellness. In the non-alcoholic beverages sector, this has manifested in the popularity of functional and fermented beverages. Both categories aim to offer consumers benefits beyond mere thirst-quenching or flavor.
Functional beverages frequently incorporate unconventional ingredients such as vitamins, raw fruit, herbs, minerals, probiotics, proteins, and various artificial additives, while fermented products like kombucha promote the naturally occurring health advantages of the beverage, often focusing on digestive health.
Editor’s Choice
- The global revenue for the non-alcoholic beverages market is projected to reach 2,135 billion by the year 2033.
- Dole is at the forefront with a remarkable 76% popularity rating in the beverage sector.
- Among the competitors, PepsiCo distinguishes itself with a notable 18% market share, followed by Unilever with 15%.
- The United States has emerged as the leader, showcasing a substantial market revenue of USD 447.35 billion.
- For individuals aged 20-39, water has become the most frequently consumed beverage, accounting for a significant 56.5%, with coffee at 9.2% and tea at 6.7%.
- Among the male demographic, coffee is the most popular beverage, making up a considerable 16%, closely trailed by water at 48.2%.
- As reported by NielsenIQ, the acquisition of low and no-alcohol beverages was noted in fewer than 5% of households, representing 3.5% of the overall alcohol market share.
General Non-alcoholic Beverages Statistics
- The global revenue for the non-alcoholic beverages market is projected to reach 2,135 billion by the year 2033.
- Among the competitors, PepsiCo distinguishes itself with a notable market share of 18%, closely trailed by Unilever at 15% and The Coca-Cola Company at 14%.
- In 2022, the United States emerged as the leader, showcasing a substantial market revenue of USD 447.35 billion, supported by significant consumer spending power, a large population, and a robust culture of beverage consumption.
- Dole is at the forefront with an impressive popularity rating of 76% in the beverage sector.
- As reported by NielsenIQ, the acquisition of low and no-alcohol beverages was noted in fewer than 5% of households, representing 3.5% of the overall alcohol market share.
- Both Millennials and Generation X demonstrate a stronger preference for non-alcoholic beverages, driven by their desire for healthier lifestyles, with 41% and 54% respectively indicating this as a motivating factor.
- The World Health Organisation (WHO) calls on alcohol manufacturers and retailers to emphasise no-alcohol and lower-alcohol products within their offerings to help decrease overall alcohol consumption.
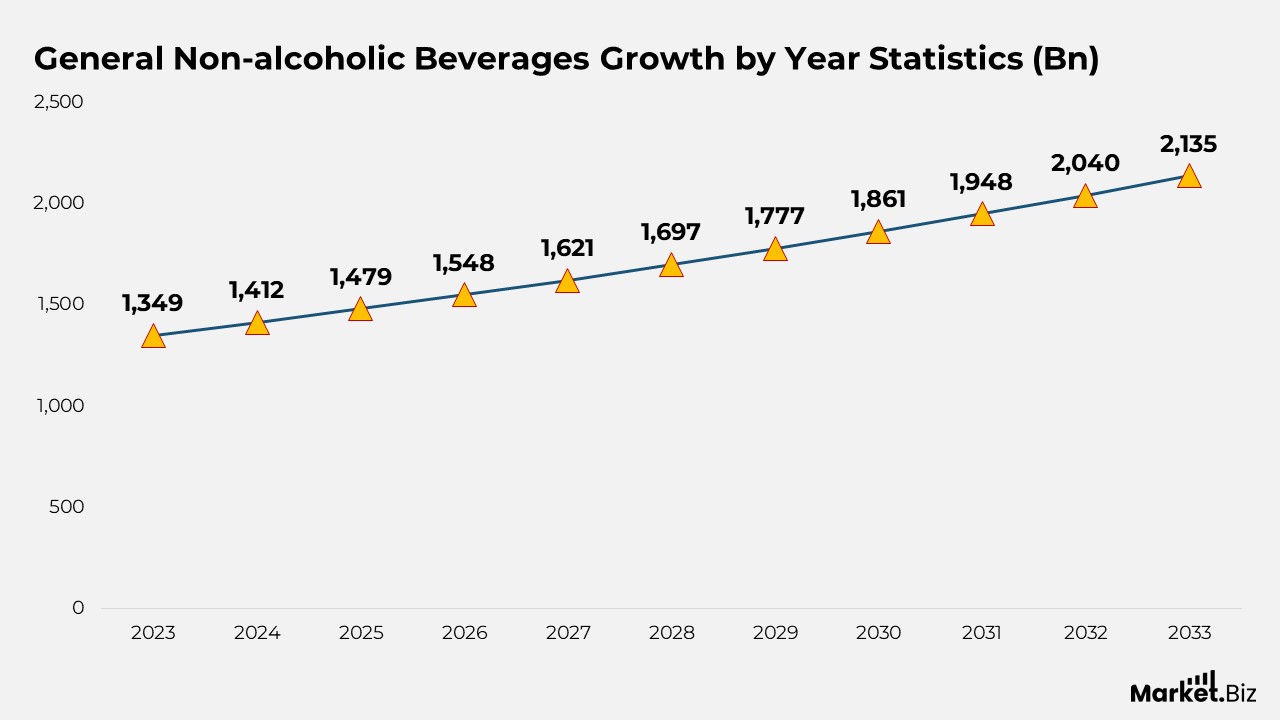
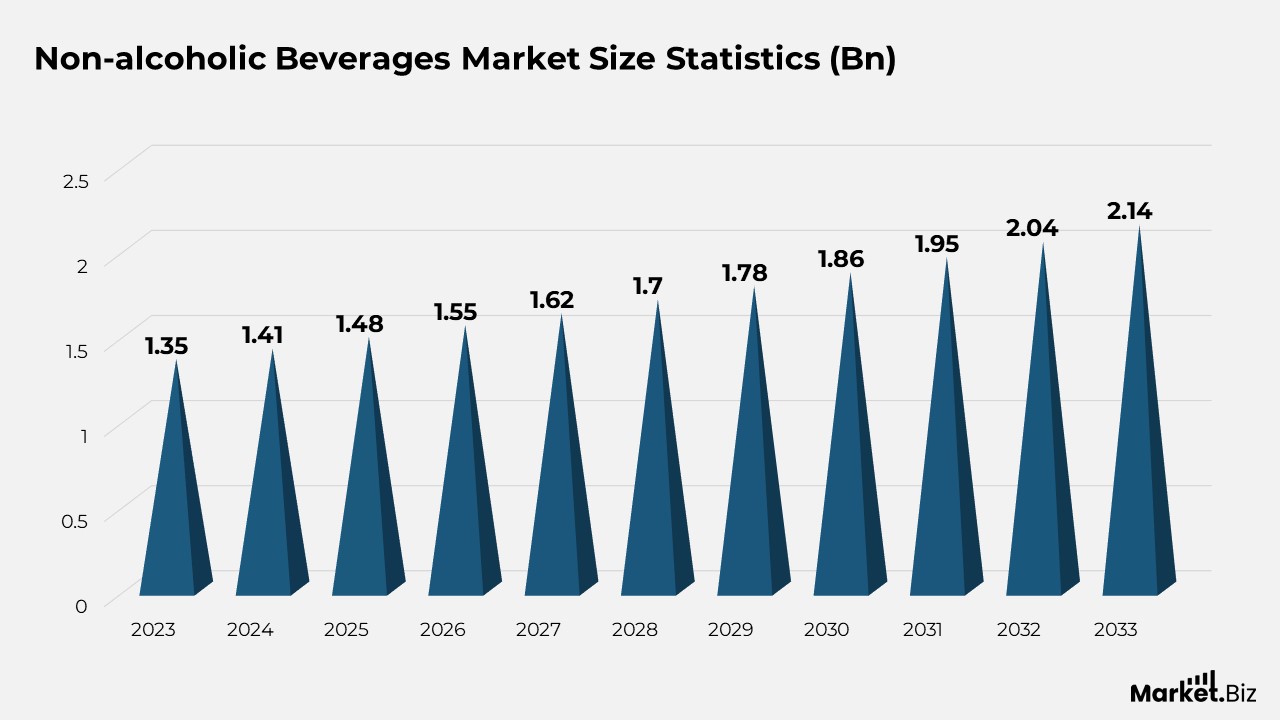
Non-alcoholic Beverages Market Size Statistics
- The global market for non-alcoholic beverages is demonstrating consistent growth, with a compound annual growth rate (CAGR) of 6.1%. In 2023, the revenue is projected to reach USD 1,349 billion, reflecting a steady upward trend throughout the forecast period.
- Forecasts suggest a continual rise in revenue, with expectations of USD 1,412 billion in 2024, USD 1,479 billion in 2025, and USD 1,548 billion in 2026.
- This growth pattern is expected to continue, with revenue predictions of USD 1,621 billion in 2027, USD 1,697 billion in 2028, and USD 1,777 billion in 2029.
- By the year 2030, the market is projected to exceed USD 1,861 billion and maintain its upward trajectory, reaching USD 1,948 billion in 2031 and USD 2,040 billion in 2032.
- Additionally, the market revenue is anticipated to achieve USD 2,135 billion by 2033.
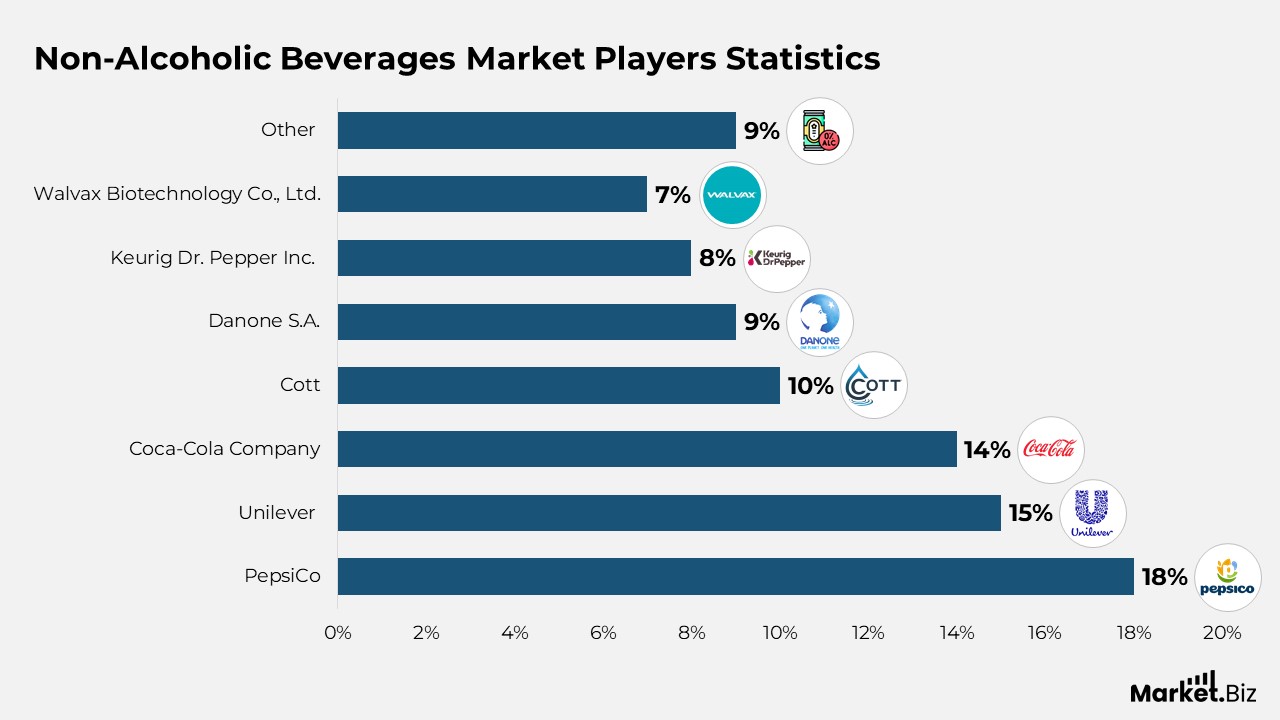
Non-Alcoholic Beverages Market Players Statistics
- Among these competitors, PepsiCo distinguishes itself with a remarkable 18% market share, trailed by Unilever with 15% and The Coca-Cola Company with 14%.
- Cott Corporation and Nestlé each possess a commendable 10% share, whereas Danone S.A. maintains 9%.
- Walvax Biotechnology Co., Ltd. and Keurig Dr. Pepper Inc. account for 7% and 8%, respectively.
- Other significant players together hold a 9% share.
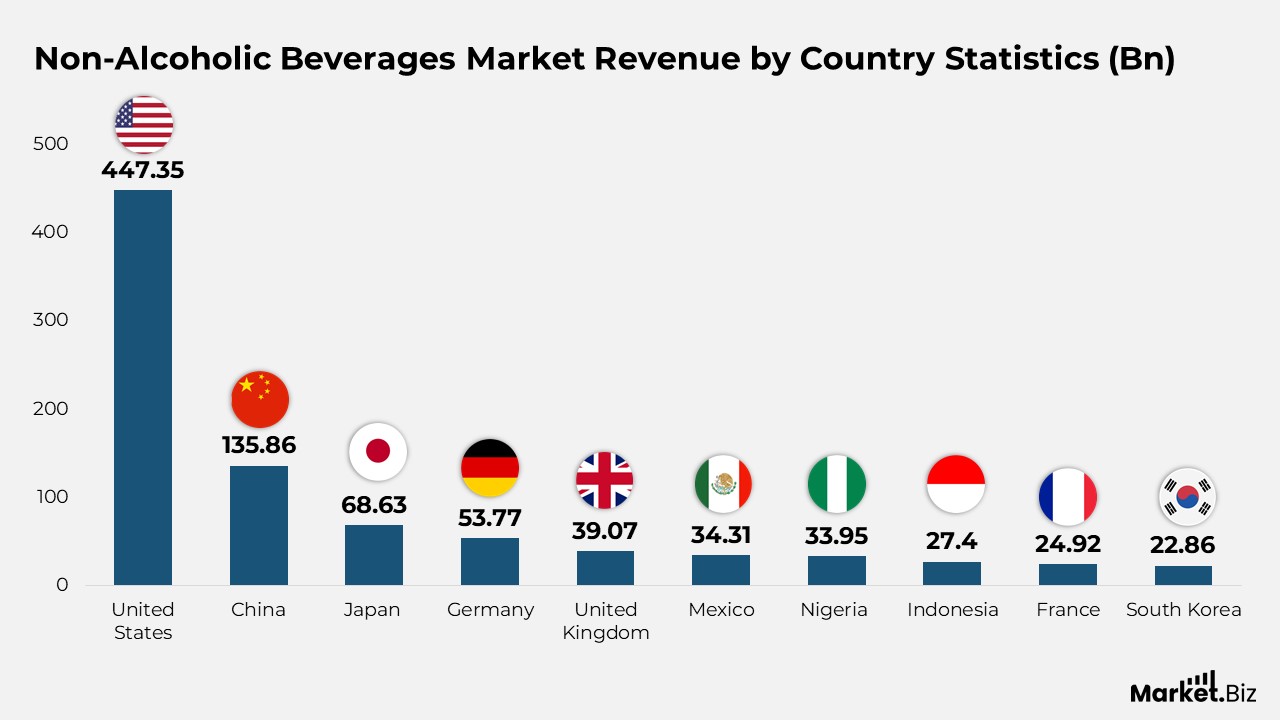
Market Revenue by Country Statistics
- The United States has established itself as the leader, showcasing a substantial market revenue of USD 447.35 billion, supported by robust consumer spending power, a large population, and a strong culture of beverage drinking.
- China, recognised as the most populous country globally, closely followed with a notable revenue of USD 135.86 billion, propelled by swift urbanisation, rising disposable incomes, and an increasing awareness of health and wellness.
- Germany and Japan, both celebrated for their advanced beverage sectors and urbane consumer markets, contributed USD 53.77 billion and USD 68.63 billion, respectively.
- The United Kingdom, Nigeria, and Mexico each exceeded the USD 30 billion threshold.
- France, Indonesia, and South Korea also made significant contributions, with revenue figures ranging from USD 22.86 billion to USD 27.4 billion, reflecting their importance in the global market landscape.
- In addition, countries such as Australia, Spain, Brazil, Canada, and India contributed between USD 15.96 billion and USD 20.75 billion.
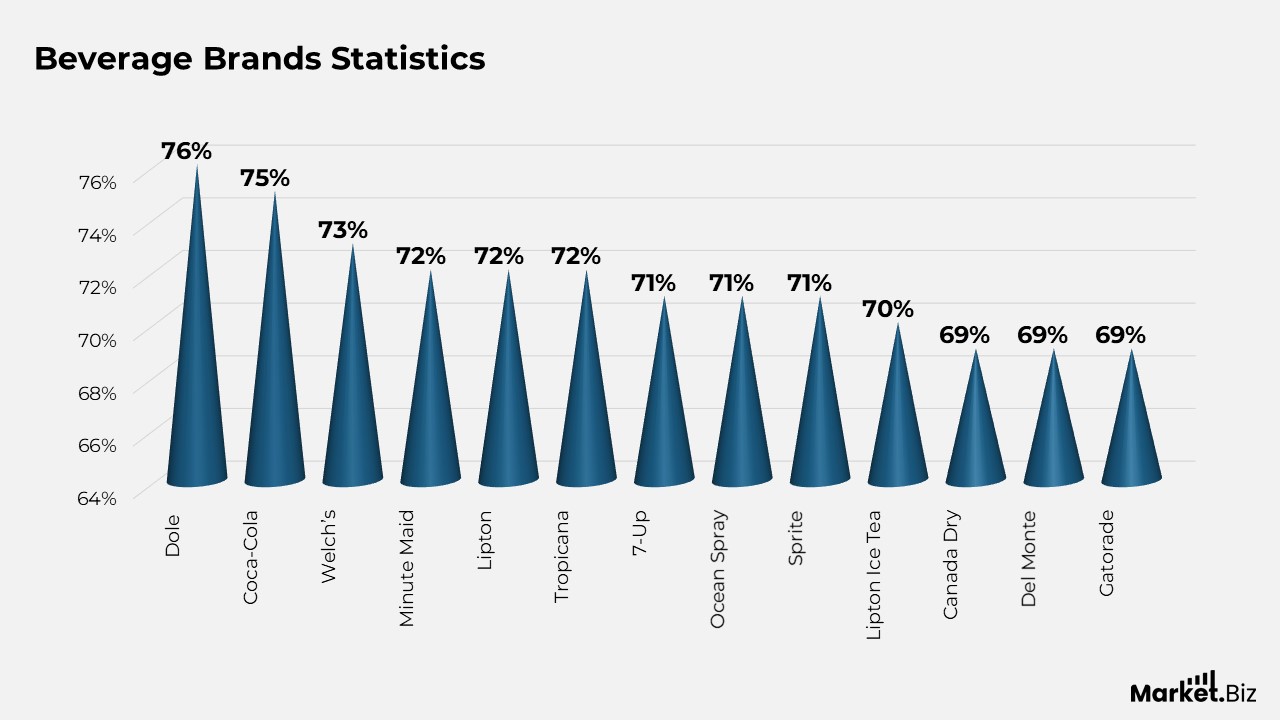
Beverage Brands Statistics
- Dole stands out at the forefront with an impressive popularity rating of 76%, closely trailed by well-known brands such as Coca-Cola and Welch’s, which each hold a substantial share of consumer preference at 75% and 73%, respectively.
- Minute Maid, Lipton, and Tropicana also shine with a popularity rating of 72%, underscoring the strong attraction of their products in the marketplace.
- Other distinguished brands, including 7-Up, Ocean Spray, and Sprite, sustain a notable presence with popularity ratings of 71%.
- Lipton Ice Tea enjoys significant favorability with a 70% rating, alongside Del Monte, Canada Dry, and Gatorade, each achieving a commendable 69% popularity rating.
Non-Alcoholic Beverage Consumers by Age Statistics
- Among individuals aged 20 to 39, water was identified as the most frequently consumed beverage, accounting for a significant 56.5%, followed by coffee at 9.2% and tea at 6.7%.
- Fruit beverages and sweetened beverages also played a notable role, contributing 13.5% and 6.5%, respectively.
- In the 40 to 59 age category, coffee consumption saw a marked increase to 16.1%, surpassing tea and establishing itself as the second most popular beverage after water, which continued to be the leading choice at 49.3%.
- Consumption levels of fruit beverages, milk, and sweetened beverages, remained relatively consistent.
- Interestingly, among individuals aged 60 and above, there was a significant shift towards coffee and tea, with coffee consumption rising to 20.5% and tea to 10.3%, possibly indicating a preference for warm beverages in older populations.
- Water consumption stayed high at 46.9%, underscoring its ongoing significance across all age demographics.
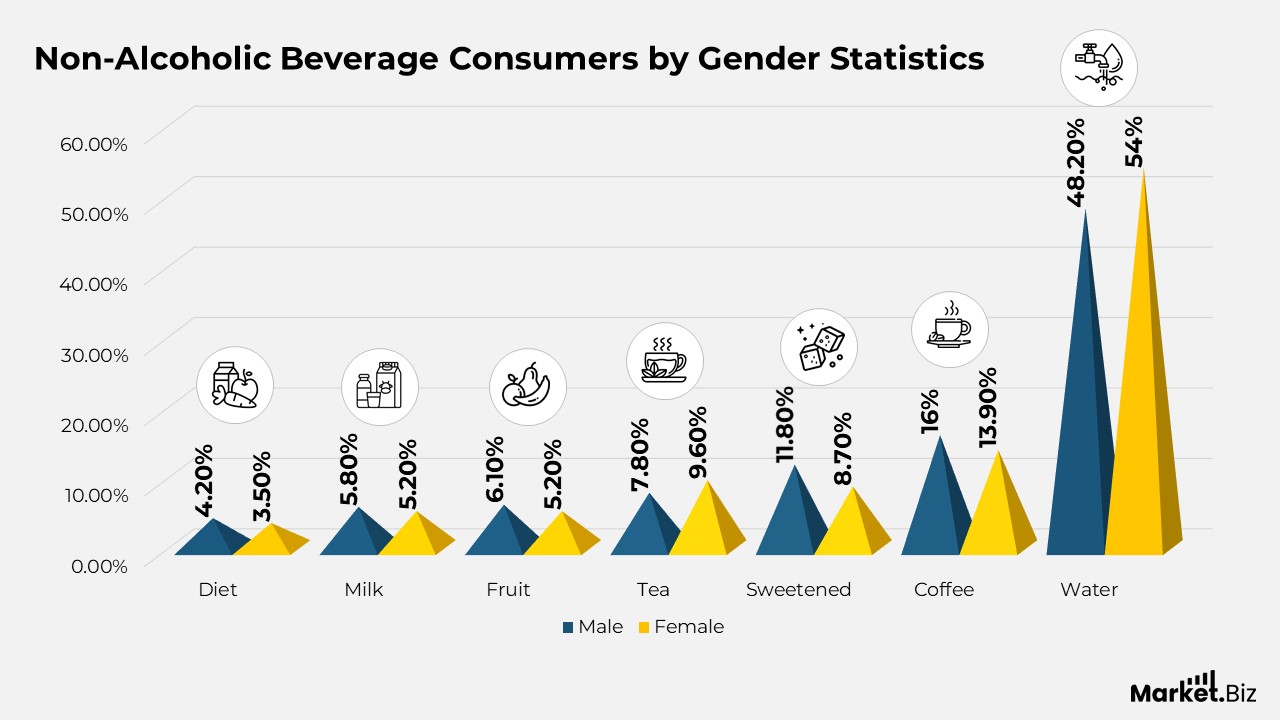
Non-Alcoholic Beverage Consumers by Gender Statistics
- Among men, coffee has emerged as the most popular beverage, representing a considerable 16%, while water is a close second at 48.2%.
- Tea and sugary drinks have also reached notable consumption rates of 7.8% and 11.8%, respectively.
- In contrast, women displayed a preference for water, with 54% selecting it as their beverage of choice, followed by coffee at 13.9%.
Sales Statistics By Non-Alcoholic Beverage
- According to NielsenIQ, fewer than 5% of households reported purchasing low and no-alcohol beverages, which accounted for 3.5% of the overall alcohol market share.
- The NielsenIQ BASES stated highlighted a notable rise in product introductions, revealing that the number of non-alcohol launches tested in 2021 was 15 times greater than in 2020.
- During the 52 weeks ending in late October 2021, sales of non-alcoholic beverages increased by 33%, while sales of low-alcoholic beverages rose by 8%.
- Online sales of LNA beverages saw an impressive growth of 315% from October 2020 to 2021, significantly surpassing the 26% increase in sales of alcoholic beverages.
- NielsenIQ researchers observed that the purchase of non-alcoholic beverages was not an exclusive decision, as 78% of consumers who bought non-alcoholic beverages also purchased alcoholic options such as wine, beer, and spirits.
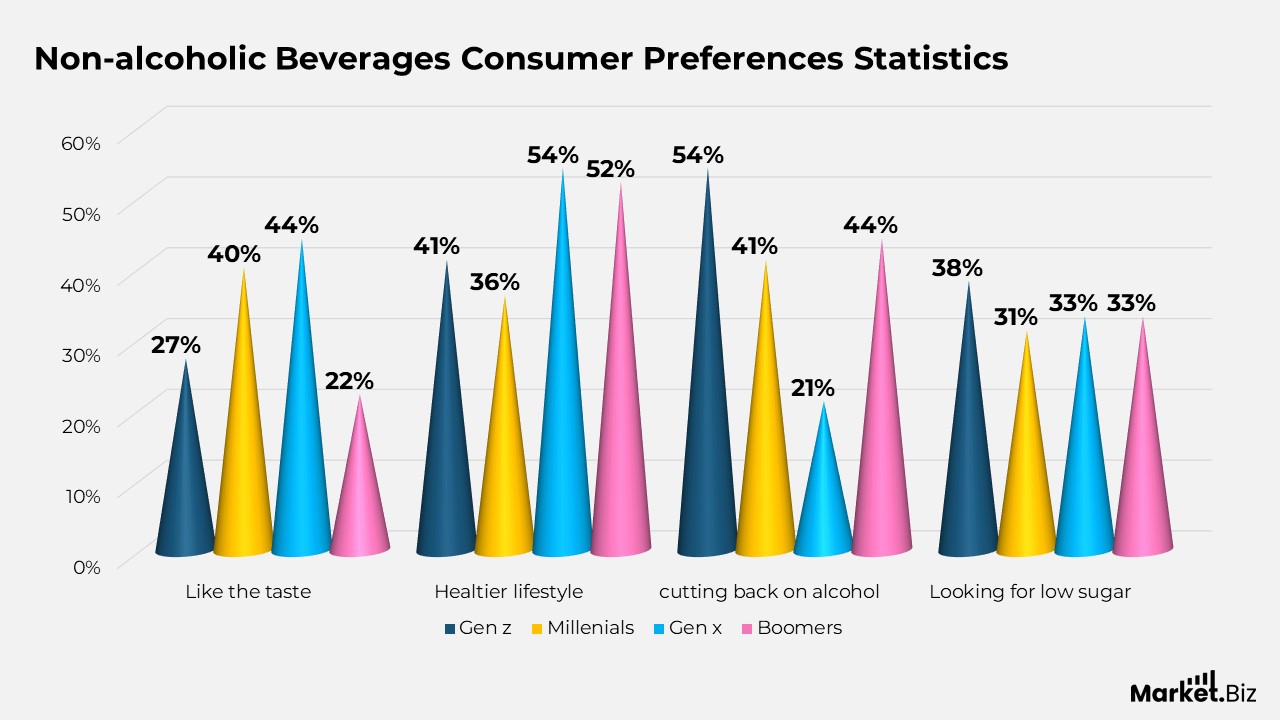
Non-alcoholic Beverages Consumer Preferences Statistics
- Among Generation Z, Millennials, Generation X, and Baby Boomers, there are varying preferences that typically encompass taste preference, health considerations, and the desire to minimize alcohol consumption.
- Millennials and Generation X demonstrate a stronger tendency towards non-alcoholic drinks, motivated by their commitment to healthier living, with 41% and 54% respectively identifying this as a key factor.
- Conversely, Generation X and Baby Boomers are more inclined to choose non-alcoholic beverages based on taste, with 44% and 22% respectively expressing this preference.
Recent Development Statistics
- Chamberlain Coffee has introduced a new range of ready-to-drink, plant-based cold brew lattes in multiple flavors, which became available nationwide through Walmart starting in April 2023.
- Milo’s Tea Company has invested USD 130 million to construct a new manufacturing and distribution facility in South Carolina, reflecting a strong expansion strategy that became operational in January 2023.
- The beverage industry has also experienced strategic growth, with companies such as Varun Beverages enhancing their presence by acquiring The Beverage Company for around 13.2 billion rupees, signifying a major expansion into Africa, as reported in early 2024.
- PepsiCo has purchased Rockstar Energy Drinks for $3.85 billion, with the intention of bolstering its position in the energy drinks market and diversifying its product range.
Non-alcoholic Beverages Future Predictions
- Companies are expected to invest in sustainable packaging solutions, including lighter, fully recyclable PET bottles and aluminum cans, in response to consumer environmental concerns.
- By the year 2030, the market is projected to exceed USD 1,861 billion and is anticipated to keep growing, reaching USD 1,948 billion in 2031 and USD 2,040 billion in 2032.
Conclusion
The non-alcoholic beverages industry is flourishing and transforming, driven by shifts in consumer preferences, heightened health consciousness, and the introduction of innovative products. This market offers a diverse range of options, including sodas, bottled water, fruit juices, and functional drinks, creating significant opportunities for expansion.
Leading companies such as Coca-Cola, PepsiCo, and Nestlé dominate the sector, capitalizing on their innovative approaches and strong brand identities. The increasing consumer inclination towards healthier options and a decline in alcohol consumption are key factors propelling market growth.
As regulatory scrutiny intensifies and sustainability issues gain prominence, businesses must focus on compliance and environmentally friendly practices to uphold consumer confidence. The non-alcoholic beverages sector is set for ongoing growth, adapting to consumer demands for healthier and more sustainable drink choices.
FAQs
Non-alcoholic beverages refer to drinks that contain either no alcohol or less than 0.5% alcohol by volume (ABV). They are intended for hydration, refreshment, or as substitutes for alcoholic drinks. Examples include water, coffee, tea, juices, dairy-based beverages, soft drinks, and non-alcoholic spirits or beers. These drinks are typically safe for individuals of all ages and are not heavily regulated.
Non-beverage alcohols are any forms of alcohol that are not intended for consumption as drinks. Examples of non-beverage alcohols include isopropyl alcohol (commonly found in hand sanitizers, rubbing alcohol, cosmetics, and cleaning products) and methyl alcohol (used in industrial solvents, antifreeze, and camping stoves).
Some widely enjoyed non-alcoholic beverages consist of carbonated soft drinks (such as cola and lemon-lime sodas), bottled water, fruit juices (like orange juice and apple juice), various teas (including green tea and herbal tea), coffees (such as black coffee and lattes), and functional drinks (like energy drinks and sports drinks).