
Introduction
Streaming Services Statistics: Streaming services have significantly altered the entertainment industry, changing the way individuals access content. The rise of high-speed internet and the widespread availability of smart devices have contributed to the expansion of these platforms, providing a vast selection of movies, television programs, music, and more, all at the convenience of the viewers.
These streaming services have transformed entertainment into a multi-billion-dollar global industry, driven by on-demand access, a variety of content (including video, music, and gaming), and a departure from traditional television.
Consumers are now subscribing to multiple platforms, which has led to substantial changes towards ad-supported models (FAST) and live sports, establishing it as a leading force in media consumption.
Editor’s Choice
- 15% of young individuals utilised a streaming service’s complimentary trial prior to opting for a paid subscription.
- As of 2021, streaming services had a combined total of over 1.1 billion subscribers worldwide.
- In 2021, music streaming revenue in the United States surpassed $12.4 billion.
- The annual expenditure on CTV advertising in the United States is projected to reach $36 billion by 2026.
- Worldwide, 44.9% of internet users are subscribed to a paid OTT service, which includes platforms such as Netflix and YouTube.
- As of 2021, Amazon Prime Video had over 175 million Prime members worldwide.
- As of 2021, Hulu boasted more than 39 million paid subscribers and a total of over 75 million subscribers in the United States.
- Streaming was responsible for 82% of the total revenues in the music industry in the U.S. in 2020.
General Streaming Services Statistics
- 15% of young individuals utilised a streaming service’s complimentary trial prior to opting for a paid subscription.
- 46% of individuals expressed that the selection of streaming services was becoming increasingly overwhelming.
- Data from 2019 indicates that there were over 640,000 unique titles available across various streaming platforms in the United States. By February 2022, this figure had risen to 817,000.
- 72% of respondents indicated that they appreciated the user experience provided by their streaming services.
- The global streaming market is projected to reach a value of $1.69 trillion by the year 2029.
- In 2020, the demand for international streaming was 5.7% higher than it was in 2019.
- 27% of internet users in the UK reported using two streaming services in 2022.
- 49% of those surveyed believed that video and music streaming services ought to provide more options for group subscriptions.
- Approximately 22% of streaming subscribers in Brazil, Japan, Germany, and the United Kingdom canceled and then resubscribed as of 2022.
- As of the first quarter of 2022, there were three trillion streaming data events occurring daily.
Streaming Services Market Statistics
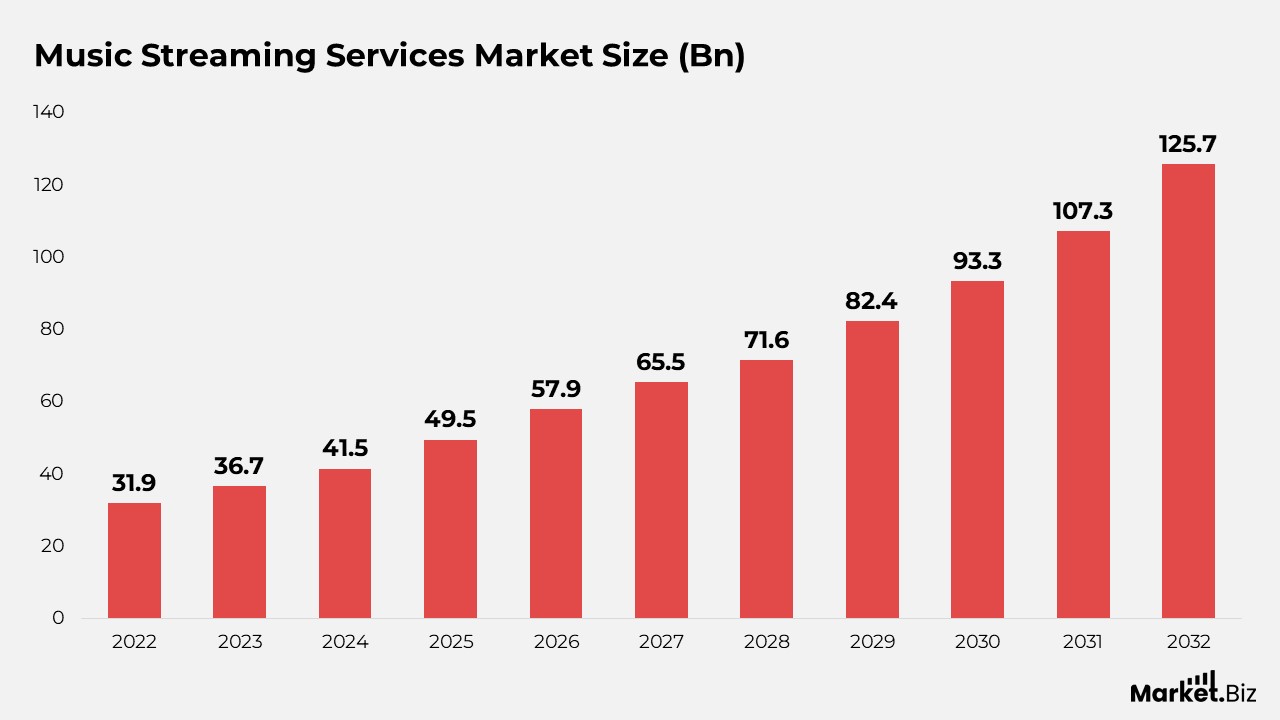
- The Global Music Streaming Market is projected to reach approximately USD 125.70 Billion by 2032, up from USD 36.7 Billion in 2023, reflecting a compound annual growth rate (CAGR) of 15.10% throughout the forecast period from 2023 to 2032.
- In 2020, the worldwide streaming sector produced more than $100 billion in revenue.
- As of 2021, streaming services had a combined total of over 1.1 billion subscribers worldwide.
Music Streaming Services Statistics
- In 2021, music streaming revenue in the United States surpassed $12.4 billion.
- By 2027, the digital music streaming sector is anticipated to continue being the leading segment of the industry.
- The revenue from the digital music market is projected to reach $15.6 billion in that same year.
- Currently, Spotify has 456 million users, including 195 million paid subscribers.
- As of January 2023, Spotify reported having 456 million users across more than 180 regions.
- In November 2021, Spotify AB formed a partnership with Netflix, Inc.
- R&B/hip-hop emerged as the most popular music streaming genre in the United States.
- Data from September 2022 indicates that this genre represented 29.9% of all music streams in the USA.
- In 2021, 62% of consumers in the U.S. utilized advertising-supported music streaming services.
- This category included platforms such as Spotify, TikTok, and YouTube. Consequently, advertising revenue increased by 47%, rising from $1.2 billion in 2020 to $1.8 billion in 2021.
- 37% of users indicated they would terminate a paid music service if prices were to rise.
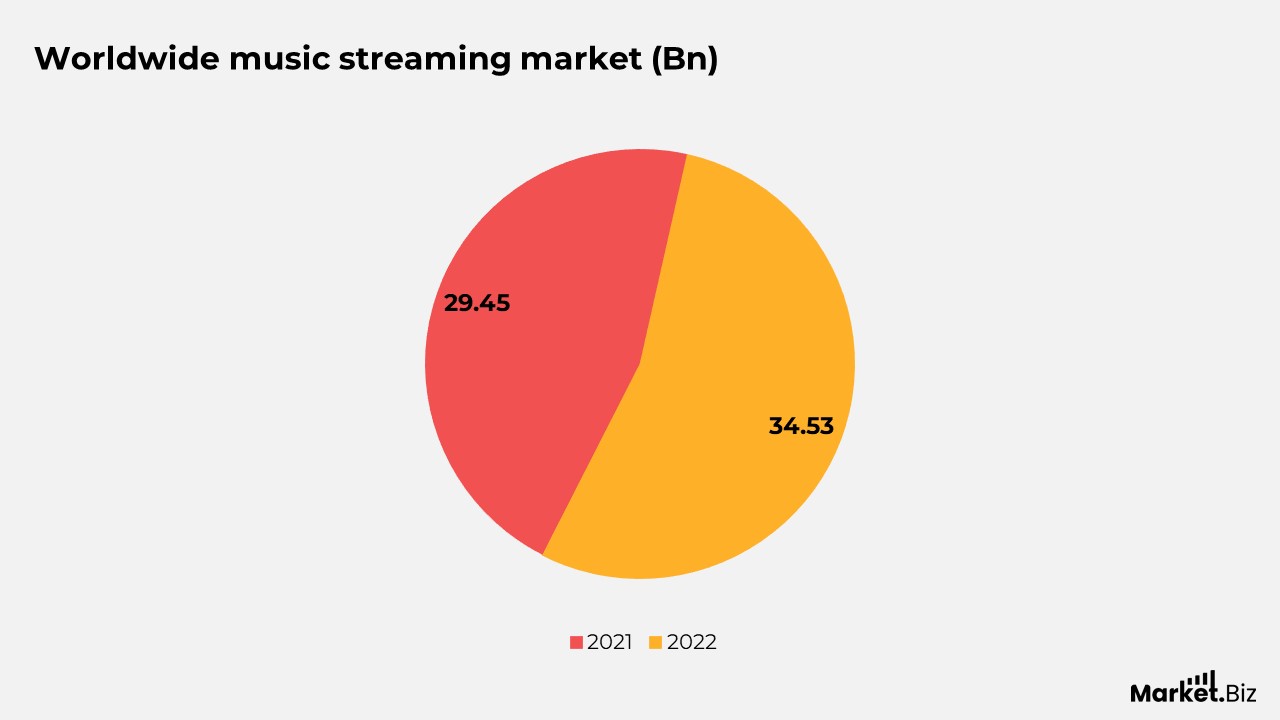
- The global music streaming market was valued at $29.45 billion in 2021 and $34.53 billion in 2022.
- Nearly 50% of Brazilian participants reported listening to podcasts on YouTube and Spotify.
Video Streaming Services Statistics
- Approximately 60% of young adults in the United States primarily utilize online streaming platforms for television viewing.
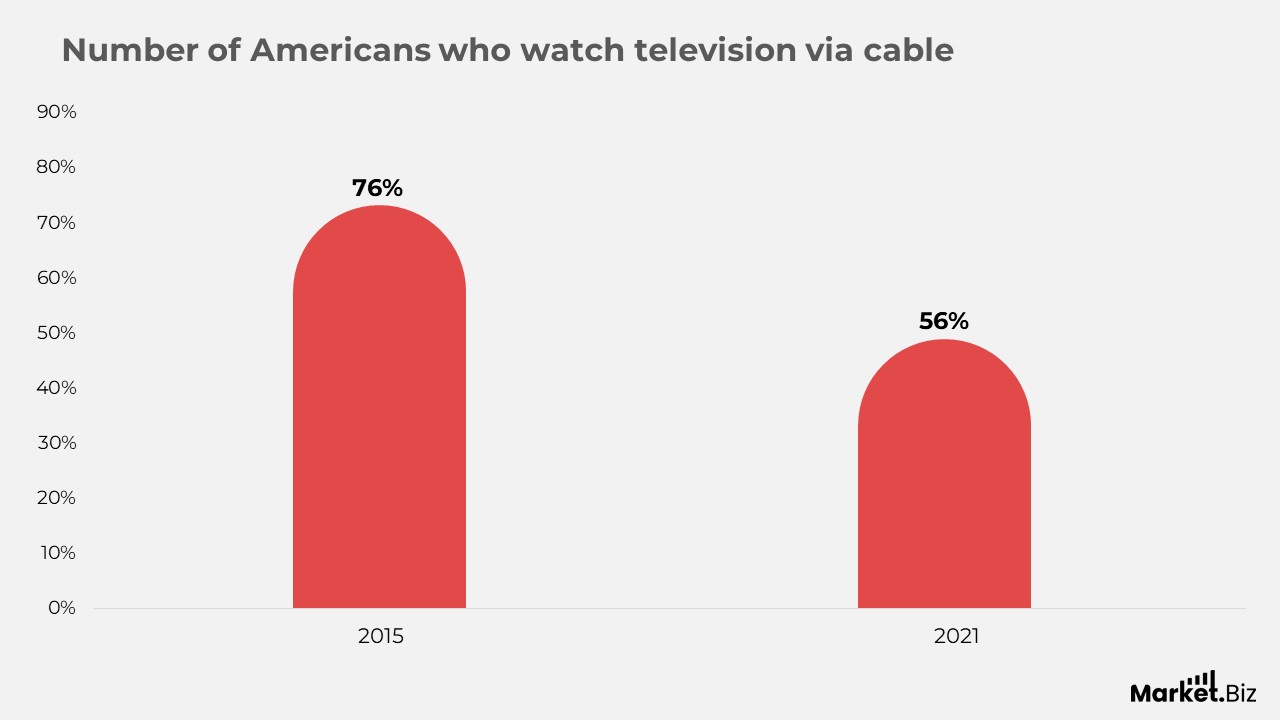
- The percentage of Americans watching television through cable or satellite has drastically decreased from 76% in 2015 to 56% in 2021.
- U.S. adults currently dedicate nearly 6 hours each day to video consumption. This duration (5:57) indicates an 11-minute rise in video viewing, with 6 of those 11 minutes attributed to TV-connected devices.
- In 2023, 83% of households in the United States subscribed to a paid video service such as Netflix or Hulu.
- By 2024, half of the consumers who engage with online video will utilize either a free or paid ad-supported streaming service.
- Millennials continue to represent the largest demographic of CTV users, totaling 62 million, while Gen Z closely follows with 52.8 million users. Furthermore, 51.6 million Gen X individuals and 35.8 million Baby Boomers are also utilizing CTV.
- Consumers are 39% more inclined to share content when it is presented in video format.
Moreover
- While video can assist in converting customers who are already inclined to make a purchase, it also allows existing customers of a retailer to introduce friends and family to the brand. Notably, 48% of consumers have shared a brand video on their social media accounts.
- Nearly 80% of marketers acknowledge the growing significance of video (encompassing TV, digital video, social video, and OTT video) as a vital medium.
- Video content could potentially constitute up to 90% of all 5G traffic.
- 29% of consumers are willing to pay a premium if 5G offers “enhanced video quality” on mobile devices and “reduced buffering during video streaming.”
- Interactive video advertisements motivate consumers to engage with an ad for 47% longer on average and enhance the ad’s memorability by 32%.
- Consumers exhibit a low tolerance for poor streaming quality. For many, 90 seconds is the maximum duration a viewer will endure a disrupted stream.
- Streaming represents 26% of the total time allocated to television viewing.
- The annual expenditure on CTV advertising in the United States is projected to reach $36 billion by 2026.
- 68% of the U.S. population, equating to 233 million individuals, utilizes a connected TV.
- 54% of internet users in the United States subscribe to four or more over-the-top (OTT) video services, with 20% subscribing to eight or more services.
Global Streaming Statistics
- Worldwide, 44.9% of internet users are subscribed to a paid OTT service, which includes platforms such as Netflix and YouTube.
- North America represents the largest market region, comprising 73.6% of all subscribers.
- In regions outside of North America, 56.1% of internet users in Western Europe utilise paid OTT services, 47.7% in the Asia-Pacific region and 41% in Latin America.
- The regions with the lowest popularity for paid OTT viewership are Central and Eastern Europe at 27.6% and the Middle East/Africa at 20.6%.
- Despite the current low adoption rates of OTT in the Middle East and Africa, the OTT market in this region is projected to grow by 14.2% in 2024.
- By 2024, half of the global internet users, amounting to 2.44 billion individuals, are expected to watch YouTube.
- In China, approximately 750 million people are anticipated to subscribe to OTT services in 2024, primarily utilising platforms such as iQiyi, Tencent Video, and Youku.
- China’s live-streaming sector boasts over 425 million users.
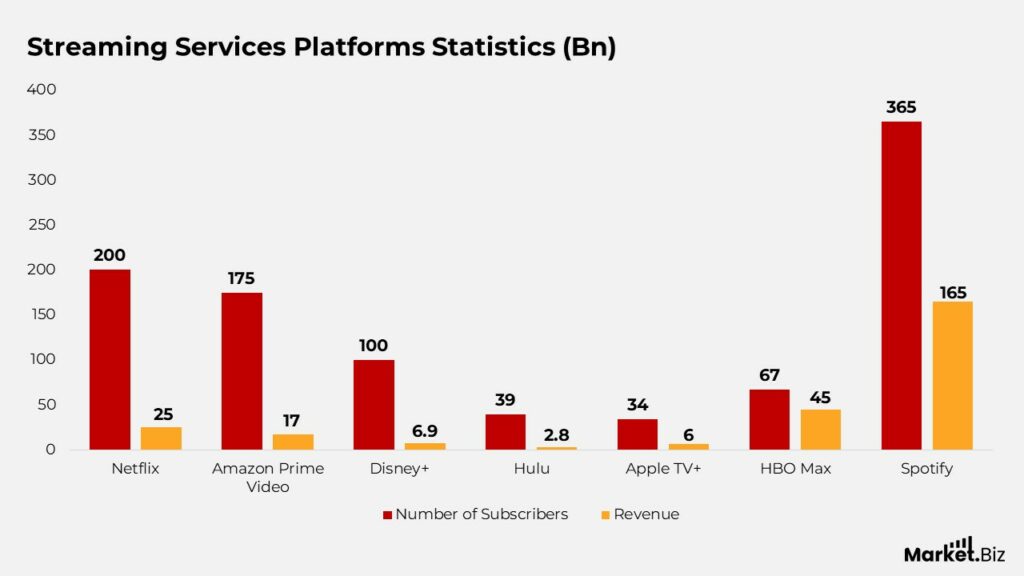
Streaming Services Platforms Statistics
Netflix
- As of 2021, Netflix boasted more than 200 million paying subscribers globally.
- In 2020, the platform launched over 500 original films and television series.
- On average, a Netflix subscriber streamed approximately 3 hours of content each day in 2020.
- The series “Bridgerton” emerged as one of Netflix’s most popular original productions, achieving viewership of over 82 million households within its initial 28 days.
- For the year 2020, Netflix’s total revenue was approximately $25 billion.
Amazon Prime Video
- As of 2021, Amazon Prime Video had over 175 million Prime members worldwide.
- Some of the most popular Amazon Original series included “The Boys” and “The Marvellous Mrs. Maisel.”
- In 2020, Amazon Prime Video accounted for roughly 20% of the subscription video market in the U.S.
- The expected global revenue from digital video advertising for the platform was projected to surpass $17 billion in 2021.
- In 2020, Amazon’s budget for content on Prime Video was estimated to reach $9 billion.
Disney+
- Disney+ acquired more than 100 million subscribers in just 16 months following its launch.
- “The Mandalorian” served as a key program for Disney+, enhancing its appeal and drawing in a large viewership.
- In 2020, Disney+ represented approximately 14% of all over-the-top (OTT) subscriptions in the United States.
- The global revenue for the service was anticipated to hit $6.9 billion in 2021.
Hulu
- As of 2021, Hulu boasted more than 39 million paid subscribers and a total of over 75 million subscribers in the United States.
- The platform’s ad-supported plan played a crucial role in its expansion, appealing to viewers looking for a more affordable alternative.
- In 2020, Hulu’s total revenue was around $2.8 billion.
Apple TV+
- Apple TV+ was introduced in more than 100 countries and regions at the same time in November 2019.
- Apple TV+ provided a complimentary year of service to customers who bought qualifying Apple devices.
- Although specific subscriber figures were not revealed, analysts approximated that Apple TV+ reached 34 million subscribers in its inaugural year.
- In 2021, Apple set aside approximately $6 billion for the production of original content for Apple TV+.
Spotify
- As of July 2021, Spotify boasted more than 365 million monthly active users, which encompassed both free and premium subscribers.
- The platform had surpassed 165 million premium subscribers worldwide in 2021.
- Spotify provides an extensive music library featuring over 70 million tracks and more than 4 billion playlists.
Streaming Services by Time Spent
- In 2020, global consumers, on average, dedicated more than 4.2 hours each day to watching streaming content.
- The pandemic resulted in a 16% rise in streaming duration throughout 2020.
- In the United States, adults engaged in an average of 3 hours and 46 minutes daily on digital media consumption, which includes streaming, in 2020.
- Streaming represented 27% of the total television viewing time for U.S. adults in 2020.
- In 2021, streaming services experienced a 30% growth in global streaming hours when compared to the prior year.
- The average duration of streaming video viewed on mobile devices rose by 20% in 2020.
- Streaming was responsible for 82% of the total revenues in the music industry in the U.S. in 2020.
- Among younger demographics (ages 18-34), 60% frequently engage in watching streaming content.
- The worldwide streaming audience is anticipated to exceed 1.2 billion viewers by 2024.
- In 2020, Netflix subscribers spent an average of 3 hours and 18 minutes daily on the service.
Devices Statistics by Streaming Services
- Mobile devices continue to be the preferred option for streaming, with more than 60% of users utilizing smartphones to access streaming services.
- Smart TVs have become increasingly popular, representing approximately 45% of global streaming device usage.
- Around 30% of users still favor streaming content on laptops or desktop computers.
- Tablets: The usage of tablets for streaming is about 20% of the overall streaming device usage.
- Streaming Devices: Dedicated streaming devices such as Roku, Amazon Fire TV, and Google Chromecast are employed by roughly 15% of streamers.
- Gaming consoles, including PlayStation and Xbox, account for nearly 10% of streaming device usage.
- Other connected devices, like media players and set-top boxes, constitute the remaining 5% of streaming device usage.
Streaming Services Recent Development
- In 2022, Amazon finalised its acquisition of MGM (Metro-Goldwyn-Mayer) for a total of $8.45 billion.
- At CES 2023, Amazon revealed a variety of new features for its streaming services, which include support for Matter Casting on Fire TV and Echo Show 15 devices, as well as a collaboration with Panasonic to incorporate Fire TV into Panasonic televisions.
- Paramount+ has set a goal to achieve 100 million subscribers by 2024 and intends to boost its content expenditure to $6 billion, an increase from $2 billion in 2022.
Streaming Services Future Predictions
- The worldwide streaming industry is projected to exceed a valuation of $184 billion by the year 2027, propelled by a rising demand for on-demand content.
- Live streaming is anticipated to experience considerable growth, with the live video streaming sector expected to expand at a compound annual growth rate (CAGR) of approximately 21.3% from 2021 to 2028.
Conclusion
Streaming Services Statistics: The streaming services landscape has undergone significant growth and transformation in recent years. With a consistent rise in subscriber counts, these platforms have become essential to contemporary entertainment consumption.
The intense competition among leading companies, along with the rise of niche services that cater to particular interests, has broadened the streaming market.
Moreover, the production of original content has been crucial in drawing in and keeping subscribers, thereby increasing the demand for innovative and engaging programming. Further, as the industry progresses, the ability to adapt and the creation of unique content will likely continue to be vital elements for achieving success in this dynamic and ever-evolving field.
FAQ’s
As of 2021, Netflix continued to be the leading service worldwide regarding subscriber numbers, although other platforms like Amazon Prime Video, Disney+, and HBO Max were rapidly gaining ground.
The COVID-19 pandemic resulted in a surge in subscriptions and usage of streaming services due to lockdown measures and the shutdown of cinemas. A significant number of individuals turned to digital platforms for their entertainment needs.
Millions of users are discontinuing their subscriptions to Disney+ and Hulu. As reported by the subscriber analytics company Antenna, Disney+ experienced a loss of over 3 million subscribers, while Hulu saw a decrease of 4.1 million in September 2025 alone.