
Introduction
OTT Statistics: Over-the-top (OTT) platforms have emerged as a key force in the global digital media landscape, reshaping the way audiences access and consume entertainment and information. By delivering content directly through the internet, OTT services eliminate the need for traditional cable or satellite distribution and allow users to stream on demand across smartphones, smart televisions, tablets, and other connected devices.
The widespread availability of high-speed internet, declining data costs, and the growing adoption of smart devices have fueled rapid OTT expansion across regions. OTT statistics help measure this transformation by capturing data on subscriber growth, viewing behavior, content consumption patterns, revenue models, and geographic reach.
As streaming competition intensifies and user preferences shift toward flexible, personalized viewing, OTT data insights are essential for evaluating market performance, strategic investments, and the future direction of digital media consumption.
Editor’s Choice
- Average user engagement on OTT platforms has risen sharply, with weekly streaming time now around 17 hours.
- In India, daily OTT viewing has intensified, with users spending approximately 180 minutes per day on streaming platforms.
- North America continues to dominate the OTT industry, accounting for close to 40 per cent of global OTT revenue, followed by Europe and the Asia Pacific as major contributing regions.
- Cord-cutting remains a strong trend in the United States, where nearly 59.6 million households have discontinued traditional cable subscriptions in favour of OTT-only services.
- Mobile streaming has expanded significantly, with more than 70% of viewers accessing OTT content on smartphones, particularly in emerging markets such as India and Southeast Asia.
- Netflix maintains global leadership with about 282 million paid subscribers as of 2024, while Disney+ Hotstar leads the Indian market with 35.9 million paid subscribers and nearly 26 per cent market share, ahead of Amazon Prime Video and Netflix.
- Advertising-supported OTT platforms are gaining traction, with the AVOD segment projected to reach a market value of 63 billion US dollars by 2027, reflecting diversification in revenue models.
- Global OTT penetration among internet users has reached approximately 60 per cent, highlighting the widespread shift toward on-demand digital content consumption.
- Live streaming on OTT platforms has grown by around 45% year over year, driven largely by sports broadcasts and interactive live events.
- Investment in original programming continues to accelerate, with leading OTT platforms expected to spend up to 40 billion US dollars globally on original content
- production.
(Source: Forbes, Statista, Uscreen)
OTT Streaming Usage, Revenue Outlook, and Platform Consumption Trends
- In 2024, Americans streamed an average of 21 hours per week, making OTT consumption comparable to a part-time work schedule.
- Global revenue from the OTT video market is projected to reach US$443.29 billion by 2029, reflecting sustained expansion across regions.
- Video streaming increasingly occurs through applications, with 65% of viewing time spent on mobile and smart TV apps rather than web browsers.
- Worldwide smartphone availability stands at 7.21 billion devices, with 60.42% of the global population owning a smartphone capable of running OTT apps.
- Advertising-supported OTT platforms are gaining traction, with AVOD user penetration expected to reach 52.8% in 2025 and expand further to 61% by 2029.
- Application-based viewing continues to dominate, with apps accounting for 59% of OTT consumption in 2024, up sharply from 40% in the previous year.
- Viewers consumed approximately 1.5 billion minutes of content via mobile and TV apps in 2024, nearly double the 871 million minutes watched through web platforms.
- Engagement with live streaming content is significantly higher on TV apps, where users attend 154% more live events than web viewers and 105% more than mobile users. In comparison, mobile app users attend 24% more events than website viewers.
- Content creators who launch dedicated OTT TV applications see an average earnings increase of around 30%, underscoring the monetisation advantage of app-based distribution.
(Source: Forbes, Statista, Uscreen, Bank My Cell)
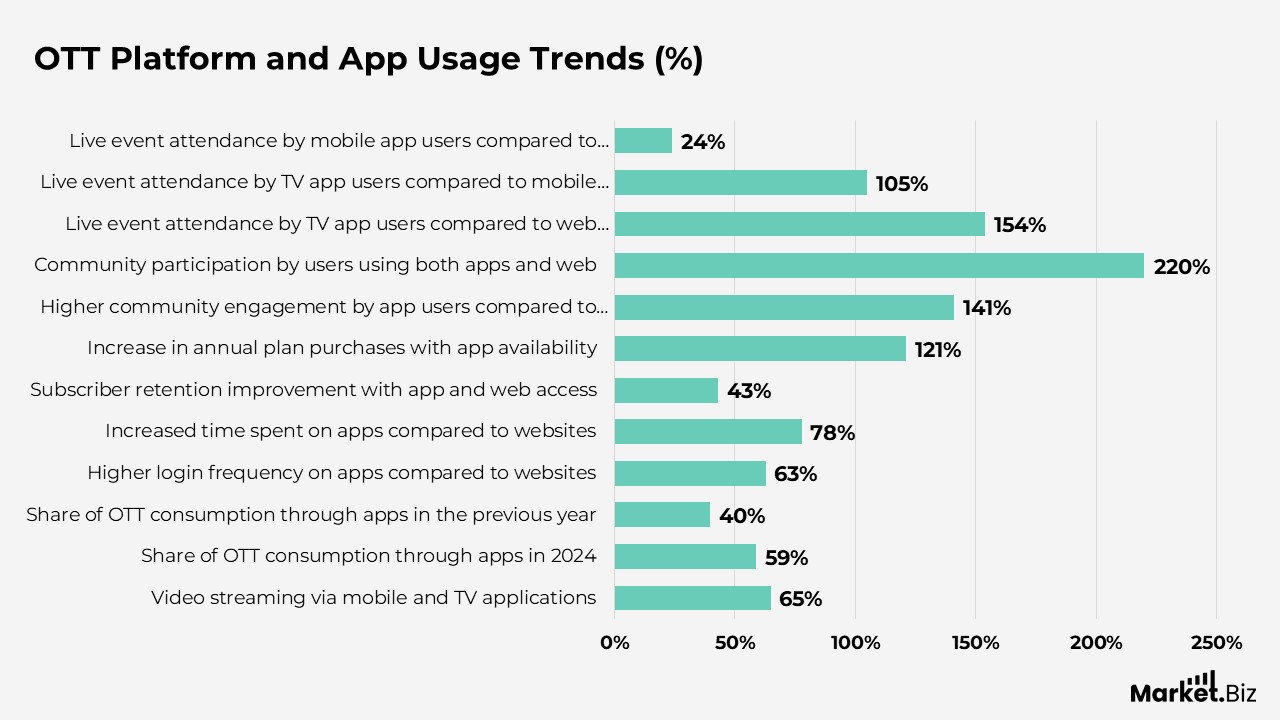
OTT Platform and App Usage Trends
- OTT app-based streaming continues to accelerate as users increasingly prioritize convenience, flexibility, and seamless access across devices.
- Viewers now expect to stream content effortlessly on smart TVs, laptops, tablets, and smartphones, driving creators to invest in multi-platform OTT apps.
- Around 65% of video streaming activity takes place through mobile and TV applications rather than web browsers.
- Applications accounted for 59% of OTT content consumption in 2024, up sharply from 40% in the previous year.
- Audiences consumed approximately 1.5 billion minutes of content via mobile and TV apps, nearly double the 871 million minutes viewed on web platforms.
- Users log into OTT apps 63% more frequently than websites and spend 78% more total time on app-based platforms.
- Platforms offering both app and web access retain subscribers up to 43% longer than platforms limited to a single access point.
- OTT platforms with app availability record 121% higher annual subscription plan purchases, reflecting a stronger long-term commitment.
- App users engage 141% more with community features than web users, while users accessing both apps and web show 220% higher community participation.
- TV app users attend 154% more live streaming events than web users and 105% more than mobile users, while mobile app users attend 24% more events than website viewers.
(Source: Uscreen, DemandSage)
OTT Advertising and Monetization Statistics
- Global OTT video advertising revenue is projected to reach US$207.22 billion in 2025, rising further to US$267.98 billion by 2029.
- The United States is expected to generate the largest share of free ad-supported streaming revenue, totalling US$5.78 billion in 2025.
- Among OTT viewers using a second screen, 65% search for product information while watching content, creating opportunities for enhanced advertiser engagement.
- Approximately 66% of Americans are willing to watch advertisements in exchange for free OTT content.
- The total number of ad-supported OTT users is projected to reach 4.9 billion by 2029.
- AVOD user penetration is forecast to rise from 52.8% in 2025 to 61% by 2029.
- Average revenue per user from OTT video advertising is expected to reach US$12.18 in 2024.
- Digital video advertising spending in the United States is projected to increase to US$112.77 billion by 2028.
- Average ad spending per internet user globally is expected to reach US$50.27 in 2025.
(Source: Statista, Video Advertising Bureau)
OTT Streaming Services Market Statistics
- Nearly 99% of US households subscribed to at least one OTT streaming service in 2024, indicating near universal adoption.
- American consumers pay for an average of 2.9 streaming subscriptions per month, reflecting multi-platform viewing behaviour.
- Netflix leads the US and Canadian markets, capturing 31% of total subscription revenue.
- Globally, Netflix remains the most popular streaming service, with over 260.28 million subscribers, followed by Amazon with 200 million.
- Around 44% of users indicated Disney+ would be the first service they would cancel if subscription prices increased, followed by Hulu at 40% and ESPN+ at 35%.
(Source: Forbes)
Creator Led OTT Platform Growth
- Creator-driven OTT platforms are gaining momentum as brands shift from ad-supported models to subscription-based ecosystems.
- Leading creator platforms collectively serve over 15 million users, have launched more than 3,500 apps, and generate approximately US$210 million in annual creator earnings.
- Creator brands that launch OTT apps report that more than 76% of viewership originates from mobile and TV applications.
- Launching OTT apps has helped creators double viewership within a year, with up to 79% of total views coming from app-based consumption.
(Source: Uscreen)
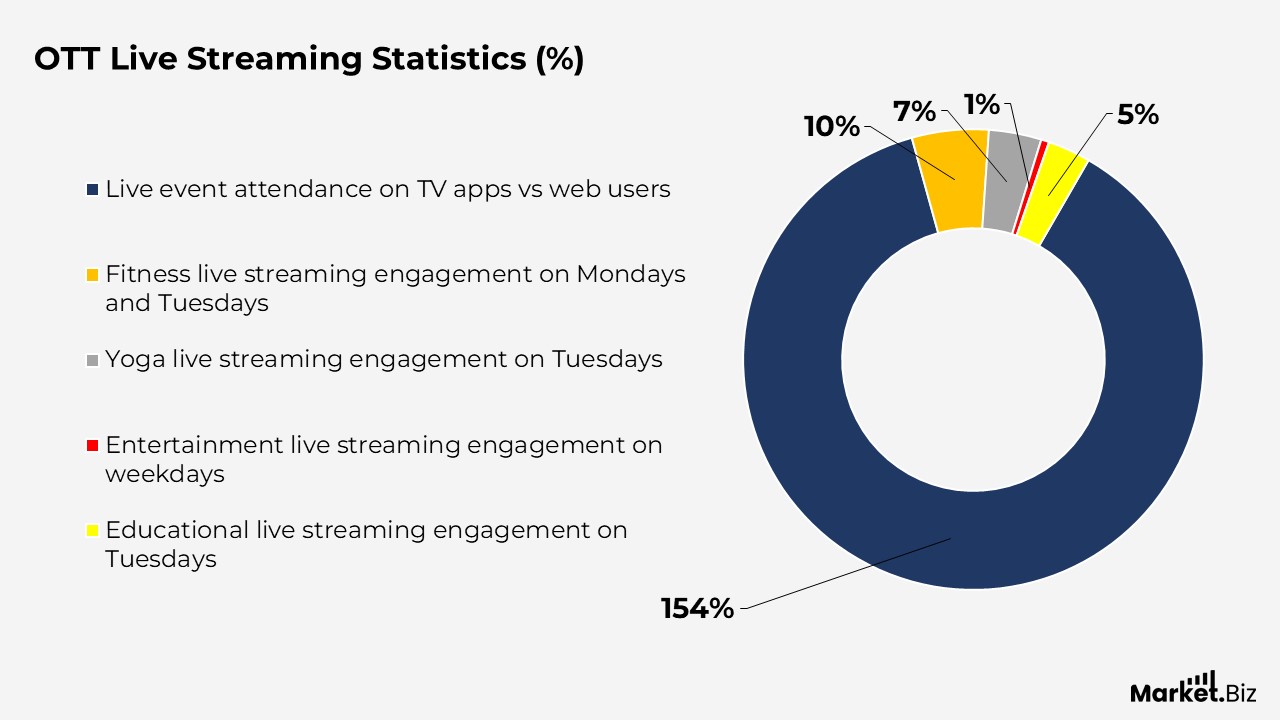
OTT Live Streaming Statistics
- Live streaming engagement is significantly higher on TV apps, with users attending 154% more live events than web users.
- Fitness live streaming sees peak engagement early in the week, with Mondays and Tuesdays recording nearly 9.5% higher viewership than average.
- Yoga content engagement peaks midweek, with Tuesday showing 6.5% higher activity than average.
- Entertainment live streaming remains consistent throughout the week, with engagement 1% to 2% higher on weekdays.
- Educational live streaming peaks midweek, reaching 5.3% above average on Tuesdays, and drops sharply on Sundays.
(Source: Uscreen, Statista)
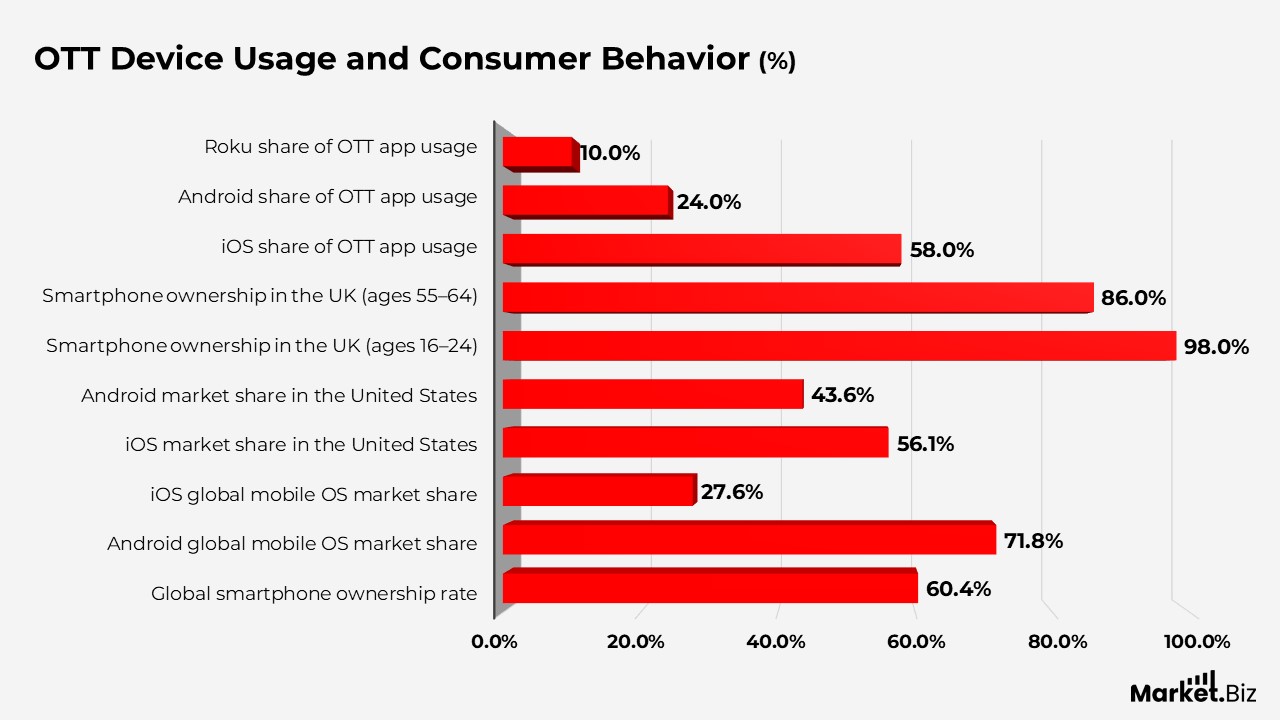
OTT Device Usage and Consumer Behavior
- Globally, 7.21 billion smartphones are capable of running OTT apps, with 60.42% of the world’s population owning one.
- Android leads the global mobile OS market with a 71.8% share, while iOS holds 27.62%.
- In the United States, iOS leads with 56.13%, while Android has grown to 43.59% market share.
- Smart TV adoption in the UK is highest among users aged 45 to 54.
- Smartphone ownership in the UK reaches 98% among ages 16 to 24, compared to 86% among ages 55 to 64.
- iOS dominates OTT app usage with 58%, followed by Android at 24% and Roku at 10%.
- Americans spend an average of 21 hours per week streaming digital content.
- Around 245.3 million Americans, representing 72.2% of the population, watch OTT video at least once per month.
- Global OTT video penetration is projected to reach 70.1% by 2029.
- Subscribers using OTT apps watch up to 25% more content and show 2x lower churn than users without apps.
- Average session watch time increases from 14 minutes to 17 minutes when OTT apps are available.
- Weekly watch time rises from 82 minutes to 102 minutes across platforms that offer apps.
- Viewer activity peaks early in the week, with Mondays and Tuesdays recording around 4.7% higher engagement than average.
(Source: Forbes, Statista, Uscreen, Bank My Cell, GlobalStats StatCounter)
Global Growth Trend of OTT Users Worldwide
- The global OTT user base expanded steadily to 3.46 billion in 2020, marking a strong foundation for digital streaming adoption.
- In 2021, the number of OTT users increased to 3.67 billion, reflecting accelerated uptake during the post-pandemic period.
- OTT platform usage continued to rise in 2022, reaching approximately 3.53 billion users worldwide.
- By 2023, global OTT users will have grown further to 3.74 billion, supported by expanding mobile and smart TV penetration.
- The total OTT user base climbed to around 3.92 billion in 2024, driven by the expansion of subscription and ad-supported streaming options.
- Growth is projected to continue in 2025, with global OTT users expected to reach 4.12 billion.
- In 2026, the worldwide OTT audience is expected to reach nearly 4.33 billion users.
- By 2027, global OTT user adoption is forecast to reach approximately 4.52 billion, highlighting sustained long-term growth in digital streaming consumption.
(Source: Statista)
AVOD User Adoption Trend Over Recent Years
- In 2022, the ad-supported video-on-demand user base stood at approximately 8.9 million, indicating early-stage adoption of free streaming models.
- AVOD usage increased significantly in 2023, reaching around 13.3 million users as more viewers shifted to ad-supported content.
- By 2024, the number of AVOD users was about 11.9 million, reflecting continued interest in free streaming despite market fluctuations.
(Source: DemandSage, Statista)
Global OTT User Penetration Growth
- In 2025, global OTT user penetration is estimated at 52.84%, indicating that more than half of internet users worldwide engage with streaming platforms.
- Penetration is expected to rise to 54.87% in 2026, supported by expanding internet access and increased smart device adoption.
- By 2027, OTT usage worldwide is projected to reach 56.90%, reflecting the steady integration of streaming into everyday media consumption.
- Global OTT penetration is forecast to grow to 58.93% in 2028, driven by mobile-first and emerging markets.
- In 2029, the share of users accessing OTT platforms is anticipated to reach 60.96%, highlighting mainstream global adoption.
- By 2030, global OTT user penetration is projected to climb further to 62.97%, underscoring the long-term shift toward on-demand digital entertainment.
(Source: DemandSage, Statista)
Conclusion
OTT statistics underscore the rapid transformation of the global media landscape, with both developed and emerging markets confirming that OTT platforms are now deeply embedded in daily entertainment habits. The data also highlights a decisive shift toward mobile and TV app-based viewing, which delivers higher engagement, longer watch durations, stronger community participation, and improved subscriber retention compared with browser-based access.
From a revenue standpoint, OTT metrics indicate expanding monetization opportunities through both subscription and advertising-supported models. Growth in AVOD adoption and the escalating digital video advertising have driven internet-driven streaming to become the primary mode of content consumption for audiences worldwide. Rising usage levels, broad household penetration, and increasing engagement
spend, and improved targeting capabilities demonstrate how OTT platforms are strengthening their value proposition for advertisers while maintaining consumer acceptance of ad-supported content. Continued investment in original programming, live streaming, and creator-driven platforms further reflects the market’s competitive intensity and the demand for differentiated content experiences.
Overall, OTT statistics offer a clear, evidence-based view of how viewing behavior, device preferences, monetization approaches, and content strategies are evolving in parallel. These insights are critical for streaming platforms, advertisers, creators, and investors aiming to refine engagement strategies, sustain subscriber growth, and capitalise on long-term opportunities within an increasingly digital and competitive media ecosystem.
FAQ’s
OTT statistics track key metrics, including subscriber growth, viewing time, content consumption patterns, device usage, revenue models, advertising spend, and regional penetration, to assess the performance and evolution of streaming platforms.
OTT statistics help platforms, advertisers, and content creators understand audience behavior, optimise monetisation strategies, evaluate market opportunities, and make data-driven decisions in a highly competitive digital media environment.
OTT statistics show that mobile phones and smart TVs account for the majority of viewing, with app-based consumption driving higher engagement and longer watch times than web browser streaming.
Data indicates rising average viewing time, increasing multi-platform usage, and strong growth in live streaming and app-based consumption, particularly in emerging markets with high smartphone adoption.
OTT statistics highlight rapid growth in advertising-supported video on demand, with increasing advertiser spend, higher user acceptance of ads, and improved targeting capabilities compared to traditional television