
Introduction
Broadcasting statistics provide a concise, data-driven overview of the structure, performance, and evolution of television, radio, and digital broadcasting ecosystems.
These statistics quantify key indicators such as audience reach, viewership, and listenership trends, advertising revenues, content consumption patterns, channel penetration, and technology adoption across terrestrial, cable, satellite, and internet-based platforms.
By translating broadcasting activities into measurable metrics, broadcasting statistics enable broadcasters to refine programming strategies, advertisers to optimize media investments, and policymakers to evaluate coverage, accessibility, and regulatory compliance.
Overall, they provide a critical analytical foundation for understanding market dynamics, audience behaviour, and the ongoing digital transformation of the global broadcasting landscape.
Editor’s Choice
- In 2023, advertising investments in linear television across the US reached nearly 61 billion USD, reflecting the continued relevance of traditional TV platforms.
- Connected TV advertising in the US is expected to exceed 30 billion USD by 2025, driven by rapid growth in streaming adoption.
- Conventional AM and FM radio maintains strong penetration, reaching about 82% of the US population aged 12 years and above every week.
- Streaming platforms overtook cable television in total viewership for the first time in the US during July 2022, marking a major shift in content consumption behavior.
- US adults spend an average of 2 hours and 55 minutes per day watching television across all formats.
- More than 70% of television households worldwide now have access to Smart TVs, supporting the expansion of digital and app-based viewing.
- 5 G-enabled broadcasting trials are currently underway in more than 10 countries to support direct-to-mobile television services.
- NextGen TV technology, based on the ATSC 3.0 standard, is now available in regions covering around 75% of US households.
- Live sports programming dominated US television viewership in 2022, accounting for 94 of the top 100 most-watched broadcasts.
- The Super Bowl continues to be the most-watched live broadcast event in the US, consistently attracting audiences of over 100 million viewers.
- Scripted television production in the US peaked in 2022, with total original series output reaching 599 titles.
- The US broadcasting landscape includes roughly 1,750 full-power commercial television stations operating nationwide.
- Radio broadcasting remains extensive, with more than 15,400 full-power radio stations active across the country.
- The broadcasting sector directly supports employment for over 280,000 professionals in the United States.
Audience and Media Consumption Patterns Across Broadcasting and Streaming
- Traditional AM and FM radio continues to show strong weekly engagement, reaching around 82% of Americans aged 12 and above.
- Streaming platforms surpassed cable television in total viewership in the US for the first time in July 2022, signalling a structural shift in viewing behaviour.
- US adults spend an average of nearly 2 hours and 55 minutes per day watching television across broadcast and digital formats.
- More than 30% of US households now identify as cord-cutters, opting out of paid cable or satellite television services.
- Gen Z audiences dedicate a greater share of their video time to non-linear formats such as streaming and social video than to traditional broadcast TV.
- Approximately 80% of US households maintain at least one paid subscription to a streaming video service.
- Despite the mobile-friendly nature of podcasts, close to 50% of listening still occurs in the home environment.
- Local news programming remains the most consistently watched content category on broadcast television stations.
- Binge viewing has become the dominant streaming behaviour, with about 73% of users preferring to watch multiple episodes in a single session.
- In the UK, around 40% of adults rely on broadcast television as their primary source of news.
Moreover
- Hispanic audiences in the US have higher-than-average radio usage compared with other demographic groups.
- Roughly 65% of sports fans continue to prefer watching live events on large screens through broadcast or cable delivery.
- Co-viewing on connected TV platforms is increasing, accounting for approximately 35% of total viewing hours.
- The median age of prime-time broadcast television viewers in the US now exceeds 60, highlighting audience ageing.
- Radio listening levels peak during the morning and evening commutes, commonly referred to as drive time.
- Audio remains a mass reach medium, with about 92% of US adults engaging with radio or streaming audio weekly.
- Fewer than 50% of US households currently subscribe to a traditional cable television bundle.
- Trust levels in local broadcast news remain strong at around 70%, exceeding trust in national cable news outlets.
- Second-screen behavior is widespread, with nearly 88% of Americans using another digital device while watching television.
- Among audiences under 35 years of age, on-demand audio consumption has overtaken linear audio listening.
(Source: Gitnux)
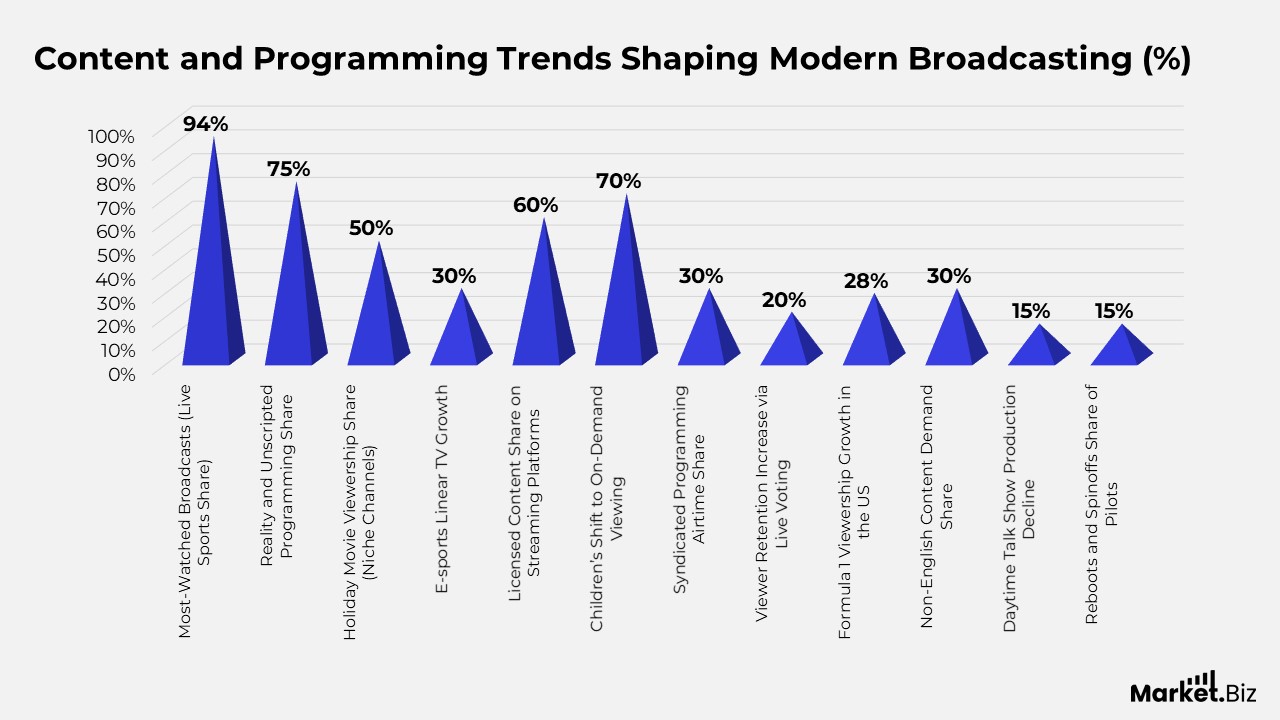
Content and Programming Trends Shaping Modern Broadcasting Statistics
- Live sports programming dominated US television in 2022, accounting for 94 of the top 100 most-watched broadcasts.
- The Super Bowl remains the largest live TV event in the US, consistently attracting more than 100 million viewers.
- Scripted television production in the US peaked in 2022, with total original series output reaching 599 titles.
- Reality and unscripted formats now represent roughly 75% of programming on discovery-driven cable networks.
- Local weather coverage is the most frequently cited reason audiences tune in to local news broadcasts.
- Global consumption of Korean dramas on streaming platforms surged by 200% between 2019 and 2022.
- Seasonal holiday movies account for over 50% of annual viewership on certain niche cable channels.
- Esports content continues to expand on traditional TV, with linear broadcast hours rising by 30% year over year.
- Licensed titles dominate major streaming catalogues, with about 60% of Netflix’s US library consisting of non-original content.
Moreover
- Production budgets for premium drama series have escalated, averaging 6–10 million USD per episode.
- Children’s viewing habits have shifted strongly toward digital formats, with nearly 70% of consumption moving from linear TV to on-demand platforms.
- Political advertising reached unprecedented levels, with broadcast TV spending totaling 4.4 billion USD during the 2022 US midterm elections.
- English Premier League domestic television rights are valued at over £5 billion for a 3-year licensing cycle.
- True crime documentaries have emerged as the most popular non-fiction genre across streaming platforms.
- Syndicated programming continues to play a key role, filling approximately 30% of broadcast station airtime.
- Interactive live voting formats increase engagement, boosting viewer retention by around 20% during live shows.
- Formula 1 viewership in the US increased by 28% following the popularity of the “Drive to Survive” series.
- Non-English-language content accounted for nearly 30% of global content demand in 2023.
- Daytime talk show production volumes declined by about 15% after 2020.
- Reboots and spinoffs accounted for roughly 15% of all broadcast pilot orders in 2023.
(Source: Gitnux, Statista)
Industry Infrastructure and Workforce Landscape
- The US broadcasting ecosystem includes approximately 1,750 full-power commercial television stations.
- Radio remains highly fragmented, with more than 15,400 full-power stations operating nationwide.
- The broadcasting sector directly employs over 280,000 people across the United States.
- Women hold approximately 28% of news director roles at US television stations.
- Broadcasting contributes an estimated 2% of global ICT-related carbon emissions.
- Minority ownership of full-power commercial TV stations in the US remains below 6%.
- Public service broadcasting remains a major employer, with the BBC supporting more than 21,000 staff members.
- Community-focused broadcasting continues to expand, with over 2,000 LPFM stations operating in the US.
- Global demand for sound stages exceeded available supply by roughly 10 million square feet in 2022.
- Labour representation remains significant, with the IBEW union representing nearly 30,000 broadcast and telecom workers.
- US spectrum incentive auctions repurposed approximately 84 MHz of broadcast spectrum.
- The average tenure of a US television station general manager is close to 5 years.
- China operates the world’s largest state-owned broadcast network, with CCTV managing 50+ channels.
- Workforce ageing poses a challenge, with around 40% of broadcast engineers expected to retire over the next decade.
- Industry consolidation has reduced the number of US cable systems to fewer than 4,000 headends.
- Remote production technologies have enabled broadcasters to cut on-site staffing by roughly 30% for live events.
- Major mergers continue to reshape the sector, with the WarnerMedia and Discovery combination valued at 43 billion USD.
- Volunteer labor underpins community radio, accounting for nearly 80% of operational staffing.
- The European Broadcasting Union represents 112 member organizations across 56 countries.
- Geostationary broadcast satellites typically operate with an average lifespan of about 15 years.
(Source: Gitnux, Statista)
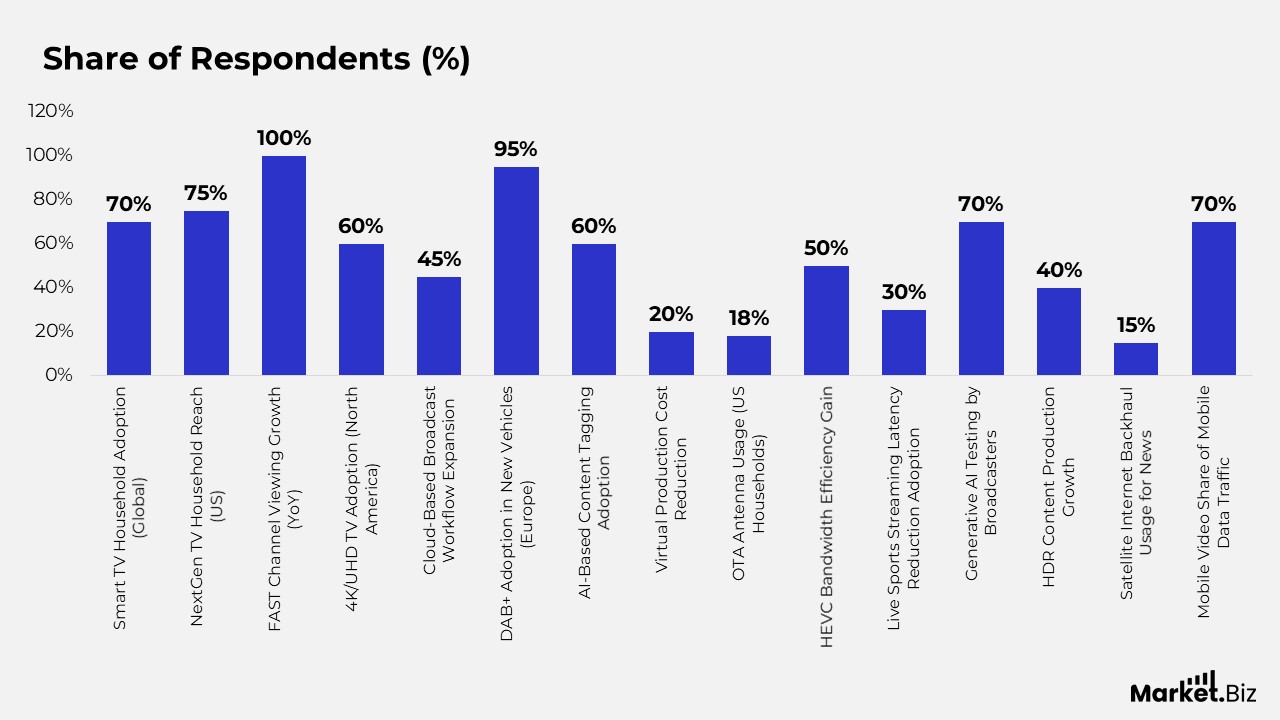
Technology and Platform Evolution in Broadcasting
- Smart TV adoption has crossed 70% of television households globally.
- 5 G-based broadcasting trials are active in more than 10 countries, supporting direct-to-mobile TV delivery.
- NextGen TV availability now reaches about 75% of US households.
- FAST channel viewing hours doubled in 2023, reflecting 100% year-over-year growth.
- 4K/UHD television adoption has reached roughly 60% saturation in North America.
- Cloud-based broadcast workflows expanded by about 45% following the pandemic.
- Digital Audio Broadcasting (DAB+) is now standard in 95% of new vehicles sold in Europe.
- AI-driven content tagging tools are used by nearly 60% of major broadcasters for archive management.
- Virtual production using LED volumes has reduced on-location filming costs by around 20%.
- OTA antenna usage has increased, with approximately 18% of US households relying on antennas.
- HEVC compression enables up to 50% bandwidth savings for 4K broadcast delivery.
- Addressable TV advertising technology is deployed across about 60 million US households.
- Roughly 30% of providers have reduced live sports streaming latency to under 5 seconds.
- The software-defined radio market is expanding at an 8.5% CAGR.
- Global IPTV subscriptions surpassed 400 million in 2023.
- Around 70% of broadcasters are actively testing generative AI for scripting or content summarization.
- HDR content production increased by nearly 40% across major streaming platforms.
- Hybrid Broadcast Broadband TV technology is deployed in 35 countries worldwide.
- Satellite internet systems now support backhaul for about 15% of remote news broadcasts.
- Mobile video accounts for nearly 70% of global mobile data traffic.
(Source: Gitnux, Statista)
Broadcasting and Digital Video Adoption Trends Worldwide Statistics
- The average daily television viewing time across global audiences is roughly 3.7 hours per person.
- Cable television maintained a large subscriber base in the US, with total subscriptions exceeding 120 million in 2022.
- Worldwide satellite television services generated revenues of around 44 billion USD during 2022.
- Streaming platforms represented approximately 28% of total global television viewing hours in 2023.
- Pay TV adoption in Europe remained significant, with nearly 73 million households subscribed in 2022.
- The global audience for digital video content surpassed 2 billion viewers in 2023, reflecting rapid growth in online video.
- Streaming platforms in North America reported an average revenue per user of about 42 USD in 2023.
- Podcast listening continues to scale in the US, reaching more than 120 million listeners per month.
- Short-form video consumption dominates mobile viewing habits, with nearly 80% of consumers favouring mobile-first formats.
- The installed base of internet-connected televisions worldwide is expected to reach approximately 1.4 billion units by 2025.
- Digital video advertising investment in North America exceeded 40 billion USD in 2023, highlighting strong advertiser demand for online video channels.
(Source: Gitnux, Statista)
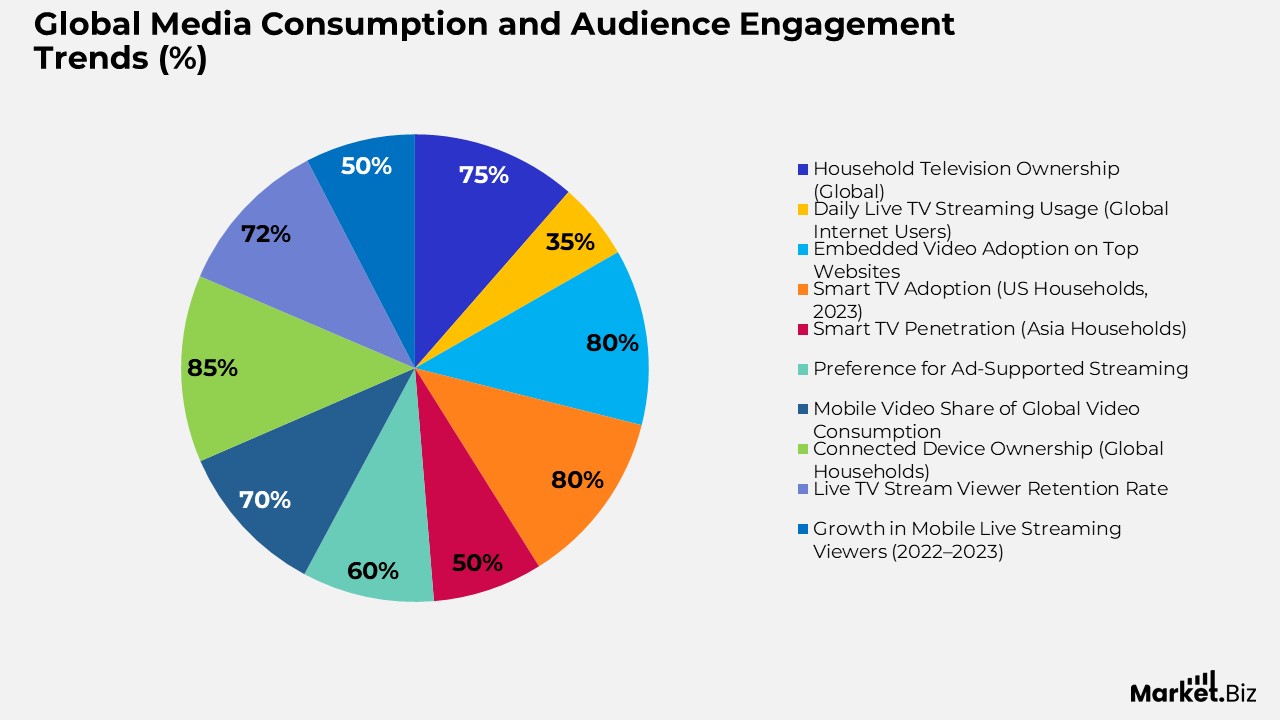
Media Consumption and Audience Engagement Trends
- More than 75% of households worldwide own at least one television, reinforcing TV’s continued global penetration.
- Radio audiences in the US skew older, with the average listener age around 53.
- Around 35% of global internet users watch live television streams daily.
- Embedded video has become standard across the web, with more than 80% of the world’s top 1,000 websites featuring video content.
- Podcast formats favour longer listening sessions, with the average episode running about 43 minutes.
- Smart TV adoption in the US exceeded 80% of households in 2023, supporting app-based viewing growth.
- Twitch users averaged approximately 10.5 hours per week of streamed content consumption in 2023.
- Smart television penetration continues to rise in Asia, with over 50% of households owning at least one device.
- Ad-supported streaming models are gaining favor, with more than 60% of media consumers preferring them over paid-only subscriptions.
- Mobile video now accounts for nearly 70% of global video consumption as of 2023.
- Daily digital media engagement worldwide averages roughly 6 hours and 59 minutes per user.
- Connected devices are nearly ubiquitous, with over 85% of households globally owning at least one broadcasting-capable device.
- Live TV streams maintain strong audience loyalty, delivering an average viewer retention rate of about 72%.
- Mobile live streaming audiences expanded rapidly, increasing by approximately 50% between 2022 and 2023.
- Radio remains a daily habit in Australia, with listeners spending around 2 hours and 20 minutes per day tuned in.
(Source: Gitnux, Statista, Zipdo)
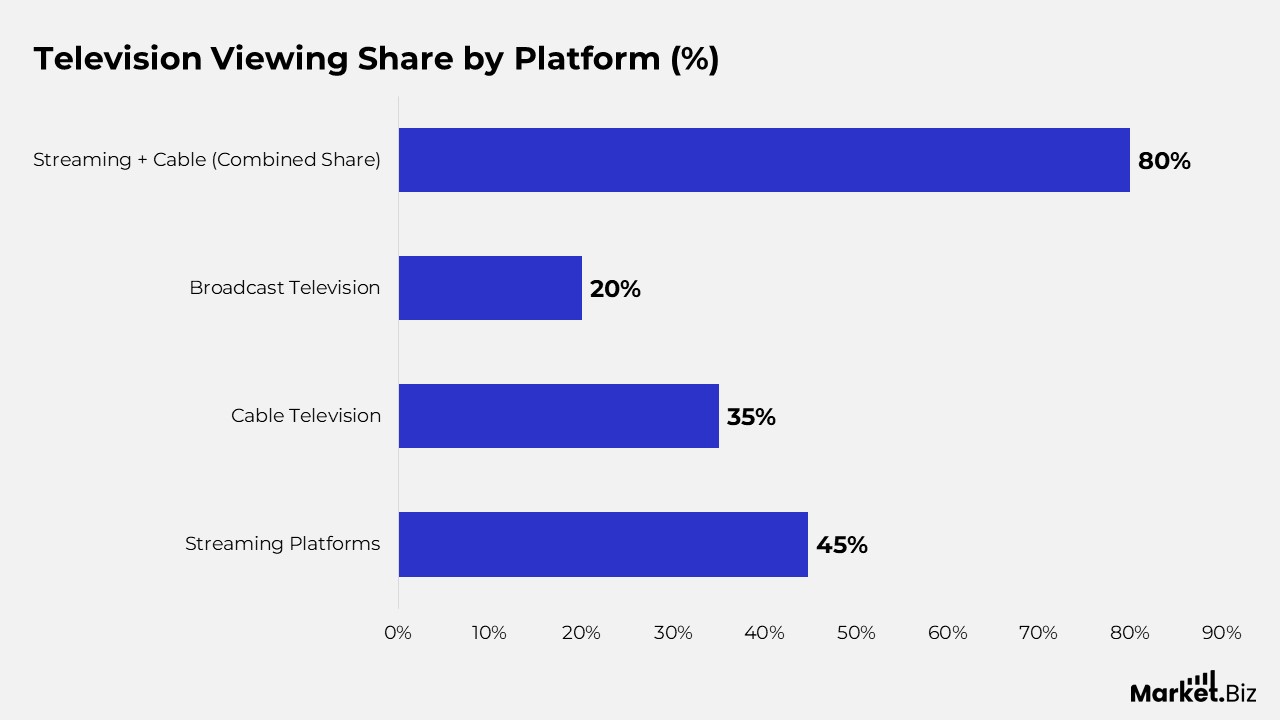
Television Viewing Share by Platform
- In May 2025, streaming platforms captured the largest share of TV viewing, accounting for 44.8% of total audience time.
- Cable television remained a significant viewing medium, representing 35.1% of overall TV consumption.
- Traditional broadcast TV accounted for 20.1% of total viewing share, reflecting continued but reduced reliance on digital formats.
- The combined share of streaming and cable reached nearly 80%, highlighting the dominance of subscription- and internet-enabled television delivery.
- Broadcast television’s smaller share indicates ongoing audience migration toward on-demand and multichannel viewing options.
(Source: Amra & Elma)
Conclusion
Broadcasting statistics indicate that the industry is evolving gradually rather than declining. Traditional broadcast television and radio continue to maintain strong relevance by delivering mass reach, high trust levels, and real-time engagement, especially for live sports, news, and major national events.
Simultaneously, the rapid expansion of streaming, connected TV, mobile video, and on-demand audio has fundamentally altered audience behavior, shifting consumption toward digital-first, flexible, and personalized viewing experiences. Revenue and advertising models are adapting to this shift, with continued growth in CTV, AVOD, podcasts, and digital video helping to offset slowing momentum in linear TV and pay TV.
Technological progress, such as rising Smart TV adoption, NextGen TV deployment, cloud-based production, AI-enabled workflows, and emerging 5G broadcasting capabilities, is further reshaping content delivery and operational models.
Overall, broadcasting statistics reflect a converged media environment where traditional and digital platforms coexist, underscoring the need for data-driven, cross-platform strategies to ensure long-term competitiveness, audience relevance, and industry sustainability.
FAQ’s
Broadcasting statistics are systematic measurements used to describe, analyze, and interpret the scale, structure, and functioning of broadcast and digital media systems. They translate broadcasting activities into numerical indicators that reflect audience reach, consumption behavior, economic value, and technological penetration.
The primary theoretical purpose of broadcasting statistics is to explain how media systems interact with audiences, markets, and institutions. These statistics support media theory by quantifying communication reach, agenda-setting influence, cultural diffusion, and shifts in media consumption patterns over time.
Broadcasting statistics typically examine multiple dimensions, including audience behavior, content distribution, economic performance, technological adoption, and institutional structure. Together, these dimensions provide a holistic framework for understanding media ecosystems.
Broadcasting statistics provide empirical evidence for media consumption theories such as uses and gratifications, media displacement, and audience fragmentation. They help validate how audiences allocate time across platforms and why certain media formats retain or lose relevance.