
Introduction
X Advertising Statistics: As the platform’s algorithms and user behavior continue to grow, brands are increasingly looking for data-driven insights to improve their campaigns and get more return on investment (ROI). The click-through rate (CTR) and overall marketing effectiveness are important for anyone aiming to make informed investments in X in 2025.
By advertising on X, one can potentially reach up to 8% of the global population, a figure that increases to 11.6% when considering internet users. Within the adult demographic (i.e., those aged 18 and older), the reach of advertisements to males is slightly higher than that to females by 4.5%. This information indicates to marketers that campaigns targeting a male audience are likely to yield more conversions on X compared to those aimed at females.
Editor’s Choice
- X has 528.3 million active users each month who encounter X advertisements upon logging in.
- Global ad X engagement on X has risen by 35% year, improving its appeal for brands.
- X is projected to represent 0.2% of digital ad spending in 2025.
- As of July 2025, approximately 4.3 billion visits were documented, with 51.76% occurring on mobile devices.
- Roughly 66.37% of visits are attributed to direct traffic, which corresponds to 2.9 billion hits.
- Every day, 70,000 new users join communities on X.
- Daily, 150,000 long-form posts are published on X, generating more than 3 billion impressions for its users.
- Advertising constituted 75% of X’s revenue in 2023.
- Impressions on X rose by 20% from October to November 2023.
- Over 100 million X users view vertical videos daily to stay informed about current events.
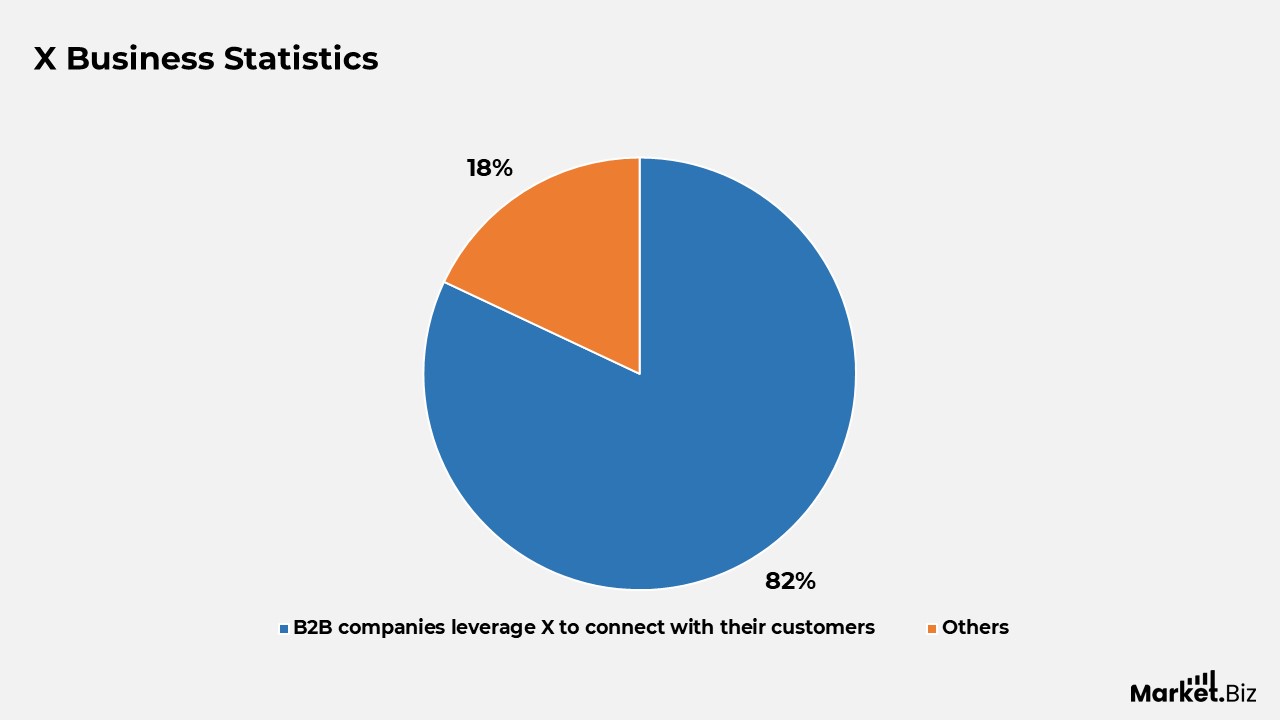
- 82% of B2B companies leverage X to connect with their customers.
- The “First View” feature on X improves video viewing duration by 1.4 times.
General X Advertising Statistics
- X has 528.3 million active users each month who encounter X advertisements upon logging in.
- People dedicate 26% more time to viewing ads on Twitter in comparison to other social media platforms, which explains why numerous brands opt to advertise here.
- Over 100 million users engage with vertical videos on X daily, with vertical videos constituting 20% of usage on specific days. If you are promoting on X, vertical video ads are essential.
- Approximately 15% of businesses allocate less than $100 for X ads, while more than 10% invest over $10,000 each month.
- Global ad engagement on X has risen by 35% year, improving its appeal for brands.
- On average, X ads range in cost from $0.26 to $1.50 for each early action on promoted posts, posts you have previously shared that receive additional visibility as ads.
- Promoted accounts experience costs between $0 and $4 per new follower, as reported by 61% of respondents. These ads present your content to users who do not yet follow you.
- On average, businesses designate 6% to 30% of their total ad budget for X ads. This allocation is contingent upon your specific requirements and the returns you observe from your campaigns.
- X maintains an average click-through rate (CTR) of 0.86%, according to EasyInsights.
- 60% of companies express satisfaction with the return on investment (ROI) from their X ad campaigns.
- Nearly 6% of the global population (aged 13 and older) can be reached through Twitter ads.
- Vertical video ads on X achieve a 7x higher engagement rate than home timeline ads.
- X is projected to represent 0.2% of digital ad spending in 2025.
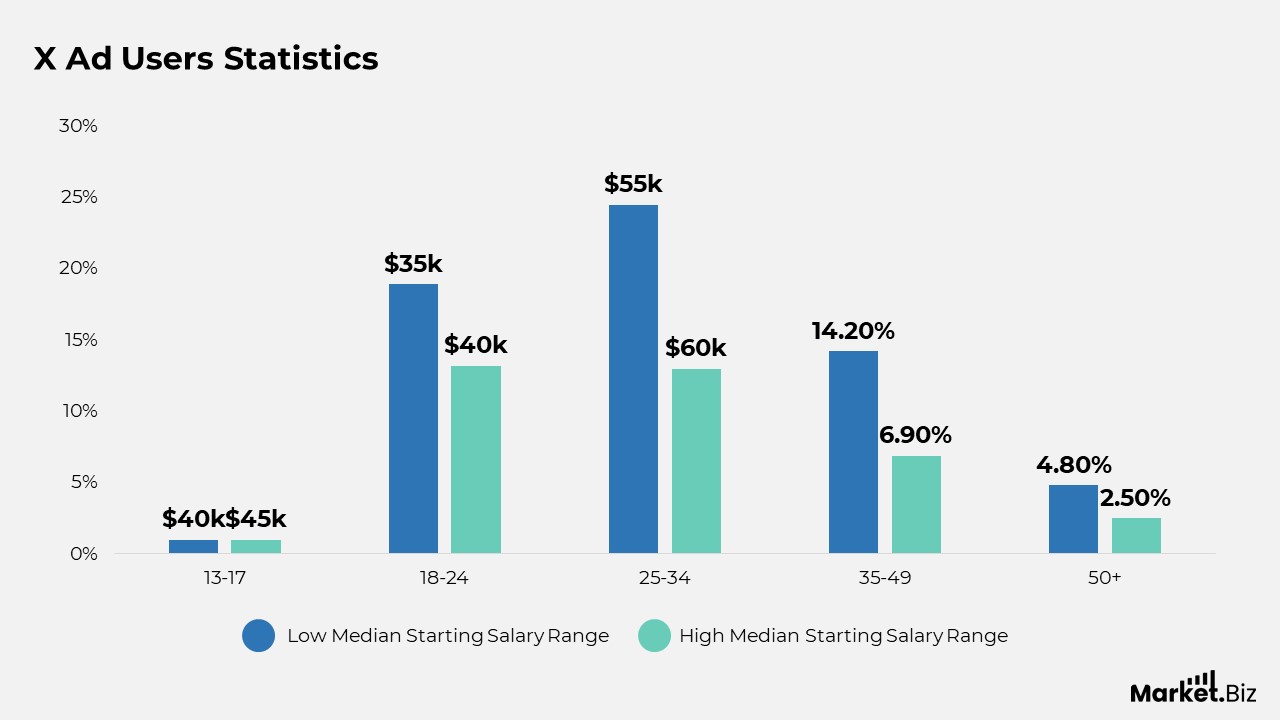
X Advertising Users Statistics
- Female users between the ages of 13 and 17 represented 1% of X’s worldwide advertising audience.
- Male users within the same age range accounted for 1% of X’s global advertising audience.
- Female users aged 18 to 24 made up 13.2% of X’s global advertising audience.
- Male users in the 18 to 24 age group constituted 18.9% of X’s worldwide advertising audience.
- Female users aged 25 to 34 represented 13% of X’s global advertising audience.
- Male users in the 25 to 34 age bracket accounted for 24.5% of X’s global advertising audience.
- Female users aged 35 to 49 comprised 6.9% of X’s global advertising audience.
- Male users aged 35 to 49 made up 14.2% of X’s worldwide advertising audience.
- Female users aged 50 and older accounted for 2.5% of X’s global advertising audience.
- Male users aged 50 and older represented 4.8% of X’s global advertising audience.
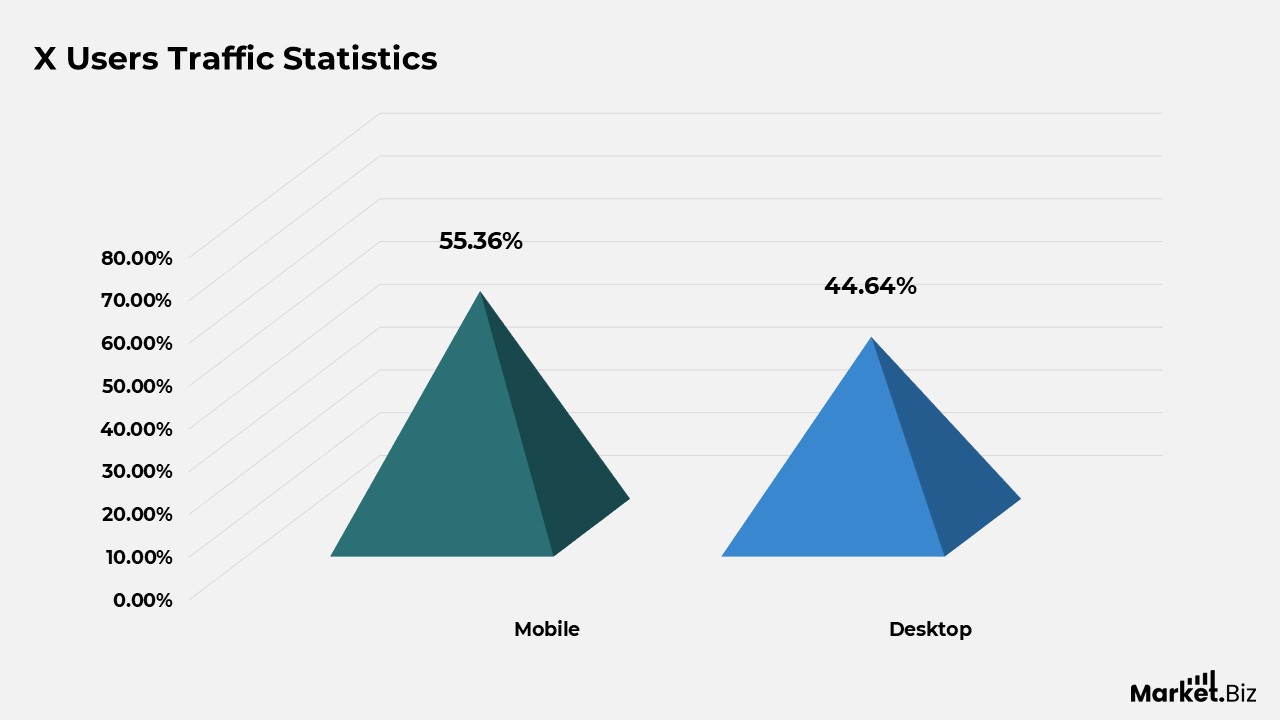
X Users Traffic Statistics
- As of July 2025, approximately 4.3 billion visits were documented, with 51.76% occurring on mobile devices.
- In February 2025, this number increased to 4.83 billion, rising from 4.78 billion the previous month.
- There were 2.67 billion visits recorded through mobile, representing 55.36%, while desktop visits accounted for 2.16 billion, or 44.64%.
- Roughly 66.37% of visits are attributed to direct traffic, which corresponds to 2.9 billion hits.
- Overall, X has around 951 million unique visitors each month, reflecting a decrease of 2.11% compared to January 2025.
Statistics of X User Behaviour Facts
- 10% of users on X in the United States contribute to 92% of the tweets on the platform, indicating that certain users are exceptionally active on the site.
- A study revealed that 48% of X users access the platform for news, while another 48% do so for entertainment, and 34% visit to connect with family and friends.
- Additionally, 33% of users use the site to follow brands, 14% engage with X to improve their professional networks, and 12% use the platform for various other reasons.
- Daily, approximately 500 million tweets are sent on X.
- Furthermore, 96% of X users indicate that they check the platform at least once a month, 84% do so weekly, and 52% check it daily.
- Americans dedicate around 34 minutes each day to using the platform.
- It is noteworthy that 80% of X usage occurs on mobile devices.
- Every day, 70,000 new users join communities on X.
- As of 2024, X has over 750 premium content creators.
- Daily, 150,000 long-form posts are published on X, generating more than 3 billion impressions for its users.
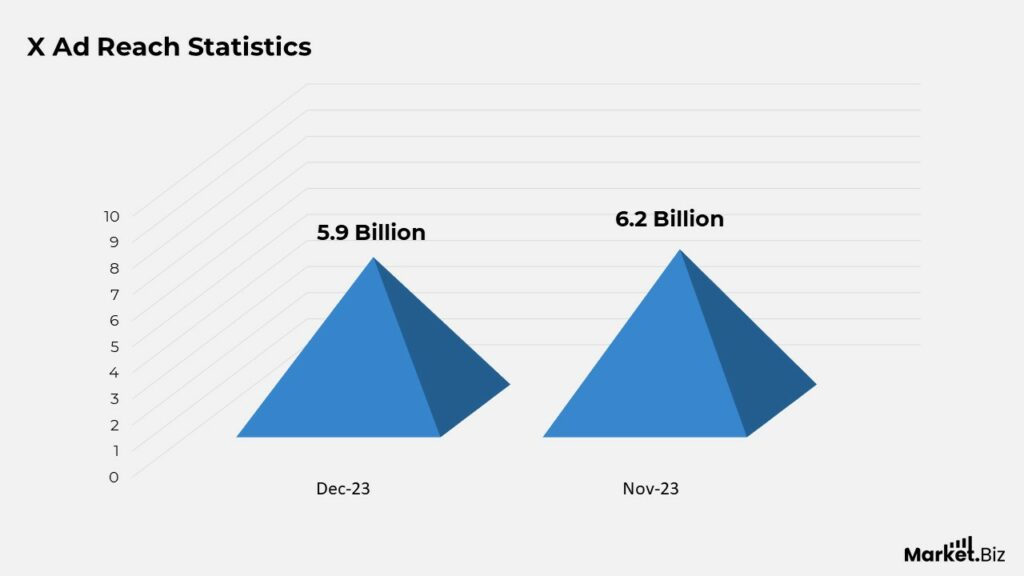
X Advertising Reach Statistics
- As of early 2024, X has 429 million users globally. This statistic underscores the platform’s extensive international presence. Businesses such as yours have a significant opportunity to engage with a broad and varied audience.
- X Premium, a feature that allows users to edit tweets and apply for a verified blue checkmark, had approximately 640,000 subscribers as of April 2023.
- In the last reported quarter of 2022, X recorded 237.8 million monetizable daily active users (mDAU), an increase from 229 million in the preceding quarter.
- In 2022, X generated $4.73 billion in advertising revenue. This strong ad income indicates that the platform remains a valuable venue for advertisers, despite the modifications to the app and website in recent years.
- American adults allocated an average of 34 minutes per day to X in 2023, positioning it as the third most used platform.
- X.com experienced 6.2 billion global site visits in December 2023, rising from 5.9 billion in November.
- The United States represents only 15% of X’s user base but accounts for over 50% of its revenue.
- Advertising constituted 75% of X’s revenue in 2023.
- The time spent on X increased by 12.5% each year, with users dedicating an average of 30.9 minutes daily. As users invest more time on the platform, brands have enhanced opportunities to connect with them through content and advertisements.
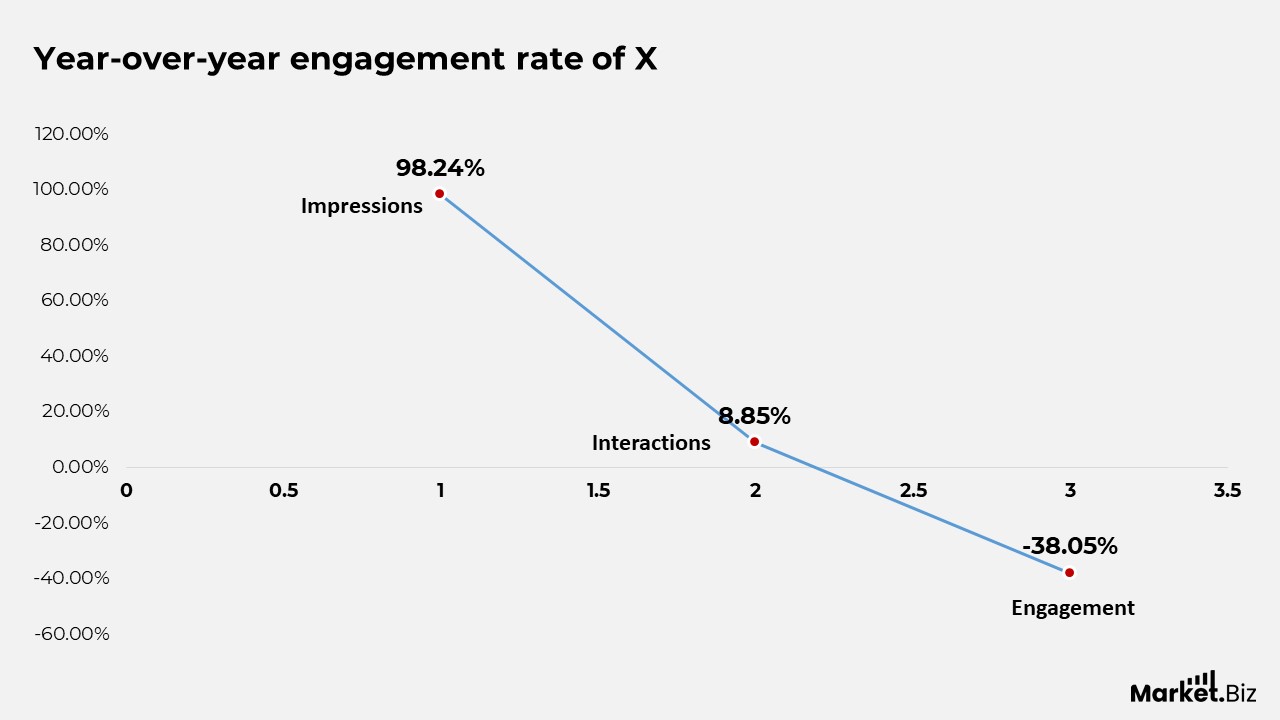
Engagement Rate X Advertising Statistics
- Engagement rates on X experienced a decline of approximately 20% in 2024, indicative of the ongoing transformations on the platform.
- The average engagement rate per tweet (per follower) across various industries stands at 0.029%.
- For every dollar invested in X ad campaigns, there is an average return of $2.70, which is nearly 40% greater than the average return from other media investments.
- Product-centric campaigns on X realized a short-term sales ROI of nearly $2, in contrast to about 30 cents for campaigns that focused exclusively on branding. To improve immediate sales, product-centric advertisements can yield significantly superior returns, highlighting X’s capability to convert interest into purchases.
- Users of X are 32% more likely to be the first to try new products, 24% more willing to share product recommendations, and 39% more inclined to buy advertised products compared to non-users of X.
- Impressions on X rose by 20% from October to November 2023.
- Mentions of last-minute shopping increased by 49% each year in 2023.
- School-related subjects are particularly relevant on X, where there are 1.5 times more active users who are students compared to other platforms. Furthermore, 39% of X’s users are parents with children.
- X users are 38% more likely than non-users to download an app immediately after viewing an online advertisement. Given X’s mobile users, app install campaigns represent an effective strategy to engage users and significantly increase downloads.
- In 2023, X advertisements reached over 660 million users monthly. This indicates that X’s ad reach expanded by over 1 million accounts each day, or approximately 13 new accounts every second.
X Advertising Format Statistics
- Using three or more advertising formats can improve campaign visibility by 20% and raise purchase intent by 7%. This strategy can assist in crafting a more immersive experience for users, resulting in increased brand recognition and a higher probability of them taking action, such as making a purchase.
- Almost 100% of X users appreciate visual content, underscoring the importance of developing striking advertisements that effectively highlight your product or primary message.
- Video advertisements featuring a prominent logo yield a 30% increase in brand recall without prompting.
- Currently, video constitutes over 80% of all X user sessions, with video views expanding at an average annual rate of 35%.
- As video consumption increases, it is important to prioritize the creation of video content to remain relevant and capture users’ attention in a format they are increasingly engaging with.
- Over 100 million X users view vertical videos daily to stay informed about current events.
Moreover
- Vertical videos account for more than 20% of the platform’s total usage.
- X users are seven times more inclined to interact with vertical video advertisements by following, reposting, liking, or clicking on links, in comparison to the same advertisement on their timeline.
- This is attributed to the fact that vertical videos are better suited for mobile screens, improving engagement and promoting greater interaction with your advertisement.
- Vertical video advertisements offer approximately 10% more visibility on X than those displayed solely on the Home Timeline, presenting a cost-effective solution if you are already using vertical video across other channels.
- Promoted Video advertisements on X can generate up to 20% more sales compared to alternative ad formats.
- Daily video views have surged by 29% from 2023 to 2024. The popularity of video content on X is on the rise, indicating that now is an opportune moment to invest in video advertisements to leverage this expanding trend.
X Advertising Facts Statistics
- Users dedicate 26% more time to viewing advertisements on X compared to any other social media platform.
- 85% of small and medium-sized enterprises using X for their marketing efforts consider the platform essential to their online strategy.
- 82% of B2B companies leverage X to connect with their customers.
- Around 10% of influencer marketing campaigns incorporate X as one of their strategies.
- 79% of users on X follow brands to stay updated with their posts.
- X is regarded as the leading platform for brand engagement.
- Organizations expecting advertising on Twitter should note that the platform’s brand safety score surpasses 99%.
- In 2024, 68% of X’s revenue was generated from advertising sales.
- Users on X are more inclined to be early adopters of new products in comparison to other social media platforms.
- 93% of X users are receptive to brands participating in various community issues.
- X experienced a 63% rise in users engaging with branded content on the platform during the latter half of 2023.
- The platform also witnessed an increase in overall ad engagements in 2024.
- Over 1,700 advertisers have returned to X in recent months, including 90 of the top 100 advertisers from the previous year.
- X advertisements achieve a 0.5% click-through rate for every 1,000 impressions.
Statistics of X Business
- Businesses use X (Twitter) to disseminate new content, advertise their offerings, and interact with their intended audience.
- X (Twitter) ranks as the second most favored organic social media platform for B2B marketers, with 82% of them using it, trailing only LinkedIn, which stands at 96%.
- Brands receive significant visibility on X (Twitter), as 79% of users follow at least one brand. The platform is primarily employed for keeping up-to-date news, although many users also conduct brand research there.
- On a global scale, among users aged 16-64, 60.6% use Twitter to stay informed about news and current events, 34.9% for researching brands and products, and merely 27% for posting or sharing media.
- Regarding brand safety, X (Twitter) excels, having an average safety score that surpasses 99% and brand suitability scores exceeding 97% when appropriate controls are implemented.
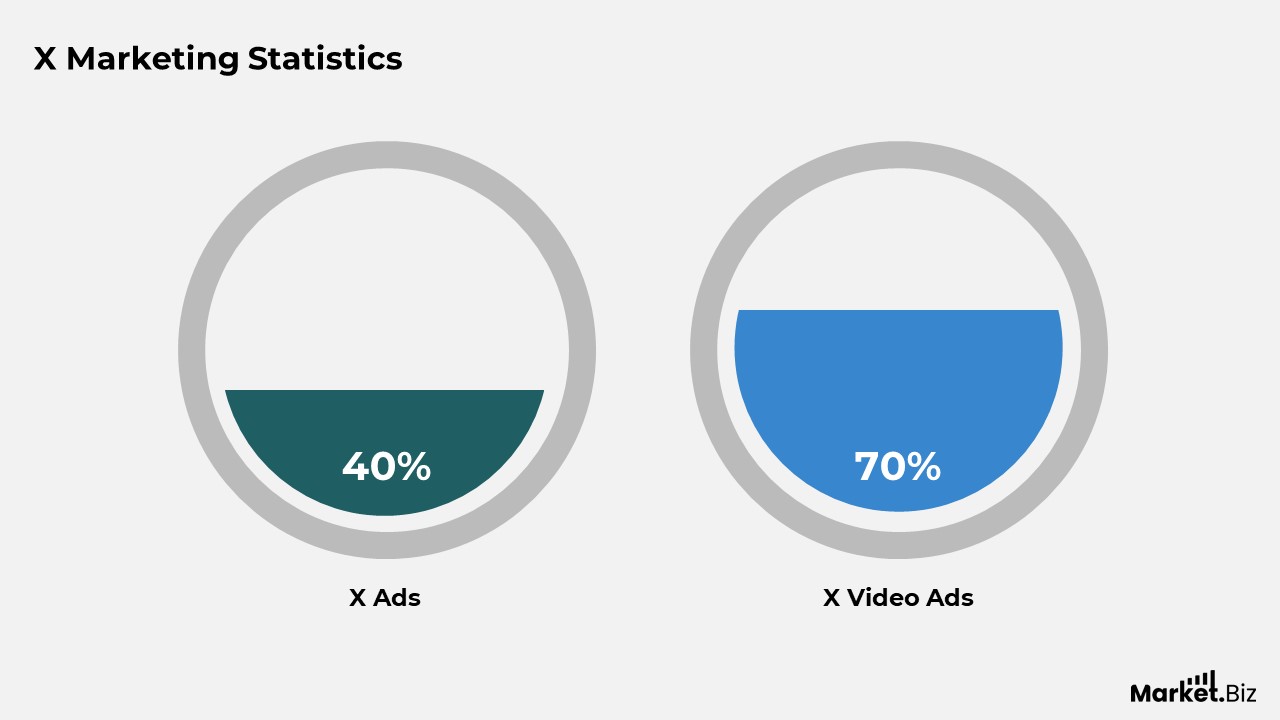
X Marketing Statistics
- Ads on X are viewed nearly three times more frequently by men compared to women.
- Users can post up to 2,400 tweets daily.
- The duration of ad viewing on X is 26% greater than that on other social media platforms.
- X provides the most cost-effective cost-per-mile (CPM) when compared to other leading platforms, realizing a 75% decrease.
- The “First View” feature on X improves video viewing duration by 1.4 times.
- For X Ads, the return on investment exceeds that of other channels by 40%.
- For video ads, the cost-per-engagement (CPE) has fallen by 50%.
- Advertisers have witnessed an 89% increase in video completion rates.
Conclusion
X Advertising Statistics: Taking into account all the said details, it can be confidently stated that Twitter reigns supreme among social media platforms in 2025. The user base is truly remarkable, and the engagement statistics continue to rise annually. Furthermore, we are witnessing billions of tweets generated each day, alongside advertising revenue that is exceptionally high.
Therefore, whether you are a business aiming to improve your strategy and extend your audience or a casual user curious about the latest trends and happenings, X is indeed the platform to keep an eye on in 2025 and the years to come.
FAQs
X has established itself as a crucial platform for businesses looking to connect with a global audience. As users dedicate more time to the platform and engage more thoroughly with content, X remains an essential resource for advertisers striving to maintain relevance in a progressively competitive landscape.
X (previously known as Twitter) does not have a fixed rate for 1,000 views. The earnings are contingent upon the ad revenue generated from Twitter ads displayed in response to your tweets. Some creators have reported earning a few dollars for every 1,000 impressions, although this can fluctuate based on various factors such as engagement levels and the type of audience.
Typically, advertising on X costs between $101 and $500 per month, according to 53% of respondents. Nevertheless, monthly expenses can differ significantly based on numerous factors, including your advertising budget, type of bid, level of competition, industry, and additional considerations.