
Introduction
X Engagement Statistics: In 2025, engagement on X continues to be an important part of social media strategy for both brands and individuals. Despite the recent modifications to the app, it is important to realize how engagement is defined, optimized, and measured.
Engagement that includes user interactions such as retweets, likes, shares, comments, and clicks on hashtags or links. These interactions serve as important indicators of how effectively your content connects with your audience, influencing visibility and follower growth.
Let’s explore the specifics of engagement on X, including ways to calculate strategies to improve your brand’s visibility, average metrics for 2025, and engagement rates on the platform. In 2024, average engagement rates on X have shown a decline across various metrics.
For instance, the average number of likes per post fell from 37.82 in 2023 to 31.46 in 2024. Likewise, mentions and reposts have also experienced a decrease each year, with the average post gathering 1.56 likes and 8.47 mentions.
Editor’s Choice
- X has seen a 35% increase in global ad engagement each year. According to reports, among B2B marketers, 82% of them use X.
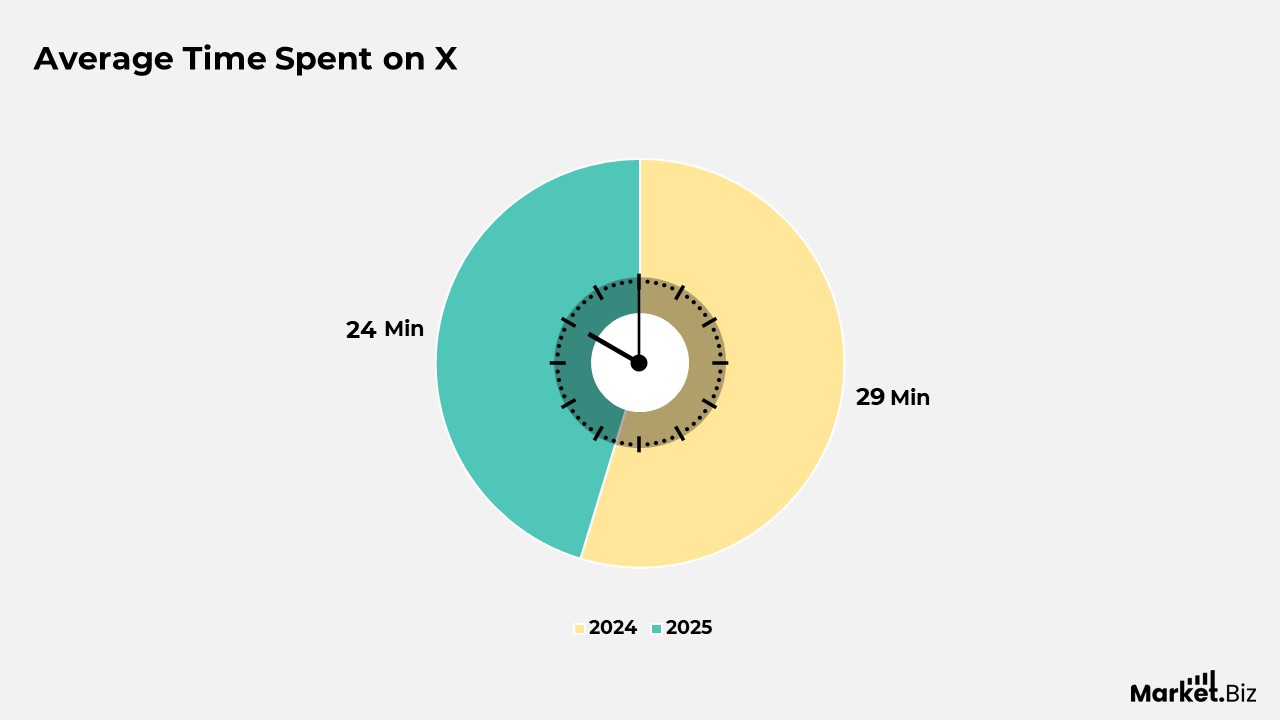
- As of 2025, the typical user dedicates 29 minutes each day to Twitter, an increase from 24 minutes in 2024.
- Users in the U.S. spend a bit more time on the platform, averaging 31 minutes daily, in contrast to the global average.
- The average engagement rate across various industries is 0.029% per tweet.
- Since 2024, partnerships with influencers on X have increased by 28%.
- Tweets containing videos experience 10 times more shares than posts that consist solely of text.
- Tweets that are under 100 characters achieve 17% higher engagement rates than their longer counterparts.
- As of April 2025, the total number of X Blue subscribers worldwide stands at 3.6 million.
- An impressive 80% of user sessions are dedicated to watching videos, making them one of the most favored options.
- In 2025, X will continue to promote tweets that attract significant interaction and are recent, highlighting the significance of posting frequency.
General X Engagement Statistics
- X has seen a 35% increase in global ad engagement each year. According to reports, among B2B marketers, 82% of them use X.
- Among brands, 79% of users engage with them on the X platform.
- X generates 61 posts in one week, attaining impressions of up to 2,121 for each post.
- The average rate of organic engagement for the entertainment and media sector stands at 1.7%.
- The lowest engagement rate recorded is 0.9% for retail in consumer goods, marketing agencies, and the real estate sector.
- The average engagement rate for each tweet stands at 0.029%. The cumulative engagement rate across all sectors is 2.8%.
- To achieve minimal engagement, the ideal frequency of posts per week is 6. The optimal time for posting on X is on Tuesday between 3 am and 6 am.
- Retweets constitute 50% of all interactions on the platform. Approximately 9.9% of influencer campaigns use X.
- About 1% of tweets reach the maximum character limit. Users have the capability to post up to 2.4k times each day.
X Engagement Calculating Process Statistics
- Likes and Retweets: These represent the most prominent forms of engagement, signifying that users value or wish to disseminate your content among their followers.
- Replies: Comments or responses to tweets demonstrate a higher level of engagement, as users invest time to interact directly with the content.
- Clicks and Shares: This category includes sharing the content on various platforms or clicking on embedded hashtags, links, or media present within the tweet.
X Hashtags by Engagement Rate
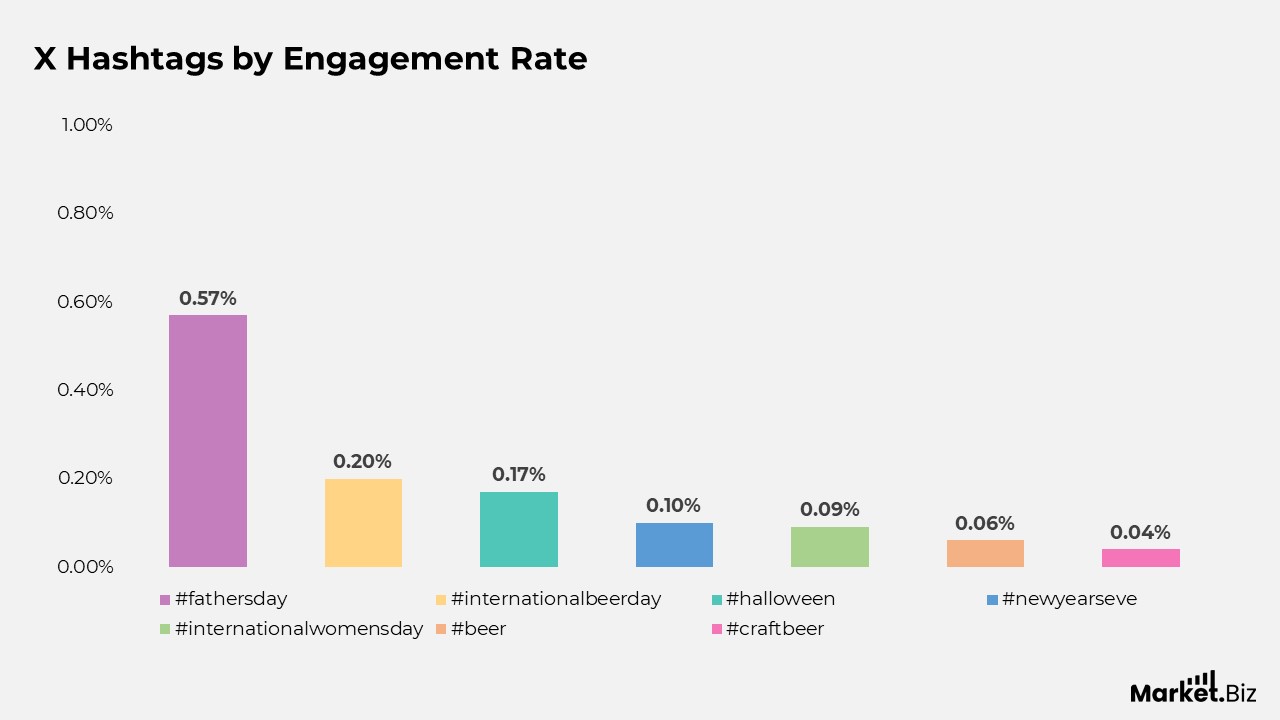
- The hashtag #fathersday leads with an engagement rate of 0.57%, establishing it as the most effective hashtag used by alcohol brands on X.
- In second place, #internationalbeerday achieves a 0.20% engagement rate, demonstrating robust audience interaction during beer-related celebrations.
- Following closely, #halloween records a 0.17% engagement rate, which suggests that seasonal campaigns effectively foster significant engagement.
- The hashtag #newyearseve obtains a 0.10% engagement rate, indicating a reasonable level of engagement associated with festive alcohol promotions.
- Both #internationalwomensday and #valentinesday show a 0.09% engagement rate, underscoring a moderate level of success for campaigns that resonate with these specific occasions.
- The hashtag #beer has a 0.06% engagement rate, which is lower than expected for a general keyword, potentially due to market saturation.
- Lastly, #craftbeer draws a 0.04% engagement rate, implying a niche appeal but a lower level of overall interaction.
Average Time Spent on X
- As of 2025, the typical user dedicates 29 minutes each day to X, an increase from 24 minutes in 2024.
- Power users, defined as the top 10% in terms of activity, spend almost 58 minutes daily on the platform.
- For Gen Z users, the average time spent is even higher at 34 minutes per day.
- Users in the U.S. spend a bit more time on the platform, averaging 31 minutes daily, in contrast to the global average.
- The time spent on Twitter reaches its peak during commuting hours (8–9 a.m. and 5–6 p.m.), indicating a preference for mobile usage.
- More than 68% of users check Twitter several times throughout the day.
- Desktop users generally have shorter sessions but view more tweets per visit compared to mobile users.
- Twitter Spaces has contributed to an increase in session duration by an average of 7 minutes for participants in live conversations.
- Users who interact with Threads (long-form posts) spend 12% more time per visit than those who only engage with short tweets.
- The average session length has risen by 15% since the rebranding to X, reflecting heightened engagement.
Industry X Engagement Rates Statistics
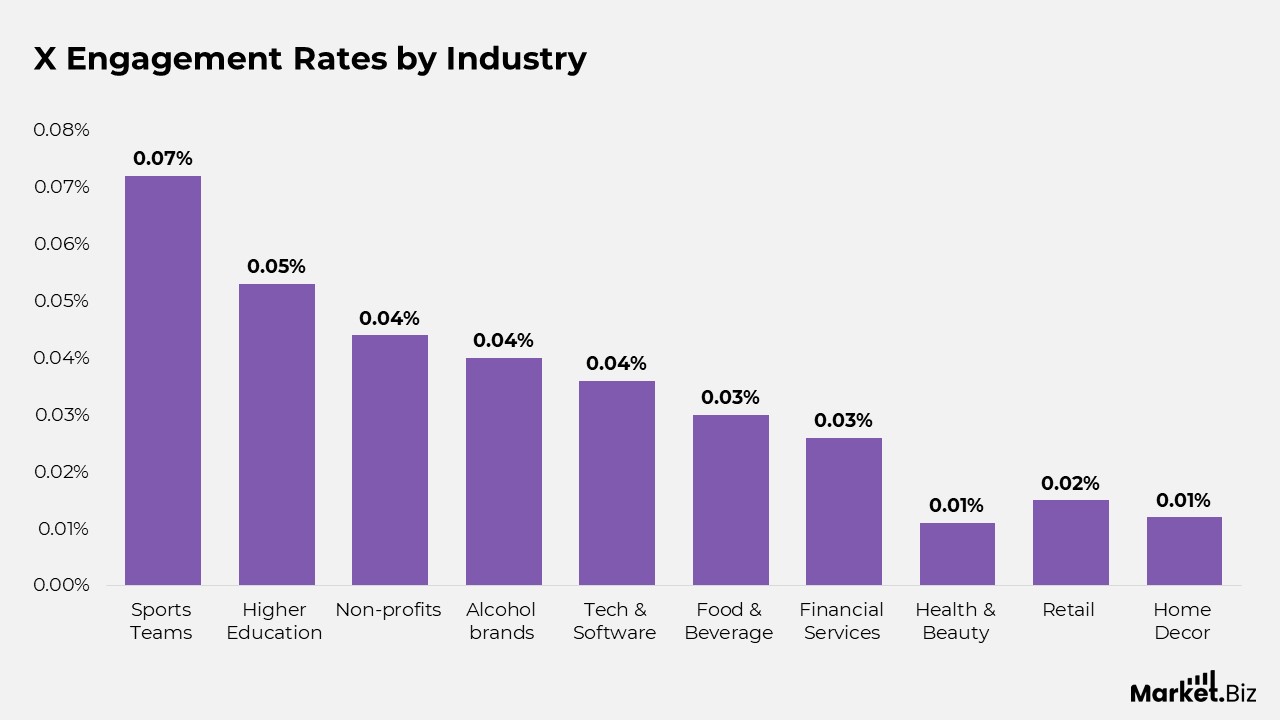
- The average engagement rate across various industries is 0.029% per tweet.
- Sports Teams dominate all sectors with an engagement rate of 0.072%, which is the highest recorded.
- Higher Education follows closely with a rate of 0.053%, indicating strong audience interaction within the educational field.
- Non-profits (0.044%) and Alcohol brands (0.040%) also exceed the industry median.
- Influencers match the engagement rate of Alcohol brands at 0.040%, suggesting effective interaction with personal brands.
- Tech & Software achieves a rate of 0.036%, which is slightly above the median.
- Food & Beverage (0.030%) just surpasses the median threshold.
- Financial Services (0.026%) and Fashion (0.018%) lag behind the average.
- Health & Beauty (0.011%) and Media (0.009%) show the lowest engagement rates.
- Retail (0.015%) and Travel (0.016%) also remain below the average engagement level.
- Home Decor (0.012%) ranks low, reflecting limited audience interaction.
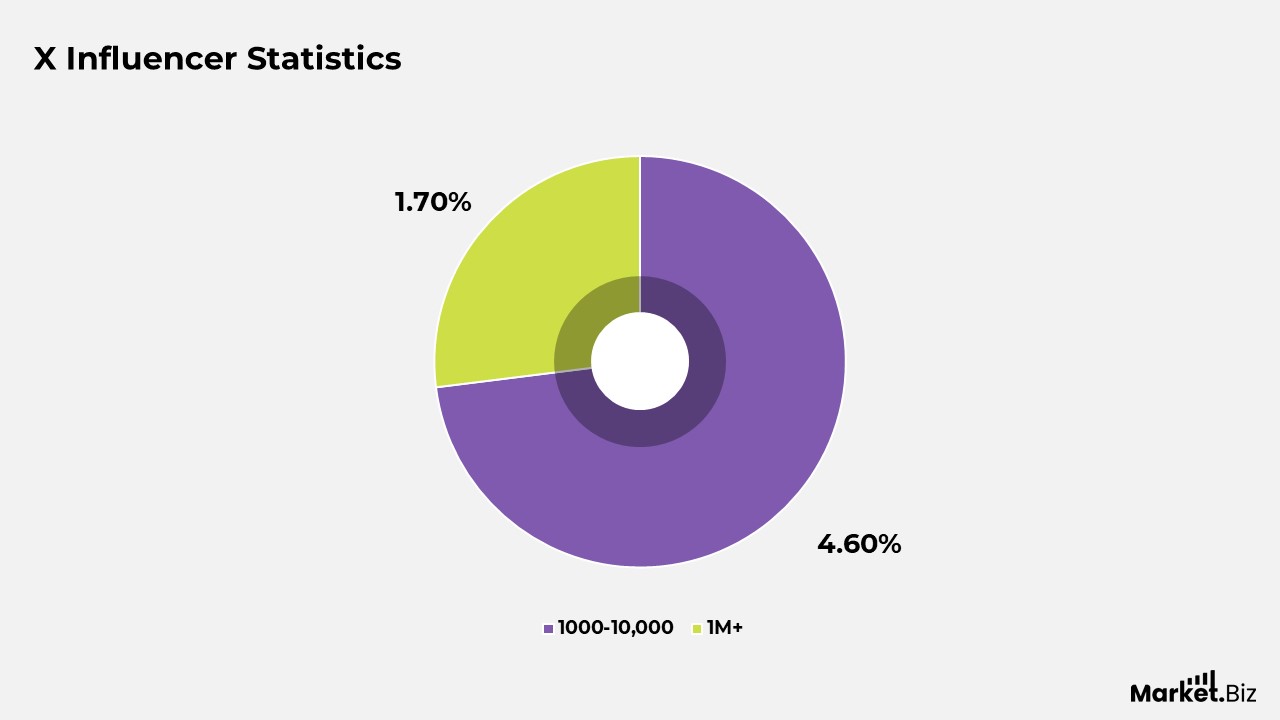
X Influencer Statistics
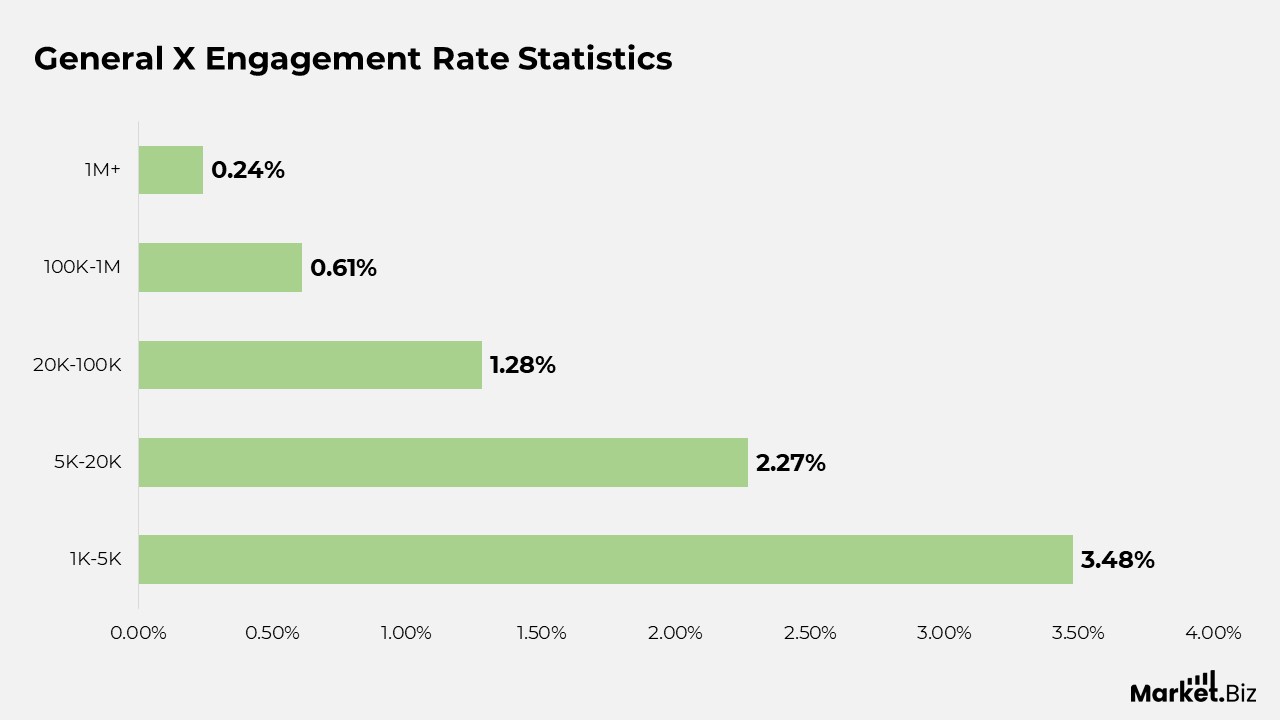
- Influencers with over 1 million followers achieve an average engagement rate of 1.7%.
- Nano-influencers, defined as those with 1,000 to 10,000 followers, experience the highest engagement levels, averaging 4.6%.
- Since 2024, partnerships with influencers on X have increased by 28%.
- The rates for sponsored tweets vary significantly, with micro-influencers typically charging around $120 per post.
- Tech influencers are the leading category on the platform, accounting for 32% of all sponsored content.
- Influencers using Threads, which are long-form tweets, enjoy a 24% increase in retweet rates.
- Influencers based in the U.S. constitute 46% of all sponsored activities on X.
- The five primary categories of influencers are: Tech, Gaming, Fashion, Personal Finance, and Politics.
- Verified influencers experience a 41% higher engagement rate compared to their unverified counterparts.
- In 2025, AI-generated influencers have emerged, and their posts are receiving nearly three times the impressions of traditional influencer posts.
X Engagement Rates and Interaction Metrics Statistics
- The average engagement rate for tweets in 2025 is 0.045%, which is a slight decrease from 0.048% in 2024.
- Tweets that include images garner 2.3 times more engagement compared to those that do not feature any media.
- Tweets containing videos experience 10 times more shares than posts that consist solely of text.
- Incorporating hashtags enhances engagement by 21%, although using more than two hashtags may lead to a decline in engagement.
- Engagement levels are highest on Wednesdays and Thursdays, particularly between 11 a.m. and 1 p.m. local time.
- The volume of replies has risen by 18% year after year, indicating a stronger two-way communication dynamic.
- Tweets that are under 100 characters achieve 17% higher engagement rates than their longer counterparts.
- On average, users like 23 tweets each day, reflecting a 6% increase from 2024.
- Retweets represent 31% of all interactions by users on the platform.
- Threads, which are multi-tweet posts, generate 2.4 times more engagement than individual tweets.
Subscription Metrics and X Blue
- As of April 2025, the total number of X Blue subscribers worldwide stands at 3.6 million.
- The United States leads with 1.2 million paid subscribers, followed by the United Kingdom and India.
- It is anticipated that subscription revenue will reach $820 million by the end of the year.
- Verified checkmarks are now visible on 5.9% of all accounts, primarily due to X Blue.
- Engagement levels among X Blue users are 38% higher compared to those using the free version.
- Subscribers to X Blue post 2.8 times more often and are more inclined to use advanced features such as long-form tweets.
- Twitter Blue subscribers receive priority ranking in replies and searches, which affects the visibility of their content.
- The subscription tier that offers ad-free timelines has experienced a 61% increase in adoption over the last six months.
- Businesses now have the capability to link X Blue to their branded accounts, improving reach and click-through rates.
- Premium features like Bookmark Folders and Undo Tweet are used by over 70% of Blue users on a weekly basis.
X Popular Content Formats
- X provides a diverse range of captivating content formats, including videos, live Spaces, threaded discussions, and more. Let us explore this fascinating statistic related to X.
- An impressive 80% of user sessions are dedicated to watching videos, making them one of the most favored options.
- These engaging video experiences attract over 100 million active users each day.
- On the other hand, discussions on X reveal a noteworthy trend:
- 84% of posts are made up of replies, retweets, or quote tweets.
- This underscores the significance of user engagement and dialogue.
- Only 15% of posts represent original ideas shared directly by users, illustrating the community-oriented essence of this platform.
- Nevertheless, X users now have the opportunity to interact with Grok, an AI chatbot developed by Elon Musk’s company xAI, which exhibits a clever and rebellious behavior in contrast to other chatbots.
- Previously, Grok was accessible only to X Premium subscribers, with approximately 1.3 million individuals paying for the app. This accounts for merely 0.26% of X’s overall user base.
X Algorithm Statistics
- In 2024, users still encounter content that is relevant to them upon accessing the app or website.
- However, in 2023, Elon Musk indicated that X is modifying its algorithm to favor content from lesser-known accounts that users may not follow directly.
- Elon also pointed out that the platform prioritizes visually appealing content, including GIFs, images, and videos.
- This implies that posts featuring visuals tend to garner more engagement compared to those consisting solely of text.
- In 2025, X will continue to promote tweets that attract significant interaction and are recent, highlighting the significance of posting frequency.
Conclusion
X Engagement Statistics: Statistics from X indicate that this social media platform serves as an excellent choice for both businesses and personal brands. It facilitates connections with their communities, enables real-time interactions, and provides valuable insights.
Despite being the 12th most popular social media platform, the engagement levels and the volume of content consumption on X maintain their relevance, particularly following Elon Musk’s acquisition.
FAQs
The term “engagement formula” generally pertains to the calculation of engagement rate, which is a metric utilized to assess audience interaction with content or a brand. The fundamental formula is: (Total Engagements / Total Followers) * 100 = Engagement Rate (%). This formula can be modified based on the platform and the definition of an “engagement” (likes, comments, shares, etc.).
The X Model of Employee Engagement, developed by BlessingWhite, highlights a distinctive intersection where an employee’s optimal contribution to the organization coincides with their greatest personal satisfaction. This model elucidates why certain employees who exert considerable effort may still depart, while others who are content may not contribute significantly.
To check X (previously known as Twitter) impressions, you can find them via the platform’s analytics dashboard. For specific tweets, you can click on the graph icon located beneath the tweet to view its impressions. For a comprehensive overview of your account’s performance, you can access the complete analytics dashboard through the “Creator Studio” or by visiting analytics.x.com.