
Introduction
Rice Statistics: Rice, which serves as a fundamental food source for more than half of the global population, is a versatile cereal grain that encompasses thousands of varieties classified into medium-grain, long-grain, and short-grain categories. From the slender and distinct long-grain types to the sticky short-grain varieties, rice provides a wide array of culinary options, such as plain steamed sushi, rice, and rice pudding.
Although white rice is commonly consumed and retains minimal amounts of its bran layer, brown rice retains a greater quantity of nutrients and fiber. In addition to its nutritional benefits, rice carries cultural importance, representing fertility and prosperity in numerous societies. Whether featured in religious rituals or everyday meals, rice continues to be an essential element of global cuisine and cultural heritage.
Editor’s Choice
- The worldwide revenue from the rice market reached USD 280.4 billion in 2023.
- The global rice market has demonstrated a steady increase in revenue from 2022 to 2032, with a compound annual growth rate (CAGR) of 3.6%.
- When cooked, white, long-grain rice offers a nutritional profile for a serving size of 100 grams.
- Global rice consumption began at 468,862 thousand metric tons during the 2015-2016 period.
- India was the leading exporter, with rice exports valued at US$10.8 billion, representing 36.8% of total rice exports globally.
- Beginning at an index of 91.4 in 2016, the figure rose consistently to 99 in 2017 and further to 106.3 in 2018, reflecting an upward trend in rice prices.
General Rice Statistics
- The worldwide revenue from the rice market amounted to USD 280.4 billion in 2023.
- This significant growth continued until 2032, resulting in an overall market size of $382.2 billion, with medium-grain contributing $132.6 billion, long-grain rice accounting for $176.6 billion, and short-grain reaching $73 billion.
- The market’s distribution channels are primarily dominated by offline sales, which capture an 81% market share.
- Between 2022 and 2023, the global rice supply totaled 717.84 million metric tons.
- In 2022, the global rice production landscape (paddy rice) was led by China, which ranked first with a significant output of 208.49 million metric tonnes.
- India emerged as the leader in the market with rice exports valued at US$10.8 billion, representing 36.8% of total rice exports globally.
Rice Market Size Statistics
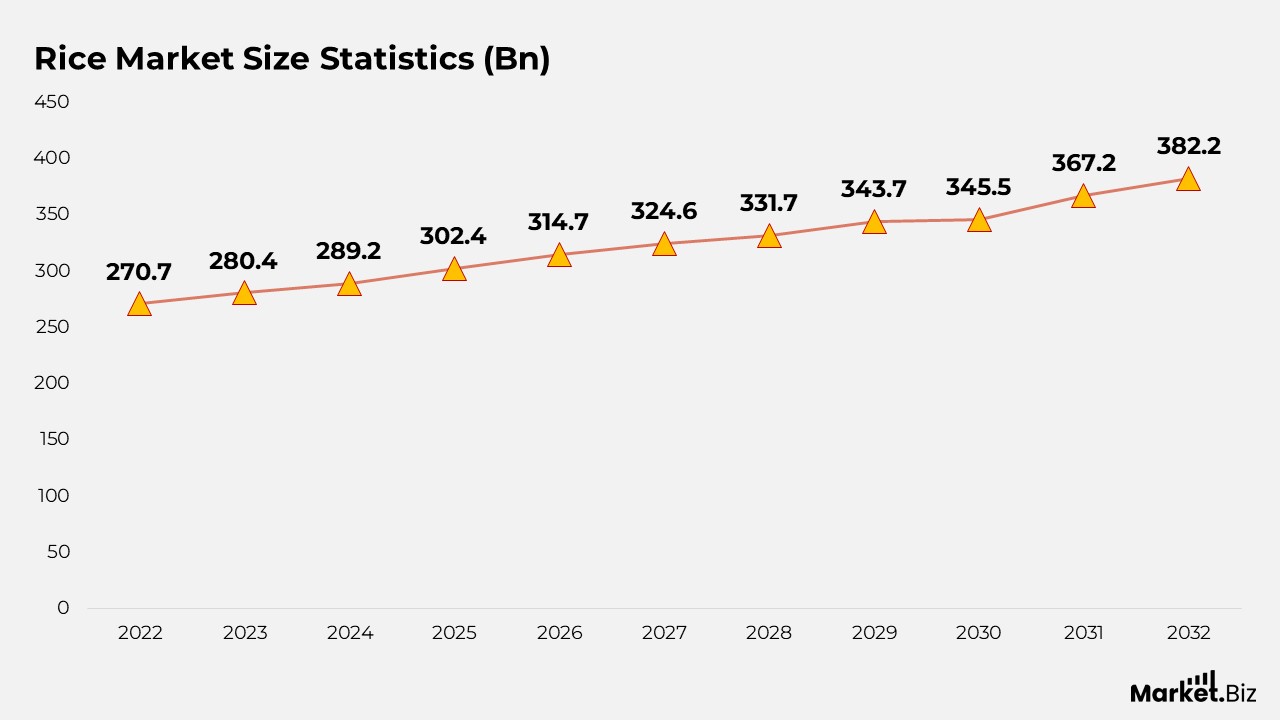
- The global rice market has exhibited a steady increase in revenue from 2022 to 2032, reflecting a compound annual growth rate (CAGR) of 3.6%.
- Starting with a market valuation of USD 270.7 billion in 2022, the revenue rose to USD 280.4 billion in 2023, indicating moderate growth.
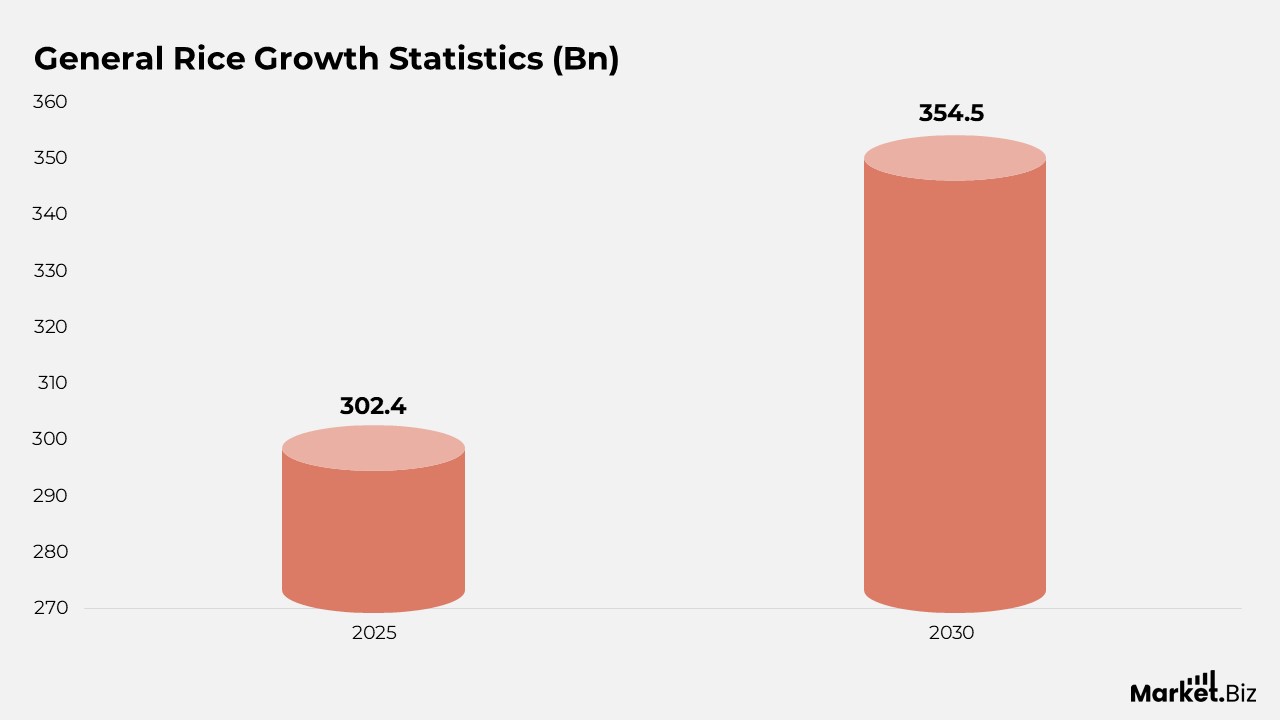
- This trend is projected to continue, with an estimated revenue of USD 289.2 billion in 2024, and a more pronounced increase expected in the following years. By 2025, the market is anticipated to reach USD 302.4 billion.
- This growth trajectory is maintained in the subsequent years, with market revenues forecasted to be USD 314.7 billion in 2026 and USD 324.6 billion in 2027.
- The revenue is predicted to rise to USD 331.7 billion in 2028, followed by a more significant increase to USD 343.7 billion in 2029.
- The upward trend continues into the next decade, with projected revenues of USD 354.5 billion in 2030, USD 367.2 billion in 2031, and ultimately reaching USD 382.2 billion by 2032.
Rice Market by Distribution Channel Statistics
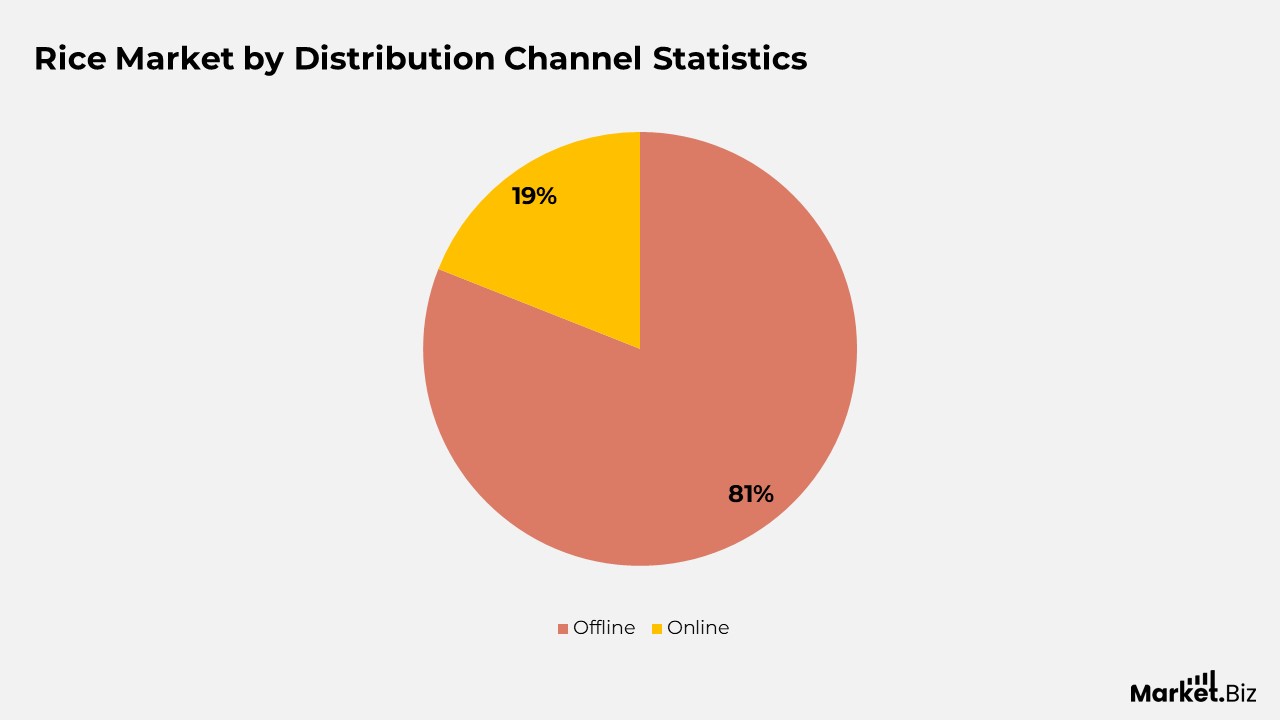
- The market’s distribution channels are primarily led by offline sales, which command an 81% market share. This considerable segment underscores the ongoing inclination of consumers towards conventional purchasing methods.
- Conversely, online sales represent 19% of the market. This suggests a notable, albeit lesser, dependence on digital platforms for shopping.
Nutritional Statistics of Rice
- When cooked, white long-grain rice offers a nutritional profile for a serving size of 100 grams.
- There is no cholesterol present, and the sodium content is minimal at 1 milligram.
- This variety of rice provides 35 milligrams of potassium, which represents approximately 1% of the Daily Value.
- It is mainly made up of carbohydrates, delivering 28 grams, which includes 0.4 grams of dietary fiber and a small amount of sugar at 0.1 grams.
- The protein content is 2.7 grams, accounting for about 5% of the Daily Value.
- Regarding micronutrients, it supplies 1% of the Daily Value for both calcium and iron, 5% for Vitamin B6, and 3% for magnesium. However, it does not contain Vitamin C, Vitamin D, or Cobalamin (Vitamin B12), all of which are at 0%.
- These percentages are calculated based on a daily diet of 2,000 calories, which assists in evaluating the nutritional value of this food within an average diet.
Global Supply of Rice Statistics
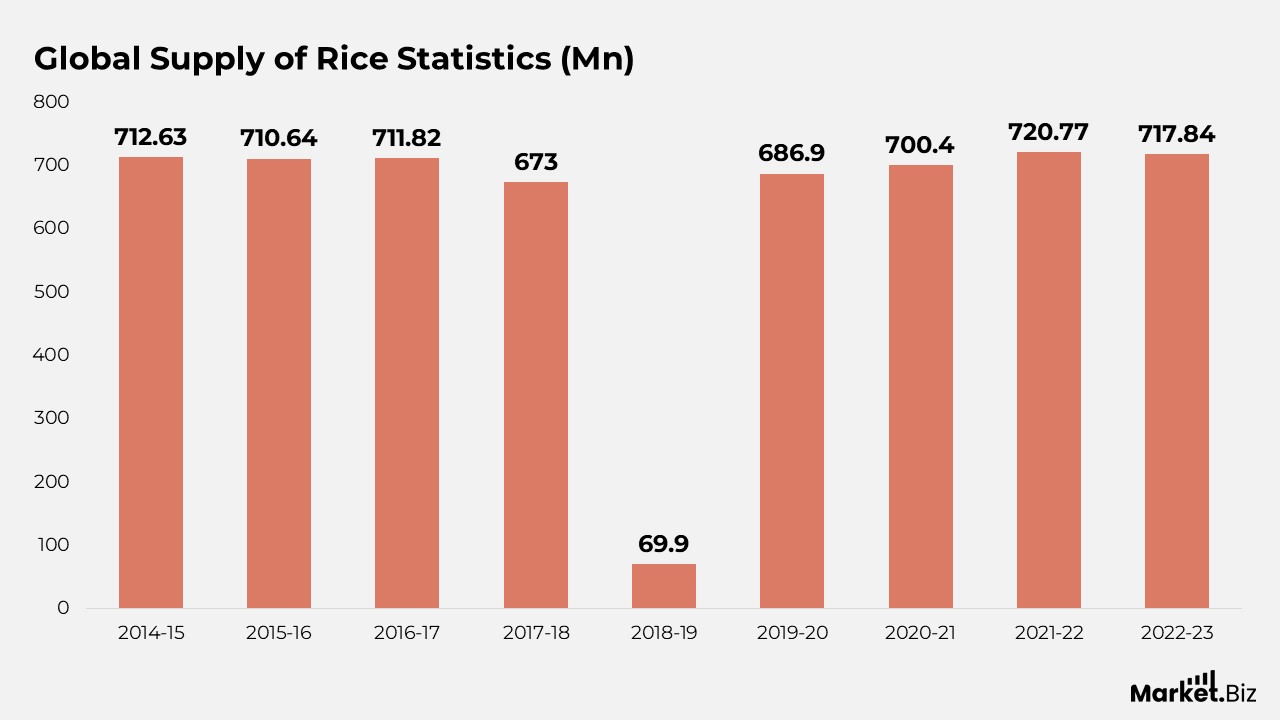
- The overall global rice supply, quantified in million metric tons, exhibited fluctuations from 2014 to 2023.
- Starting at 712.63 million metric tons during the 2014-2015 marketing year, the supply experienced a minor decline to 710.64 million metric tons in 2015-2016, before rebounding to 711.82 million metric tons in 2016-2017.
- Nevertheless, a significant reduction was observed in 2017-2018, with the supply falling to 673.00 million metric tons, likely influenced by various factors including weather-related disruptions, alterations in agricultural practices, or market dynamics.
- This downward trend persisted into the subsequent year, with supply dropping dramatically to 69.90 million metric tons in 2018-2019, indicating a considerable decrease.
- However, a recovery was noted in 2019-2020, as the supply rose to 686.90 million metric tons, indicating a partial rebound from the previous year’s low.
- The following years demonstrated further enhancement, with supply reaching 700.40 million metric tons in 2020-2021 and 720.77 million metric tons in 2021-2022, signifying a positive trend.
- Nonetheless, in 2022-2023, the supply saw a slight reduction to 717.84 million metric tons.
Production Volume of Milled Rice
- The global output of milled rice has exhibited a predominantly increasing trend, as illustrated by the data.
- Beginning at 472.90 million metric tons during the 2015-2016 period, production rose consistently to 486.20 million metric tons in 2016-2017 and further to 495.00 million metric tons in 2017-2018.
- This trend persisted with minor fluctuations, achieving 498.22 million metric tons in 2018-2019 and 498.18 million metric tons in 2019-2020.
- A more significant rise was noted in 2020-2021, with production climbing to 508.80 million metric tons, followed by a moderate increase to 513.10 million metric tons in 2021-2022.
- Nevertheless, the following years experienced a slight downturn, with production stabilizing at approximately 512.96 million metric tons in 2022-2023 and marginally increasing to 513.54 million metric tons in 2023-2024.
Statistics By Rice Consumption
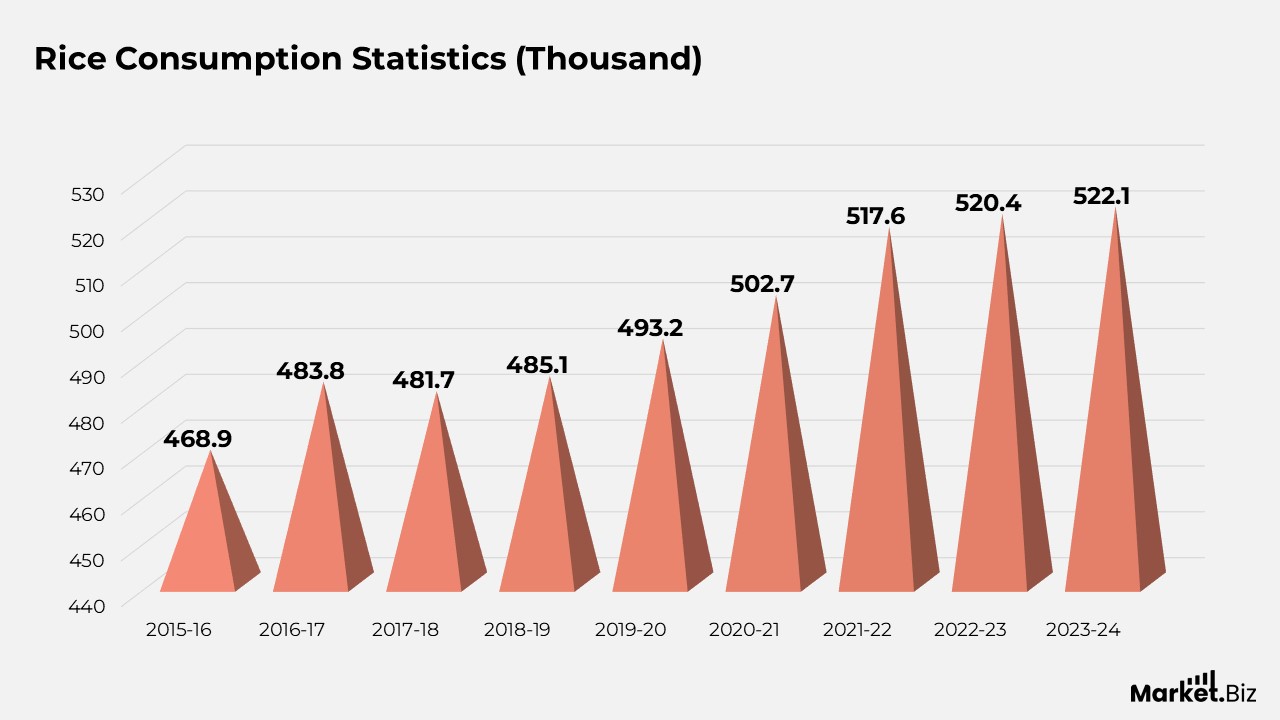
- Global rice consumption has experienced a consistent rise from 2015 to 2024.
- The initial consumption was recorded at 468,862 thousand metric tons during the 2015-2016 period.
- It increased to 483,817 thousand metric tons in 2016-2017, and although there was a minor decrease to 481,678 thousand metric tons in 2017-2018, it bounced back to 485,064 thousand metric tons in 2018-2019.
- The upward trajectory persisted into 2019-2020, with consumption reaching 493,232 thousand metric tons.
- In the 2020-2021 period, consumption surpassed half a million metric tons, achieving a notable increase to 502,692 thousand metric tons.
- This upward trend continued into the 2021-2022 period, with consumption soaring to 517,622 thousand metric tons.
- The latest figures indicate a further rise to 520,437 thousand metric tons in 2022-2023, with forecasts for 2023-2024 suggesting a modest increase to 522,100 thousand metric tons.
Rice Exporting Countries Statistics
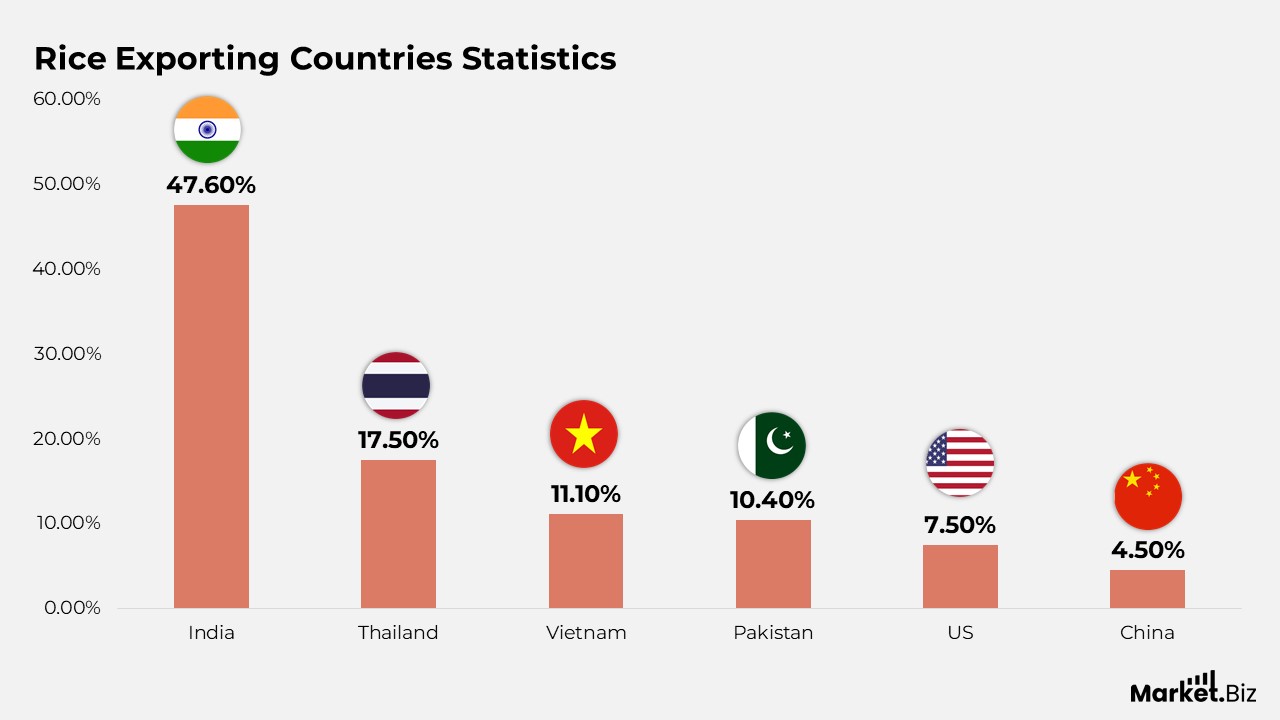
- In 2022, the leading rice-exporting nations exhibited a varied array of contributions to the global rice market.
- India topped the list with exports valued at US$10.8 billion, which constituted 36.8% of the total rice exports worldwide.
- Thailand followed as a prominent exporter, generating $4 billion and securing 13.5% of the market share.
- Vietnam also played a significant role, with exports amounting to $2.5 billion, representing 8.6% of the market.
- Close behind, Pakistan exported rice estimated at $2.4 billion, making up 8% of the global share.
- The US contributed $1.7 billion in rice exports, 5.8% of the market.
- China’s exports totaled $1 billion, accounting for 3.5% of the overall.
- Myanmar and Italy were relatively close in their export figures at $786.8 million and $804.7 million, respectively, each claiming approximately 2.7% of the market.
- Belgium and Brazil completed the top ten, with Brazil exporting $657.5 million worth of rice (2.2% of the market) and Belgium $515.6 million (1.8%).
Rice Importing Countries Statistics
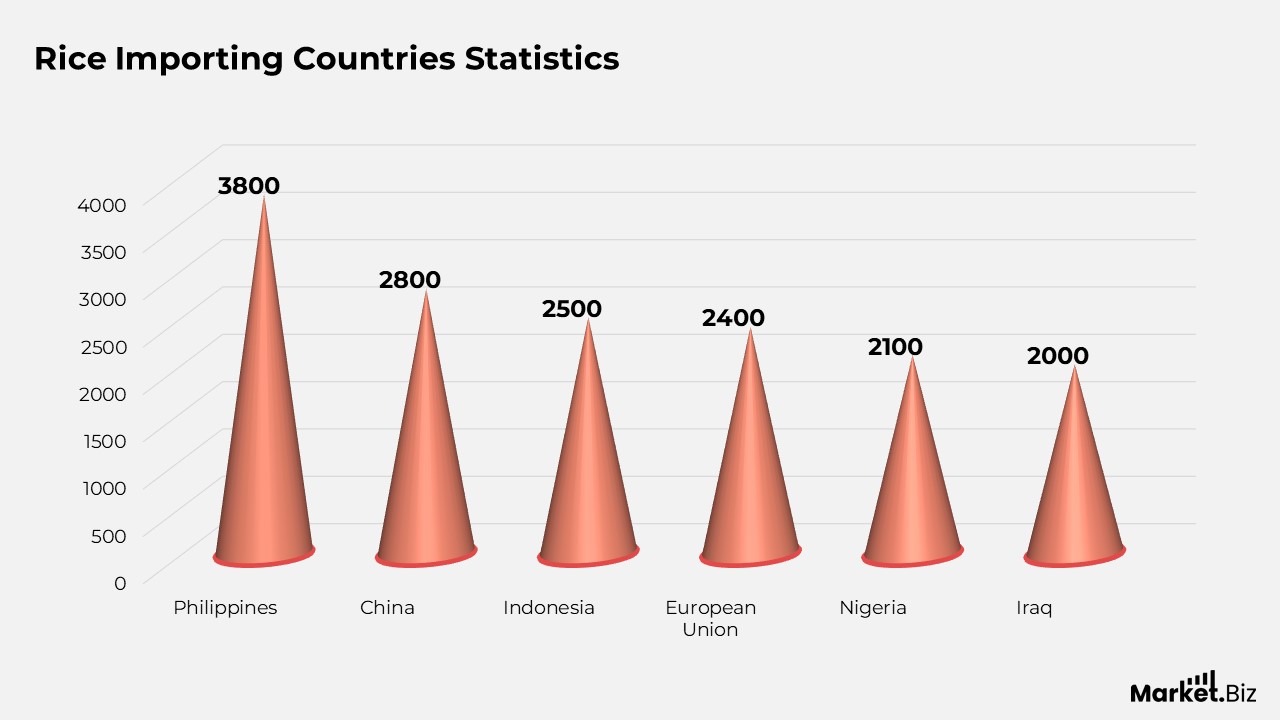
- During the 2023/2024 period, various nations surfaced as significant rice importers, indicating a varied global demand.
- The Philippines topped the list with rice imports amounting to 3.8 million metric tonnes, followed by Indonesia at 2.5 million metric tonnes and China at 2.8 million metric tonnes.
- Importantly, the European Union, functioning as a unified body, imported 2.4 million metric tonnes of rice.
- Iraq and Nigeria each recorded rice imports of 2.1 million metric tonnes, while Saudi Arabia, Vietnam, Senegal, and Côte d’Ivoire each imported 1.4 million metric tonnes.
Price of Rice Statistics
- Beginning at 91.4 in 2016, the index steadily increased to 99 in 2017 and further to 106.3 in 2018, reflecting an upward trend in rice prices.
- Nevertheless, in 2019, the index saw a minor decrease to 101.5 before making a strong recovery to 110.2 in 2020, representing a considerable rise.
- The subsequent year, 2021, experienced a slight reduction to 105.8, indicating some level of price stabilization.
- Importantly, 2022 observed a small increase in the index, reaching 108.8, which suggests a moderate growth.
- However, the most significant change took place in 2023, with the index skyrocketing to 132, indicating a major surge in rice prices.
Rice Recent Statistics
- DEF Rice Technologies has successfully secured $10 million in venture capital funding to advance sustainable farming practices and apply precision agriculture techniques, with the goal of enhancing crop yields by 25%.
- GHI Global Investors has made a strategic investment of $20 million in a rice breeding research institute to expedite the creation of high-yield, disease-resistant rice varieties.
- The adoption of AI-driven predictive analytics in rice farming practices aims to optimize irrigation schedules and pest control strategies, resulting in a 30% decrease in production costs.
Conclusion
In summary, rice continues to be a fundamental food source globally, with its consumption deeply embedded in numerous cultures and culinary practices. The international rice market has shown consistent growth over the years, propelled by factors such as increasing population, evolving dietary habits, and economic progress.
The market is characterized by various trends, including changes in production, consumption, and trade dynamics. Moreover, consumer preferences regarding rice are shaped by several elements, including flavor, texture, cost, and cultural customs.
Grasping these dynamics is crucial for stakeholders in the rice industry, such as producers, traders, and policymakers, to effectively navigate the market’s complexities. As the world continues to change, the demand for rice is expected to remain strong, offering opportunities for innovation, sustainability, and expansion within the rice sector.
FAQs
Rice is available in several varieties, including long-grain, medium-grain, and short-grain. Furthermore, there are speciality types such as Basmati, Jasmine, Arborio, and sushi rice.
Rice is generally cultivated in flooded fields known as paddies. This process includes sowing rice seeds in prepared soil, inundating the fields with water, caring for the plants as they develop, and ultimately harvesting the fully grown rice grains.
Rice serves as a significant source of carbohydrates, supplying energy to the body. It also provides vital nutrients such as vitamins, minerals, and dietary fiber. The nutritional composition differs based on the rice variety, with brown rice frequently regarded as healthier due to its increased fiber and nutrient levels compared to white rice.