
Introduction
App Revenue Statistics: The global app industry continues to experience consistent growth, driven by increasing smartphone usage, enhanced internet accessibility, and evolving user preferences. The market is broadening its reach across various segments, including mobile gaming, subscription services, e-commerce, and enterprise applications.
With mobile platforms becoming integral to daily routines, innovations in artificial intelligence, targeted advertising, and seamless in-app purchasing are fueling revenue expansion. The growing popularity of mobile payment systems, digital streaming, and remote work solutions adds further momentum to this upward trend.
Amidst these developments, companies and app developers are focusing on enhancing user retention, developing innovative monetisation models, and leveraging data analytics to boost competitiveness and ensure sustained profitability.
Editor’s Choice
- Mobile app downloads have increased by 7% in recent years, with free apps dominating the landscape. The Google Play Store leads both in the number of available apps and total downloads, surpassing the Apple App Store.
- On average, individuals spend around 2 hours and 51 minutes daily on mobile apps, with a growing interest in categories such as social media, communication, gaming, and others.
- By February 2022, the majority of top iOS apps were either free or offered freemium models, with paid downloads significantly lagging, accounting for only 2.4% of the top gaming apps and 1.51% of health and fitness apps.
- Approximately 90% of the time spent on mobile devices is dedicated to using apps.
- In terms of app revenue, 2022 saw a total of $567.49 billion generated from digital ads.
- There are currently over 5.195 million apps available across various platforms.
- Digital ad spending is projected to grow to $626.86 billion by 2023.
- Google Play generated $42.3 billion in revenue from apps and games in 2022.
- In-app purchases are a widely used monetization strategy, with 50% of non-game apps and 79% of gaming apps incorporating them.
- An overwhelming 98% of Google Play’s revenue comes from free apps.
- The total number of mobile app downloads reached 255 billion in 2022.
General App Revenue Statistics
- There are more than 5.195 million apps available across all app stores, with 3.553 million apps on Google Play and 1.642 million on the Apple App Store.
- In 2022, MyFitnessPal’s Calorie Counter achieved remarkable success, generating $11.93 million in revenue.
- In 2022, Google Play generated $42.3 billion in revenue from apps and games, representing an 11.6% decline from the previous year.
- Of the 3.553 million mobile apps on Google Play, 69.9% (approximately 3.442 million) are free to download, while 3.1% (about 110 thousand) are paid apps.
- By December 2024, the Google Play Store experienced a notable surge in new app additions, with approximately 41,000 new mobile applications launched on the platform.
- In the second quarter of 2024, the Apple App Store hosted around 1.54 million mobile apps.
- The total revenue in the app market is anticipated to reach US$437.75 billion in 2022.
- The market is expected to grow at a compound annual growth rate (CAGR) of 7.48% from 2022 to 2029, reaching a projected value of US$781.70 billion by 2029.
- Revenue from in-app purchases in the app market is predicted to hit US$167.33 billion in 2022.
- Revenue from paid apps in the app market is projected to total US$4.59 billion in 2022.
- Advertising revenue in the app market is estimated to reach US$265.84 billion in 2022.
- The number of app downloads globally is expected to reach 235.26
(Source: Statista, Bank My Cell, Mobile Marketing Reads, TechJury.net, appinventiv )
Mobile App Market Trends
- Mobile app revenue is projected to reach $613 billion by 2025.
- By 2023, the Google Play Store is expected to host around 3.553 million apps for Android devices, while the Apple App Store will have approximately 1.642 million apps.
- In 2022, total app downloads from the iOS App Store amounted to 142.6 billion, while Google Play Store saw 110 billion downloads.
- By 2026, consumer spending on both Google Play and the Apple App Store is forecast to reach $233 billion, with 5% of users contributing through in-app purchases. The majority of these users are based in Asia, North America, and Europe.
- According to app sales data, 48.2% of mobile app revenue comes from in-app purchases, followed by paid app revenue, which accounts for 37.8%.
- On a global scale, the average monthly in-app spend per user, per app, is around $0.50, with Android users averaging $0.47 per in-app purchase and iPhone users spending around $1 per purchase.
- The trend of paid apps continues to decline, with free apps now generating 98% of the Google Play Store’s revenue. In-app purchases make up 48.2% of total revenue.
- The number of low-quality apps on the Google Play Store is growing annually by 8%, from about 930,000 apps in January 2022 to over 1 million in 2023.
(Source: Sport Lens, Statista, Bank My Cell, TechJury.net )
Smart Travel Apps Market Size
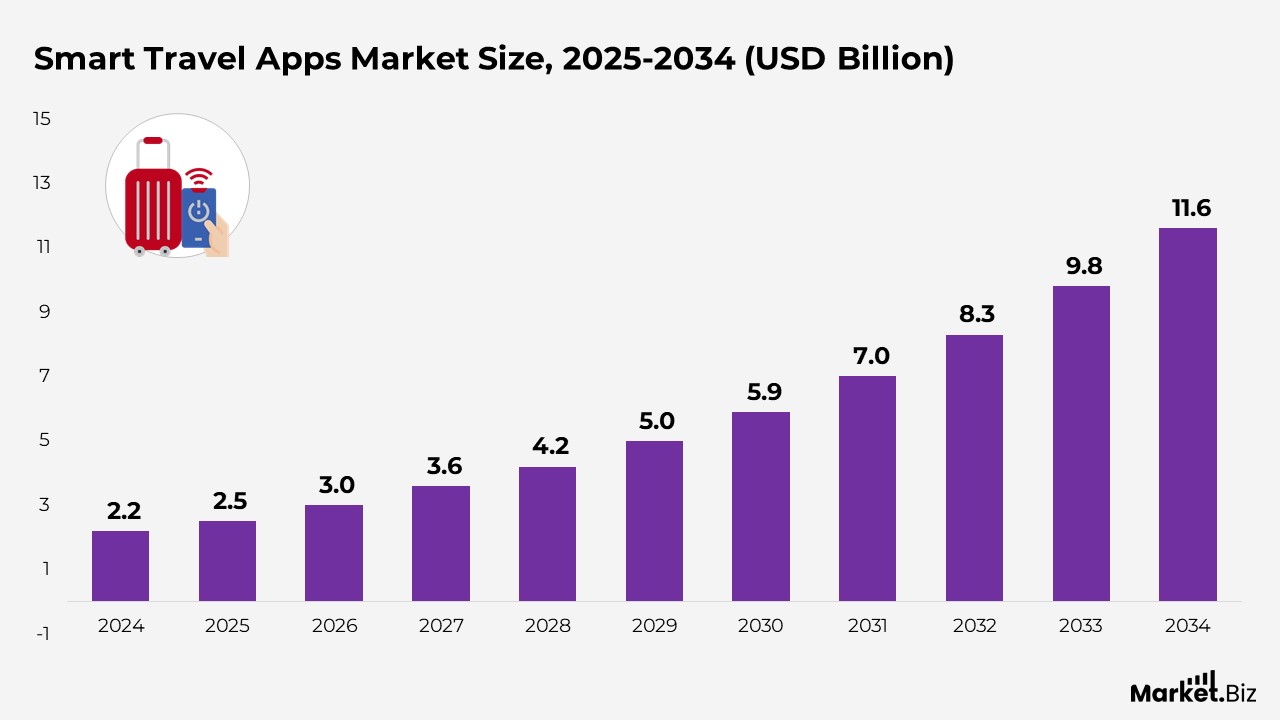
- According to Market.us, the global smart travel apps market is projected to grow from $2.5 billion in 2025 to $11.6 billion by 2034, representing a compound annual growth rate (CAGR) of 18.4% from 2025 to 2034.
- The market growth is driven by the adoption of AI, IoT, and big data, enabling apps to provide real-time insights, predictive analytics, and personalized experiences.
- In 2024, family travel led the market, with an over 48.6% share, driven by demand for safe and structured travel experiences.
- The Android platform dominated the Smart Travel Apps market in 2024, with a share exceeding 58.3%.
- Individual users held a leading position in 2024, accounting for more than 61.9% share of the global market.
- North America captured over 37.4% of the market share in 2024, generating revenues exceeding USD 0.80 billion.
- The U.S. Smart Travel Apps market reached approximately USD 0.72 billion in 2024, with strong growth supported by rising smartphone adoption and evolving travel habits.
- China led the travel eSIM segment with a market value of USD 556.1 million in 2024, reflecting its advanced digital travel infrastructure.
- In the U.S., Expedia held a 19.3% share of the travel app market due to its diverse service offerings and strong brand presence.
- Booking.com achieved 74.6 million global downloads, making it one of the top platforms for international travellers.
- India contributed 29% of global travel app downloads, highlighting it is rapidly expanding digital traveller segment.
- Europe generated around 40% of global travel app revenue, supported by high travel spending and effective app monetization.
(Source: Market.us)
Smart Home Automation Apps Market Size

- According to Market.us, the global home automation apps market is projected to grow from $3.6 billion in 2025 to $37.4 billion by 2034, representing a compound annual growth rate (CAGR) of 29.7% from 2025 to 2034.
- The market is experiencing significant growth due to the widespread adoption of IoT technologies, which enable seamless integration and control of home systems. Additionally, advancements in AI and machine learning enable predictive and personalized automation, thereby enhancing the user experience. The increasing availability of affordable IoT devices is accelerating adoption, enabling a broader consumer base to integrate smart technology into their homes.
- In 2024, the Security segment led the market, capturing over 33.8% of the share, fueled by the growing demand for home protection and the availability of affordable, reliable security solutions.
- The retrofit segment held a dominant position in the Smart Home Automation Apps market in 2024, accounting for more than 68.4% of the market share. This is largely due to homeowners’ preference for upgrading existing systems without extensive renovations, driven by the availability of cost-effective and easy-to-install smart devices that enhance home automation without requiring major infrastructure changes.
- North America held a dominant market share in 2024, accounting for more than 37.4% of the global market, generating approximately USD 1.03 billion in revenue. The region’s early adoption of smart home technologies, along with the presence of major industry players, reinforces its leadership position.
- The U.S. Smart Home Automation Apps market, valued at USD 0.93 billion in 2024, is expected to grow at a robust CAGR of 27.3%, driven by increased consumer awareness, the growing number of tech-savvy consumers, and supportive government initiatives promoting smart infrastructure. The rising demand for connected devices, coupled with government incentives for energy-efficient and sustainable technologies, is expected to support this strong growth trajectory.
(Source: Market.us)
Gaming App Statistics
- In 2024, simulation games dominated mobile game downloads with 9.8 billion total downloads, followed closely by puzzle games at 9.7 billion, arcade games with 9.6 billion, and lifestyle games at 4 billion downloads, according to Sensor Tower.
- The top mobile game subgenres in terms of time spent by players are Battle Royale (12.69%), followed by MOBA games (10.61%), and Sandbox games (8.16%).
- Strategy games led mobile game genres by consumer spending, generating $17.5 billion in in-app purchase (IAP) revenue, with RPG games earning $16.8 billion and puzzle games accumulating $12.2 billion, as reported by Sensor Tower.
- In 2024, there were an estimated 2.85 billion mobile gamers worldwide, representing around 83% of the total 3.42 billion gamers globally.
- In the United States, 53% of mobile gamers are female, while 47% are male.
- The total number of gamers saw a slight increase of +1.17% compared to the previous year.
- Gen Alpha and Gen Z dominate mobile gaming, with 94% and 92% of these generations, respectively, engaging in mobile gaming. Close behind are Millennials at 88% and Gen X at 72%.
- Approximately 79% of players engage with games that feature user-generated content.
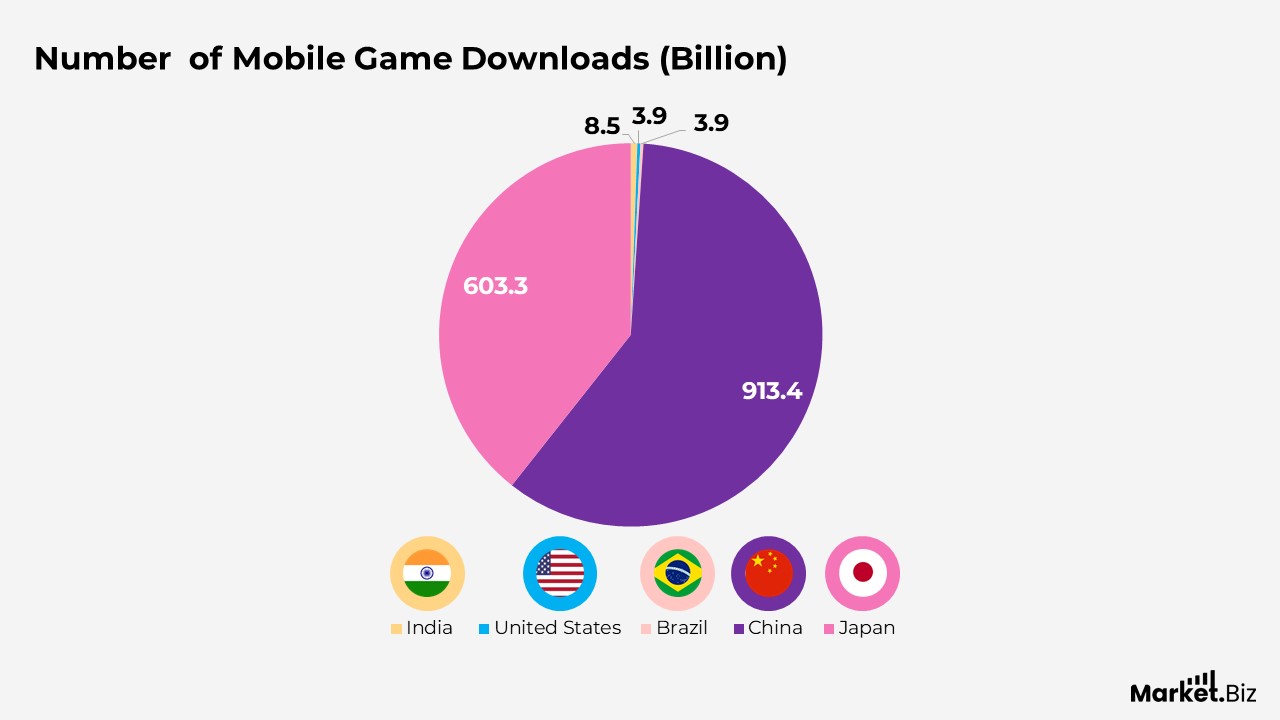
- India leads the global mobile gaming market with a staggering 8.5 billion app downloads.
- The United States and Brazil follow closely with 3.9 billion downloads each.
- China ranks fourth, with 913.4 million downloads recorded.
- Japan rounds out the top five with 603.3 million downloads.
(Source: Sensor Tower, Newzoo, Statista, MAF)
iOS App Revenue
- In June 2022, Tinder, the popular dating app, was the top-grossing app on the iPhone App Store worldwide, generating approximately $ 38.4 million in revenue.
- TikTok, a mobile-first social media app, ranked second with 29.2 million U.S. dollars in revenue by June 2022.
- The total advertising revenue generated by apps on iOS in 2021 was approximately $3 billion.
- A significant majority, about 94%, of apps on the App Store are available for free.
- On average, the App Store releases around 747 new applications daily.
- In October 2021, WhatsApp Messenger was the most downloaded app on the App Store.
- The Games category remains the most popular among all app categories on the Apple App Store.
(Source: Business of Apps, Statista, Evening Standard, 42matters, Enterprise Apps Today)
Google Play vs. Apple App Store
- The Google Play Store and Apple App Store collectively offer more than 5.7 million apps.
- In 2021, the combined revenue from both app stores reached a total of $111 billion.
- The Apple App Store alone is home to over 2.2 million apps.
- Over 700,000 educational apps are available across various app marketplaces.
- In 2021, users downloaded a total of 470 million educational apps from the Apple App Store. Other popular categories include education (8.66%), business (10.7%), lifestyle (8.58%), and utility (6.39%).
- With 3.48 million apps, the Google Play Store outnumbers the Apple App Store, which has 2.22 million apps.
- The Google Play Store outpaces the Apple App Store with over three times the number of downloads. Specifically, Google Play recorded 55 billion downloads in the first half of 2022, while the Apple App Store saw 15.9 billion downloads.
- About 53% of apps on Google Play have been rated, with most ratings falling between 4 and 4.5 stars
- A vast majority of apps on the Google Play Store are free to download, with 96% of them costing nothing.
(Source: G2.com, Inc, Statista, Bank My Cell, Mobile Marketing Read)
App Usage Trends
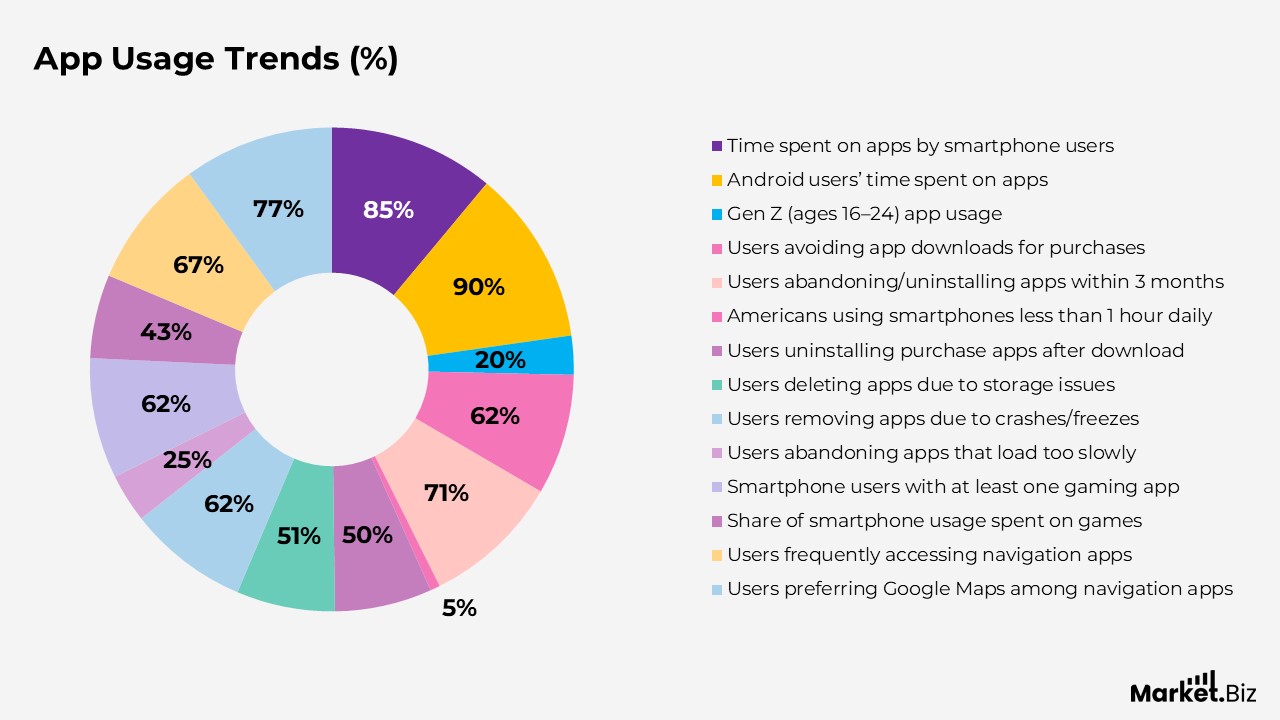
- 85% of smartphone users’ time is spent engaging with apps.
- On average, users access 9-10 apps daily and approximately 30 apps per month.
- Android users dedicate over 90% of their mobile time to using apps.
- Millennials spend an average of 253 minutes each day on apps through their smartphones.
- Gen Z (ages 16-24) use apps 20% more than other age groups.
- Americans typically check their phones every 10 to 12 minutes on average.
- 62% of smartphone users avoid downloading an app for making purchases.
- 71% of users abandon or uninstall an app within three months of installation.
- Only 5% of Americans use their smartphones for less than an hour a day.
- Half of those who download an app for purchasing will uninstall it afterwards.
- 50.6% of users will delete an app if it consumes too much storage on their phone.
- 62% of users will remove an app if it crashes or freezes.
- Apps that take too long to load will cause 25% of users to abandon them.
- 62% of people have at least one gaming app on their phones, with games accounting for 43% of total smartphone usage.
- 66.5% of smartphone users frequently access navigation apps, with 77% preferring Google Maps.
(Source: G2.com, Inc, Statista)
Most Downloaded Mobile Apps
| App Name | Platform(s) | Price | Total Downloads/Sales |
|---|---|---|---|
| Minecraft | iOS, Android, Windows Phone | $6.99 | Over 21 million downloads |
| Hitman: Sniper | iOS, Android | $0.99 | Over 10 million downloads |
| Fruit Ninja Classic | Android, Symbian, iOS, Windows Phone | $0.99 | Over 1 billion downloads |
| Grand Theft Auto III | Android, iOS | $4.99 | Over 1 million downloads |
| True Skate | Android, iOS | $1.99 | Over 5 million downloads |
| Poweramp Full Version Unlocker | Android | $4.99 | Over 5 million downloads |
| Camera ZOOM FX Premium | Android | $3.99 | Over 1 million downloads |
| Beautiful Widgets Pro | Android | $2.49 | Over 1 million downloads |
| Cut the Rope GOLD | iOS, Android | $0.99 | Over 960 million downloads |
| Smart Tools | Android | $2.99 | Over 1 million downloads |
(Source: Statista, TechJury.net )
Conclusion
The app market remains robust, fueled by the rising demand for mobile apps across various sectors. In-app purchases and advertising have emerged as key revenue drivers, supporting the ongoing growth of the market. The increase in global app downloads reflects the heightened appetite for mobile content and services.
Furthermore, mobile gaming and other app categories are experiencing increased consumer engagement, with developers continually introducing innovative monetisation models. As mobile technology continues to advance, the app market is poised for sustained growth, with regions like China leading the way in revenue generation.
With deepening user engagement and the emergence of new trends and technologies, the future of the app market looks highly promising.
FAQ’s
The widespread adoption of smartphones primarily drives the growth of the app market, as well as continual advancements in mobile technology and the increasing reliance on in-app purchases and advertising as key revenue streams. Furthermore, the growing demand for mobile content, gaming, and entertainment apps is driving the market’s expansion.
In-app purchases are a crucial revenue generator for mobile apps, particularly in gaming and subscription models. These transactions allow users to buy virtual items, unlock premium features, or access additional content within the app, providing developers with a steady income stream long after the initial app download.
Advertising plays a crucial role in generating app revenue, particularly for free-to-download apps. It enables developers to monetize their apps without requiring users to make purchases, thus attracting a broader user base. Through targeted advertising, developers can efficiently reach specific user groups, maximizing revenue opportunities.
China leads the global app revenue generation, driven by its vast, active mobile user base. Other regions, including North America and Europe, also contribute significantly, driven by robust consumer spending and widespread adoption of technology.
The growing number of app downloads worldwide is a clear indicator of the increasing demand for mobile content and services. As more users download apps for various purposes, such as entertainment, gaming, health, and social networking, this boosts revenue through both in-app purchases and advertising.