Introduction
Android Phone Statistics: Android phones have firmly established themselves as a dominant force in the global smartphone market, offering a broad array of devices that cater to different price points and user needs. Over the years, Android has captured a substantial portion of the market, with billions of active users across the globe.
The operating system’s open-source nature and flexibility have played a major role in its widespread adoption, with various manufacturers incorporating Android into their devices. Developed and emerging markets rely heavily on Android phones, which have fueled their ongoing growth.
The platform’s strength is further reinforced by continuous innovation in areas such as camera technology, battery life, and app ecosystems, solidifying Android’s position as a major driver of the smartphone industry. As Android phones evolve, they remain a pivotal force in shaping mobile technology and enhancing consumer engagement worldwide.
Editor’s Choice
- As of 2025, there are 3.3 billion users of the Android operating system worldwide.
- Android holds a commanding 71.85% share of the global mobile operating system market.
- In the United States, Android commands 42.34% of the mobile OS market share.
- Android 14 owns 33.67% of the Android version market share.
- Samsung is the dominant player in the Android mobile vendor market, capturing 22.91% of the market share.
- By March 2023, the Google Play Store hosted 2.67 million apps.
- TikTok leads as the most downloaded Android app, with 24 million downloads, followed by WhatsApp Messenger and Instagram.
- Coin Master is the highest-grossing Android app, generating USD 47.96 million in revenue.
- The majority of Android apps, 97%, are free, while only 3.1% are paid apps.
- Android became the world’s most popular mobile OS in 2014, reaching 1 billion users within just one year.
- Android’s user base reached its peak in 2018, continuing to grow steadily since its launch.
- Samsung holds the largest share of the Android market at 14.5%, followed by Xiaomi.
- 9% of apps on the Google Play Store are available for free download.
- On average, users spend 4 hours and 37 minutes per day on their smartphones.
- Individuals check their phones an average of 58 times each day.
- Ghanaians spend the most time on their phones each day, while Japanese citizens spend less than half the global average.
- 75% of Gen Z claim they spend too much time on their smartphones.
Number of Android Users Statistics
- 2022 marked 3.3 billion Android users globally.
- In 2021, the number of Android users surged to 3 billion.
- By 2020, the user base expanded to 2.8 billion.
- 2019 saw an increase to 2.5 billion users.
- In 2018, Android users continued to grow, reaching 2.3 billion.
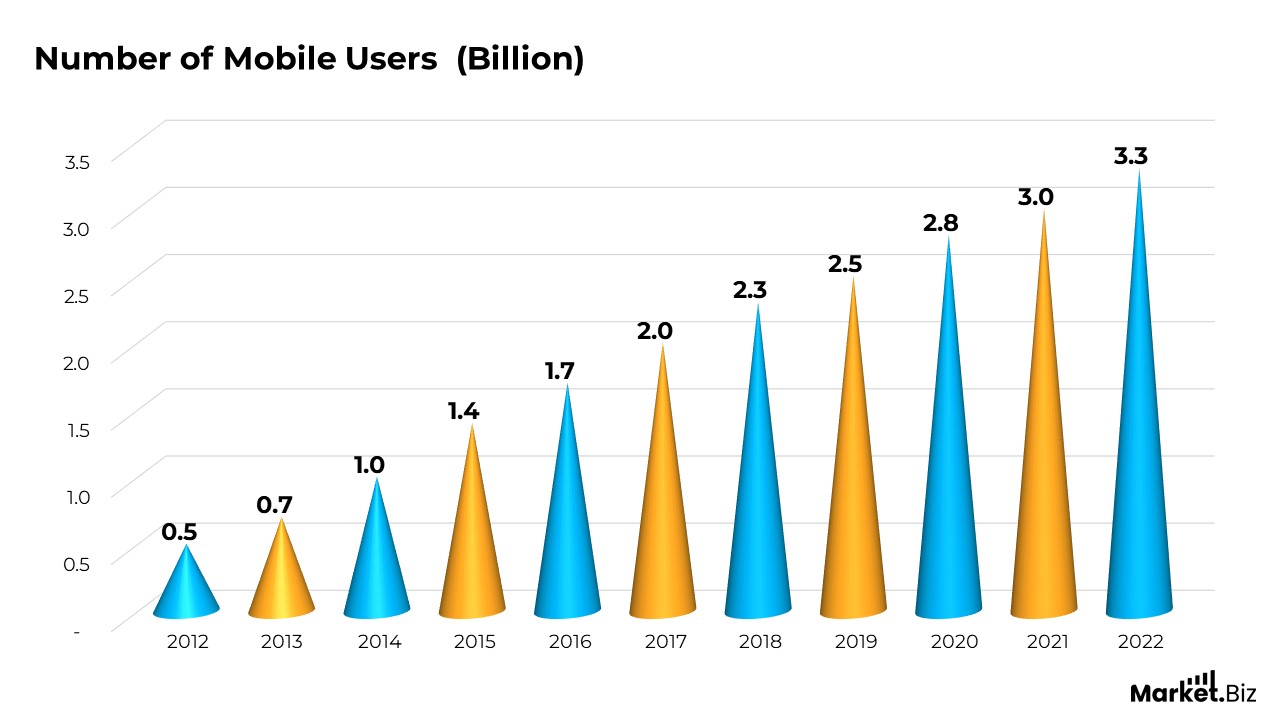
(Source: DemandSage, Business of Apps, Statista)
Mobile Usage Statistics
- On average, individuals spend over four hours per day using their mobile devices.
- The number of unique mobile users is growing at an annual rate of 2.7%, with millions upgrading from feature phones to smartphones in the past year.
- In October 2023, 5.60 billion unique mobile users were recorded, making up more than two-thirds of the global population.
- Mobile data traffic surged by 33% between Q3 2022 and Q3 2023.
- Video traffic is expected to account for 73% of all mobile data traffic by the end of 2023.
- 58% of Google searches are now conducted on mobile devices.
- More than 90% of smartphone users check their phones within the first hour after waking up.
- In the past year, there has been an increase of 145 million unique mobile users globally.
- By the end of 2029, mobile data traffic per smartphone is likely to reach 56 GB monthly.
- In January 2021, there were 5.22 billion unique mobile users worldwide.
- 3.6 billion people used social media on their mobile devices in 2020.
Moreover
- There are approximately 6.92 billion smartphone users globally, representing 86.29% of the world’s population by 2023.
- As of 2023, 270 million Americans, or 81.6% of the population, are smartphone owners.
- Around half of all screen time sessions begin within 3 minutes of the previous one, turning phone usage into a habitual activity.
- In seven countries, people spend more than 5 hours daily on their phones, with 18 countries surpassing the average of 3 hours and 43 minutes.
- The average American checks their phone 96 times a day, or roughly once every ten minutes.
- 11% of people report using their phones for more than 7 hours daily, while only 5% of Americans use their phones for less than 1 hour each day.
- In 2023, 78% of American millennials watched videos on their smartphones at least once a week.
- Between 2013 and 2024, the total number of smartphone users globally grew at an annual rate of 6.2%, with the largest growth of 20.9% occurring in 2014.
- In the US, smartphone users touch their devices 2,617 times on average per day.
(Source: Gitnux, DataReportal, Ericsson, Research.com, Zippia, Exploding Topics, Demandsage, Oberlo, forms.app.)
Smartphone Market Size
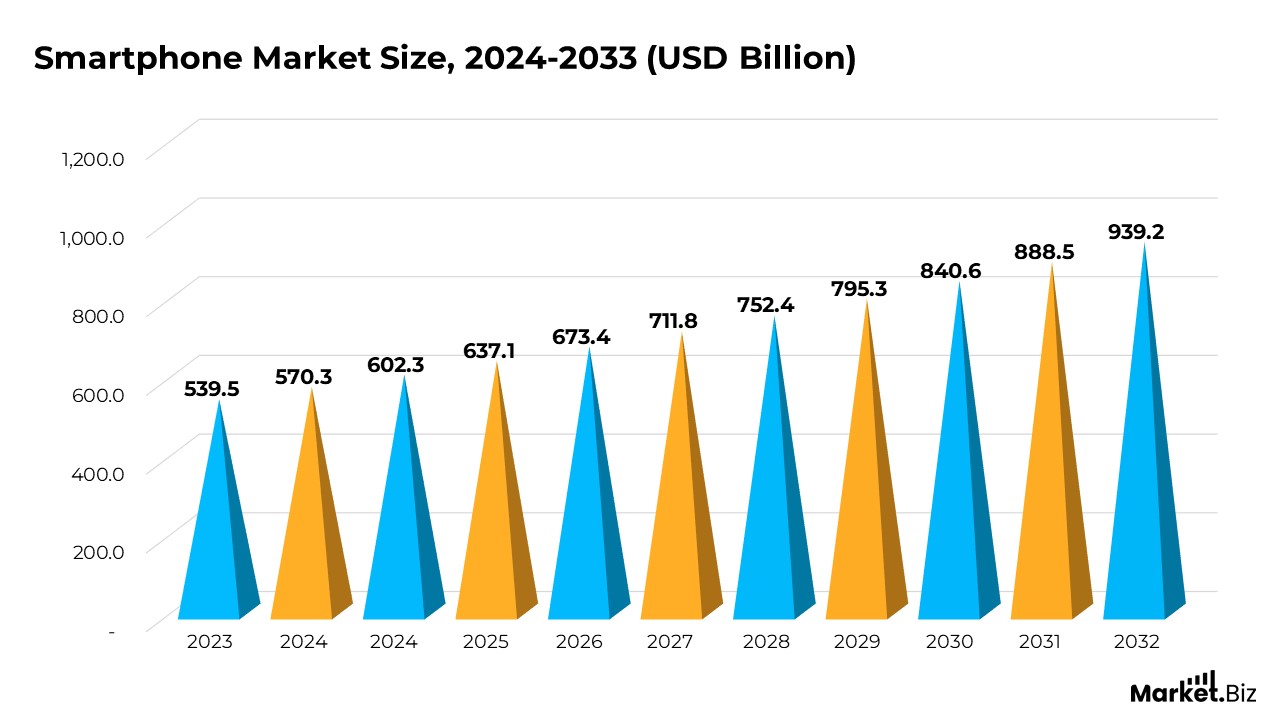
- According to Market.us, the smartphone market is expected to rise from $570.3 billion in 2024 to $939.2 billion by 2033, representing a compound annual growth rate (CAGR) of 5.7% from 2024 to 2033.
- The smartphone market’s growth is fueled by continuous innovation and strong consumer demand for improved technology, features, and designs.
- Android leads the smartphone market with a 63.4% share, primarily due to its open-source nature and flexibility for manufacturers and developers.
- The OEMs’ store segment holds the largest market share at 47.6%, covering brand stores and official online stores.
- North America holds 42.6% of the smartphone market, valued at USD 229.83 billion, driven by high spending on premium smartphones and extensive 5G infrastructure.
- Asia Pacific is experiencing rapid smartphone market growth, with China, India, and South Korea driving demand for both affordable and premium smartphones.
- 45% of the 5.3 billion active smartphones globally will be 5G-ready by 2024, up from 15% currently.
- Samsung reported sales of over 60 million smartphones in Q1 2024, with flagship models like the Galaxy S24 Ultra and foldable Galaxy Z series emphasizing AI and display innovation.
- Xiaomi saw a 27.4% increase in shipments in Q1 2024, indicating strong competition and the need for continuous innovation in the market.
(Source: Market.us)
Foldable Smartphones Market Size
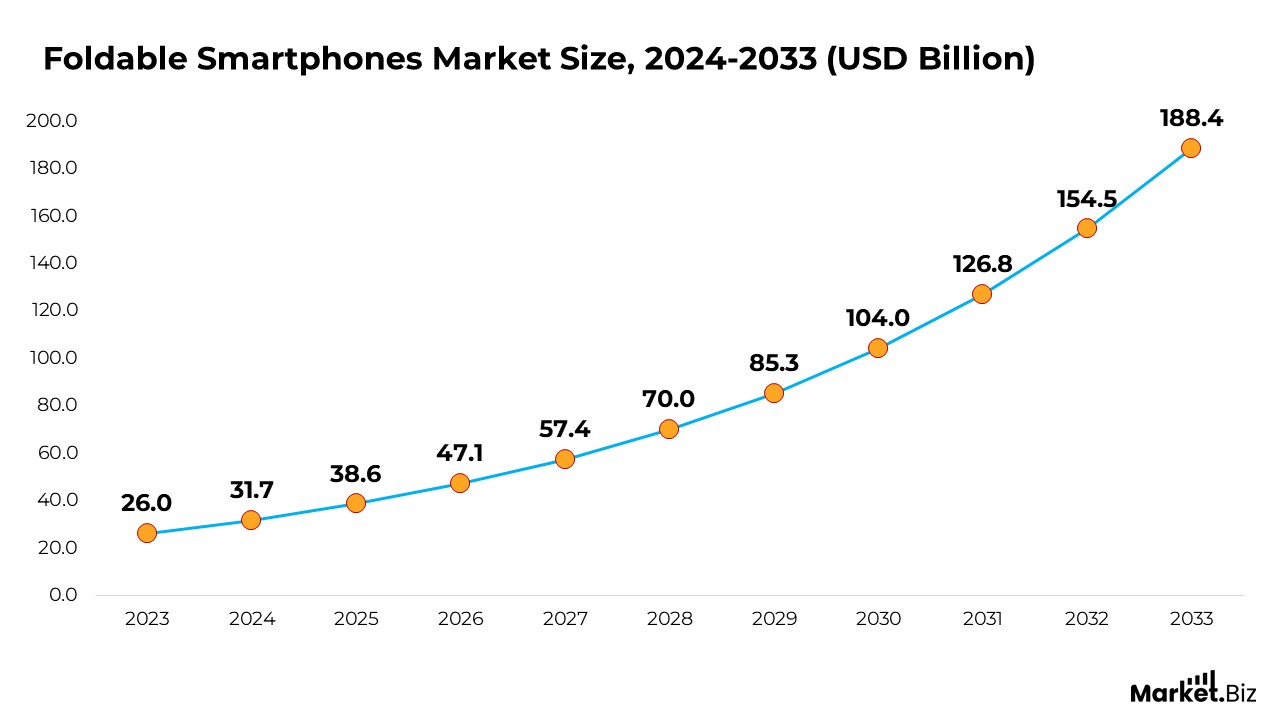
- According to Market.us, the foldable smartphones market is expected to grow from $31.7 billion in 2024 to $188.4 billion by 2033, representing a compound annual growth rate (CAGR) of 21.9% from 2024 to 2033.
- The foldable smartphone market is growing due to technological advancements and improved user interest in versatile devices. With the reduction of production costs, more manufacturers are expected to enter the market, driving competitive pricing and broader adoption.
- In 2023, the Inward Folding Smartphones segment held 62.1% of the market share, thanks to consumer preferences and technological innovations.
- Online Platforms dominated the delivery of innermost folding smartphones in 2023, with a 58.3% market share, driven by the convenience and wider availability of online shopping.
- APAC led the foldable smartphone market in 2023, capturing 45.9% of the market and generating USD 11.9 billion in revenues, reflecting the region’s dominance in this technology sector.
- Despite a 60% increase in adoption, foldable smartphones make up only 1% of total smartphones held across key markets like the UK, Germany, France, Italy, Spain, the US, and Australia.
Moreover
- 67% of foldable smartphones owned are Flip Devices, which fold in half to provide a smaller external display when closed.
- 33% of foldable smartphones are foldable devices, featuring screens that fold inward to create a greater tablet-sized screen.
- Global shipments of foldable smartphones touched 15.9 million units in 2023, marking a 25% year-on-year increase.
- Samsung led the market with over 12.5 million units shipped, followed by Huawei with 2.5 million units. Notably, 46% of US consumers prefer Samsung foldable smartphones.
- Foldable smartphone shipments are projected to increase by 38% globally in 2024.
- In Q2 2023, Huawei became the largest vender of fold-type smartphones with a 32.9% market share, but Samsung is expected to maintain its overall market leadership with a 60.4% share.
- In the US, 49% of consumers prefer flip-type foldables over book-type designs.
(Source: Market.us)
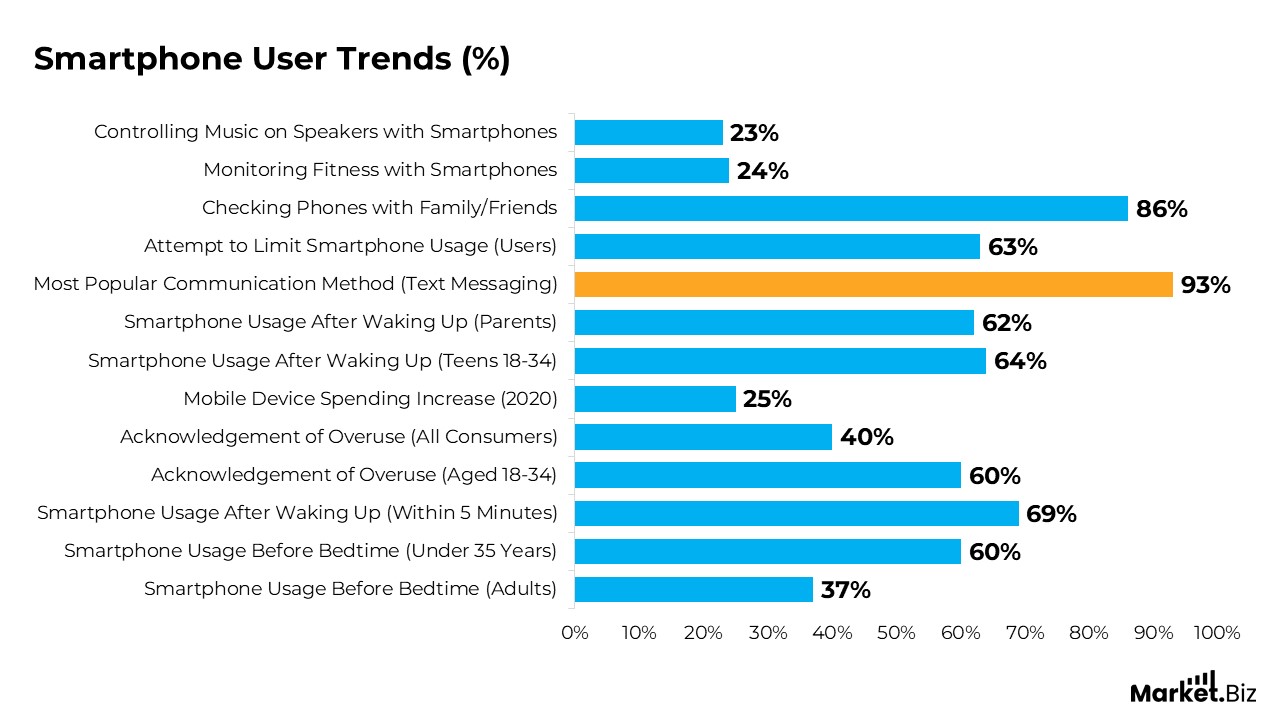
Smartphone User Trends
- On average, consumers check their smartphones 52 times a day.
- 37% of adults check their smartphones just before turning off the lights, and this increases to 60% among those under 35 years old.
- 69% of consumers check their smartphones within 5 minutes of waking up.
- 60% of individuals aged 18-34 and nearly 40% of all consumers acknowledge they use their phones too much.
- Mobile device usage has increased significantly, with consumers spending 25% more in 2020 compared to the previous year, totaling $50 billion in the first half alone.
- 64% of teens and 62% of parents use their phones within 30 minutes of waking up.
- Text messaging remains the most popular communication method, with 93% of consumers using it regularly.
- 63% of smartphone users are actively attempting to limit their phone usage.
- The average smartphone user taps, swipes, and clicks their phone 2,617 times a day.
- The top 10% of smartphone users tap, swipe, and click 5,427 times per day.
- Smartphone users check their phones every 12 minutes on average from waking up until bedtime, with those under 21 checking every 8.6 minutes.
- 86% of mobile phone users check their phones while interacting with family and friends.
- 24% of consumers use their smartphones to monitor their fitness.
- 23% of consumers use their phones to control music on speakers.
(Source: Forbes, Deloitte, DIY Genius, BankMyCell, DailyWireless, Turner, A., FinancesOnline)
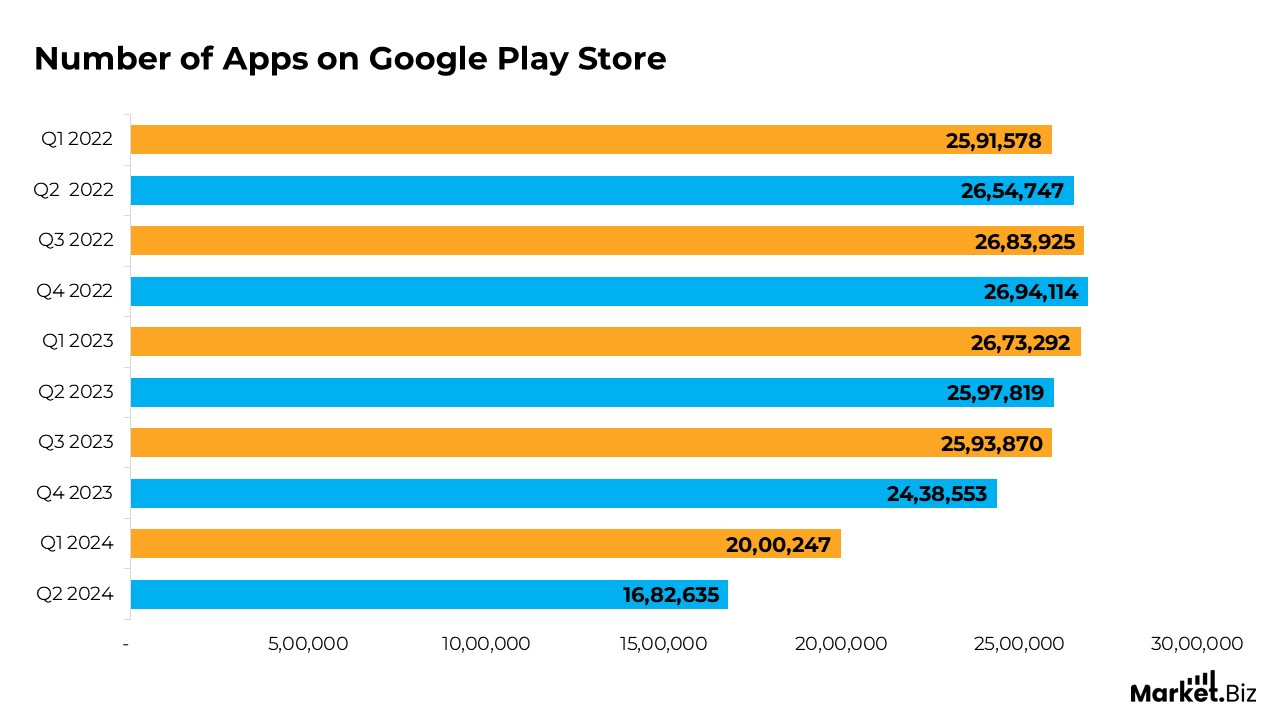
Android Apps Statistics
- There are 1.68 million apps available on the Google Play Store.
- In Q2 2024, the Google Play Store hosted 1,682,635 apps.
- Q1 2024 recorded 2,000,247 apps on the platform.
- In Q4 2023, the number of apps on the Google Play Store reached 2,438,553.
- Q3 2023 had 2,593,870 apps listed.
- Q2 2023 saw a total of 2,597,819 apps available.
- Q1 2023 had 2,673,292 apps on the Play Store.
- In Q4 2022, 2,694,114 apps were registered.
- Q3 2022 had 2,683,925 apps available.
- Q2 2022 hosted 2,654,747 apps.
- Finally, in Q1 2022, the Google Play Store had 2,591,578 apps
- TikTok is the most downloaded app on the Google Play Store worldwide, with around 24 million downloads.
- Instagram follows with 21.17 million downloads.
- WhatsApp Messenger ranks third, with 20.72 million downloads.
(Source: Statista, DemandSage)
Global Smartphone Shipments and Market Share Analysis
- Samsung shipped 60.1 million smartphones in Q1 2024, capturing 20.8% of the market share. This represents a slight 0.7% decline compared to the 60.5 million units shipped and 22.5% market share in Q1 2023.
- Apple shipped 50.1 million units in Q1 2024, securing 17.3% of the market. This marks a 9.6% decrease from the 55.4 million units shipped and 20.7% market share in the same quarter of 2023.
- Xiaomi saw substantial growth, with 40.8 million units shipped, representing 14.1% of the global market. This is a 33.8% increase from the 30.5 million units shipped and 11.4% market share in Q1 2023.
- Transition recorded a remarkable 84.9% growth, shipping 28.5 million units in Q1 2024, which accounted for 9.9% of the market. This is a significant rise from 15.4 million units shipped and a 5.7% market share in the same period last year.
- OPPO shipped 25.2 million units in Q1 2024, holding 8.7% of the market share, reflecting an 8.5% decline from 27.6 million units shipped and 10.3% market share in Q1 2023.
- Others collectively accounted for 84.7 million units in Q1 2024, securing 29.3% of the global market, showing a 7.2% growth from 79.0 million units shipped and 29.4% market share in Q1 2023.
(Source: International Data Corporation)
Global Smartphone Screen Time Statistics
- According to Q2 2024 data, people spend an average of 3 hours and 45 minutes daily using their smartphones.
- Smartphone usage varies from 1 hour and 48 minutes to 6 hours and 16 minutes per day, depending on the market.
- Mobile devices account for 56.9% of the daily internet time for users aged 16 and above worldwide.
- In Q3 2020, the average daily smartphone usage was 3 hours and 39 minutes.
- The usage increased to 3 hours and 43 minutes in Q3 2021.
- In Q3 2022, the average time spent using smartphones rose to 3 hours and 46 minutes.
- By Q3 2023, this number increased to 3 hours and 50 minutes.
- In Q1 2024, the daily average smartphone usage was 3 hours and 43 minutes.
- The average usage reached 3 hours and 45 minutes in Q2 2024.
(Source: Statista, DemandSage, DataReportal)
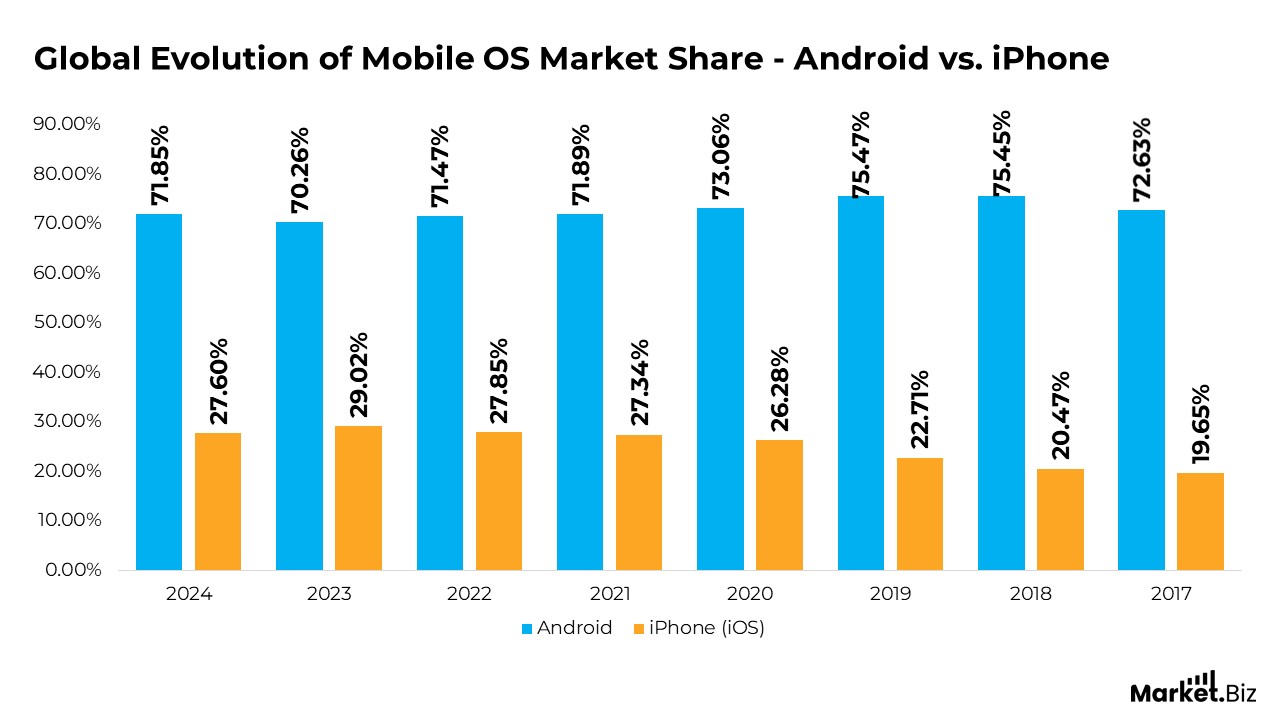
Global Evolution of Mobile OS Market Share – Android vs. iPhone
- In 2024, Android held 71.85% of the market, while iPhone (iOS) accounted for 27.6%.
- 2023 saw Android with 70.26% market share, and iPhone (iOS) with 29.02%.
- In 2022, Android’s share was 71.47%, while iPhone (iOS) maintained a share of 27.85%.
- 2021 marked Android’s market share at 71.89%, with iPhone (iOS) holding 27.34%.
- In 2020, Android captured 73.06%, while iPhone (iOS) had 26.28%.
- 2019 saw Android at 75.47%, with iPhone (iOS) at 22.71%.
- In 2018, Android continued to dominate with 75.45%, while iPhone (iOS) had 20.47%.
- 2017 showed Android with 72.63%, while iPhone (iOS) held 19.65% of the market.
(Source: International Data Corporation)
Is Your Android Phone Use Becoming an Addiction?
- China leads globally in smartphone/cell phone usage, followed by India and the United States.
- By 2025, 98% of American adults will own a cellphone, with most responding to text messages within minutes.
- 70% of people experience anxiety or fear when their handset battery drops below 20%. This condition, known as nomophobia, is particularly prevalent among college and university students.
- Around 15% of American adults are “smartphone-only” internet users, relying solely on their smartphones without traditional home internet service.
- In 2025, the average American will spend 5 hours and 16 minutes on their phone daily, marking a 14% increase from 2024.
- 50% of people feel uneasy when they leave their phone at home.
- 47% of Americans aged 18-40 are concerned about the emotional impact of phone usage on their health.
- The average smartphone owner will interact with their phone by clicking, tapping, or swiping 2,617 times a day.
Moreover
- 56% of people believe reducing phone usage would increase happiness in their relationships.
- 26% of car accidents are caused by cell phone use while driving.
- 51% of Americans in the same age group are worried about the physical health effects of their phone usage.
- 87% of smartphone users check their devices within an hour of either waking up or going to bed.
- 69% of smartphone users check their devices within the first five minutes of waking up.
- Many users try to reduce phone distractions by silencing their devices or turning off notifications. However, a Penn State study found that silencing phones increases the frequency of checking them.
- On a global scale, there are more smartphones than toilets.
- On average, people will spend 5 years and 4 months of their lifetime on social media.
- 20% of survey respondents would prefer to go without shoes for a week rather than be without their smartphones.
- Nearly 40% of consumers and 60% of people aged 18-34 admit to using their phones too much.
(Source: Slick Innovations, LLC.)
Android Phones Gaming Statistics
- The mobile gaming sector accounted for 50%, or 92 billion dollars, of the 184 billion dollars generated by all types of games in 2022.
- In 2019, 60% of the global video game market’s income came from mobile gaming.
- In 2023, the global mobile gaming market was valued at 172.10 billion dollars.
- According to mobile game producers, 73.1% of industry professionals believe competition is the biggest challenge.
- In 2022, revenue from mobile games was 92 billion dollars, showing a 6.4% YoY decrease.
- Over 155 million people in the United States play mobile games, expressive additional than 46% of the US population.
- In a September 2020 global survey, 78% of people in Thailand reported playing games on their mobile devices, making it the country with the largest mobile gaming reach. The Philippines ranked second with 77%.
- As of October 2022, 51% of American mobile gamers used iPhones, while 40% used Android smartphones.
- As of Q4 2022, there were 295,676 mobile games available on the App Store.
- By 2030, mobile gaming is projected to generate 270 billion dollars, accounting for more than 50% of the global gaming industry’s revenue.
- 64% of mobile gamers are between the ages of 18 and 34.
- In 2022, mobile game ad revenue for sports games declined by 14%.
- On Android, there are approximately 500,000 mobile game applications available.
- Men represent 45% of mobile gamers, while women make up 55%.
- In 2021, US income from mobile game ads reached 5.49 billion dollars and is expected to increase to around 7.9 billion dollars by 2024.
- Playing mobile games makes up 8% of all mobile usage time.
- There are 2.2 billion mobile gamers worldwide.
(Source: Gitnux, Udonis, Zippia, Go-Globe, Statista, PlayToday.co)
Conclusion
The Android smartphone market continues to experience robust growth, with dominant market shares held by top brands like Samsung, Apple, and Xiaomi. The sector faces heightened competition, fueled by rapid technological progress and growing consumer demand for advanced features such as 5G connectivity, improved camera capabilities, and extended battery life.
Moreover, the market is expected to expand further, particularly in emerging regions. Despite challenges like intensifying competition and supply chain constraints, the Android smartphone market remains adaptable, poised for ongoing innovation and adoption.
Future trends are expected to center around AI integration, foldable devices, and environmentally sustainable manufacturing practices.
FAQ’s
The top players in the Android smartphone market are Samsung, Xiaomi, OPPO, Vivo, and Realme. Among these, Samsung and Xiaomi hold the largest shares.
The Android smartphone market is experiencing significant growth, fueled by rising demand for 5G-capable devices, improved camera capabilities, longer battery life, and advancements in technologies such as AI and foldable screen innovations.
The Android smartphone market is seeing rapid expansion in emerging markets like Asia-Pacific, Latin America, and Africa, where affordability and accessibility of devices are key factors driving adoption.
The Android smartphone industry faces challenges such as intense competition among manufacturers, component shortages, disruptions in supply chains, and the rising cost of production, all of which may affect pricing and profit margins.
While both the Android and iOS markets are growing, Android maintains a larger global market share, largely due to its broader range of devices, affordability, and availability in various regions.
The future of the Android smartphone market appears promising, with continued growth anticipated in 5G adoption, AI integration, the rise of foldable phones, and innovations in battery and camera technologies.