
Introduction
Internet Usage Statistics: In recent years, the growth of global internet usage has significantly transformed industries and everyday life. This rapid expansion has been driven by advancements in technology, greater mobile access, and the increasing availability of high-speed networks. The deployment of 5G has further amplified the demand for digital services and content, enriching the online experience.
The internet has evolved from a communication tool to a vital resource for business, education, entertainment, and more. The pandemic accelerated the shift to remote work and digital learning, reinforcing the internet’s crucial role in modern society. As internet connectivity continues to expand, particularly in emerging markets, the challenge of bridging the digital divide persists. However, the growing global reach of the internet underscores its essential role in shaping existing life.
Editor’s Choice
- Around 4.9 billion individuals, or 63% of the global population, were using the internet in 2021.
- Mobile devices (excluding tablets) accounted for nearly 63% of global website traffic in the final quarter of 2024.
- Streaming services saw continued growth, with more than 1.1 billion users subscribing to video-on-demand platforms.
- Younger generations, especially those aged 16 to 24, were the most active online, dedicating substantial time to social media, streaming, and gaming.
- In the U.S., 40% of individuals with an annual income below USD 30,000 had broadband access at home, 57% were internet users, and 75% owned a cellphone.
- By 2021, social media platforms had attracted over 4.2 billion users worldwide.
- On average, individuals aged 16 to 64 spend 6 hours and 35 minutes online daily.
- Mobile devices account for 53-55% of global internet traffic, surpassing all other platforms.
(Source: United Nations Digital Library System, International Telecommunication Union, Statista, Global Digital Insights, WPShout)
Internet Service Provider (ISP)Market Size
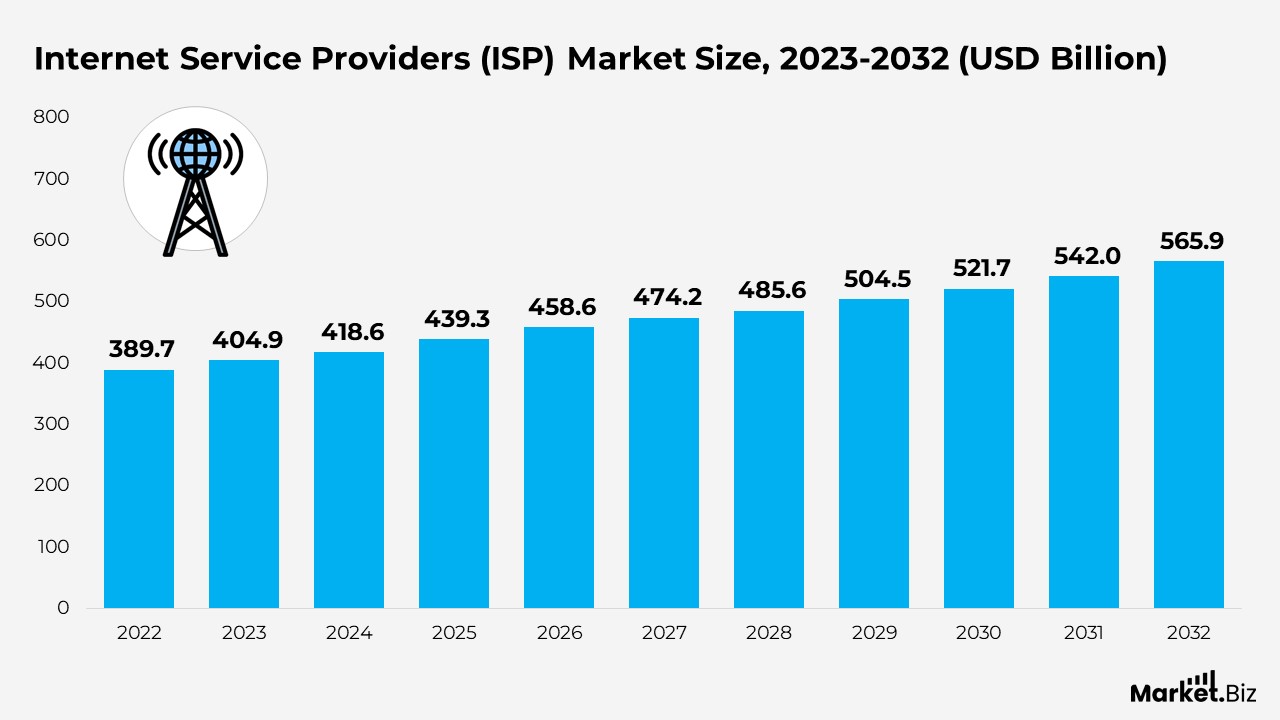
- According to Market.us, the internet service provider (ISP) market is projected to grow from $404.9 billion in 2023 to $565.9 billion by 2032, representing a compound annual growth rate (CAGR) of 3.90% from 2023 to 2032.
- The market growth is fueled by rising demand for high-speed internet driven by digital transformation and the expansion of 5Gcloud services networks.
- The growing adoption of cloud services and streaming media supports the demand for reliable and fast internet connections, and cybersecurity
- The Installation Service Segment is expected to be the most profitable segment in the market.
- Online e-trading is a significant contributor to the profitability of the ISP market, driven by the increasing demand for high-speed internet for e-commerce transactions.
- North America remains a competitive market for ISP installation services, driven by the consistent demand for high-speed internet connections.
(Source: Market.us)
Internet of Behaviors Market Size
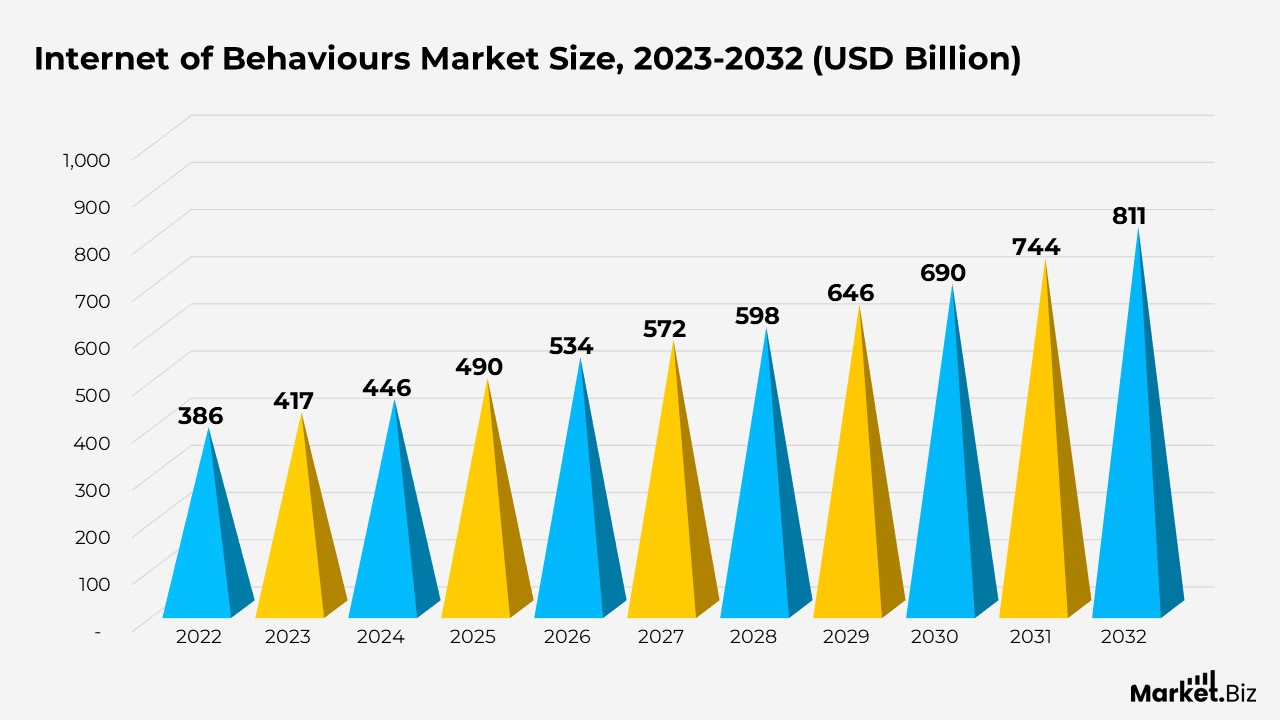
- According to Market.us, the Internet of Behaviors market is projected to grow from $417 billion in 2023 to $811 billion by 2032, representing a compound annual growth rate (CAGR) of 23% from 2023 to 2032.
- The growth of the Internet of Behaviors (IoB) market is driven by the rise of the Internet of Things (IoT), enhancing customer experiences and analytics.
- The digital marketing segment leads the market with a 35% revenue share, using data to promote sales and generate leads.
- Small & medium enterprises (SMEs) hold the largest market share of 59%, with a high adoption rate of IoT-based technologies.
- The Asia Pacific region dominates the market, accounting for a 36% revenue share, and is expected to maintain this dominance, driven by increased cloud investments and innovative behavioural analysis strategies.
(Source: Market.us)
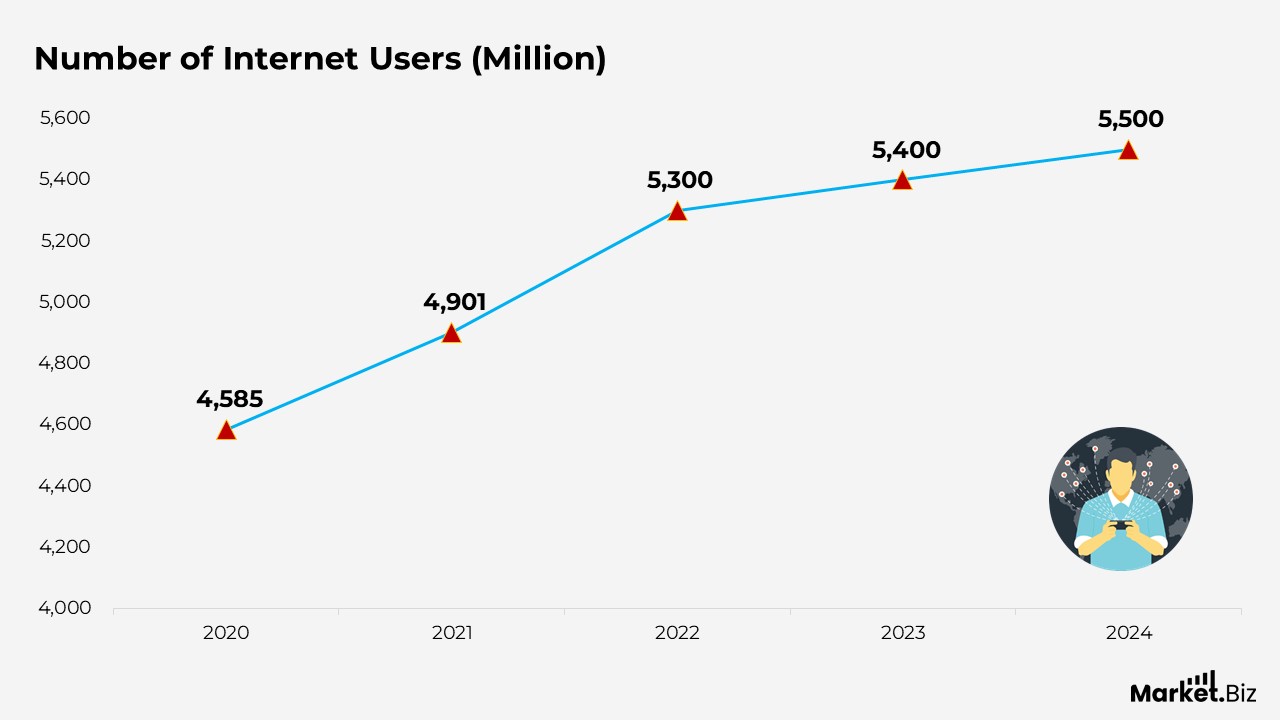
Internet Usage Statistics
- As of February 2025, there were 5.56 billion internet users globally, representing 67.9% of the world’s population. Of these, 5.24 billion, or 63.9%, were active social media users.
- By 2024, the global number of internet users had reached 5.5 billion, up from 5.3 billion in 2023, accounting for 68% of the global population.
- Approximately 4.8 billion people, or 59.9% of the global population, were actively engaged on various social media platforms.
- As of February 2025, 99% of the populations in the Netherlands, Norway, and Saudi Arabia were internet users.
- Northern Europe topped global regions in 2025 with the highest percentage of internet users.
- In contrast, North Korea had the lowest internet penetration rate globally, with near-zero usage among its population.
- Eastern Asia had the largest number of online users globally, with over 1.34 billion, followed by Southern Asia, with around 1.2 billion. China, India, and the United States lead in total internet users.
- As of October 2024, the Netherlands, Norway, Saudi Arabia, and the UAE had the highest internet penetration rates, with 99% of their population online.
- Fixed broadband subscriptions in the Asia-Pacific region reached approximately 848 million in 2023, marking an increase of nearly 50 million from the previous year.
Moreover
- Between 2000 and 2024, global internet usage surged by 1,482%.
- In the United States, broadband internet is the most prevalent form of internet access.
- English is the most widely used language on the internet, comprising 25.9% of online content, followed by Russian at 5.3% and Spanish at 4.3%.
- In 2023, there were approximately 1.5 billion fixed broadband subscriptions worldwide, up from 1.4 billion in 2022.
- The Asia-Pacific region accounted for about 848 million fixed broadband subscriptions in 2023, marking an increase of nearly 50 million from the previous year.
- From 2000 to 2024, internet use grew by 1,482%.
- The Middle East has experienced a 6,141% increase in internet usage since 2000.
- South Africa has the highest average daily internet usage, with users spending more than 9 hours and 24 minutes online each day.
- The number of internet users in Australia is expected to surpass 23.3 million by the end of 2025, though the country’s internet penetration rate has remained relatively stagnant over the past 5 years.
- More than 2.5 billion people worldwide still lack internet access.
- Broadband internet is the most common type of internet access in the United States.
- The most widely spoken language on the internet is English, comprising 25.9% of online content, followed by Spanish (4.3%). and Russian (5.3%)
- 32% of internet users worldwide are between the ages of 25 to 34.
(Source: Statista, WPBeginner LLC, The University of Maine)
Internet Usage Facts
- Over the past decade, daily internet usage has increased by more than 60%. In 2012, the average person spent only 90 minutes online each day, while by 2025, this figure has risen to 6 hours and 40 minutes daily, equivalent to 47 hours per week.
- American internet users have some of the highest weekly usage rates, often surpassing the global average.
- The advent of smartphones has transformed how people access the internet, making it more accessible to a broader audience.
- From 2021 to 2025, more than 700 million new smartphone users joined the global market, pushing the total number of smartphone users to exceed 7 billion.
- The surge in smartphone usage has contributed to the growth of mobile internet traffic, increasing its share from 52% to 63% over the past five years.
- It is expected that by 2030, 73% of global smartphone users will access the internet exclusively through their mobile devices.
(Source: World Population Review)
Web Search Statistics
- As of December 2024, 64.41% of global internet users preferred the Chrome browser, followed by Safari at 18.82%, Microsoft Edge at 5.36%, and Firefox at 3.3%.
- The share of traffic from organic channels has grown to 53.3%.
- The top three most visited websites on the internet are Google.com, YouTube.com, and Facebook.com.
- The Google Search Index contains hundreds of billions of pages, accumulating to over 100,000,000 gigabytes in size.
- Google remains the leading search engine, commanding 91.47% of the market, with Bing holding a distant 3.24% share.
- Google processes around 99,000 search queries every second, equating to about 8.5 billion searches daily and roughly 2 trillion searches annually.
- As of March 2025, Google accounted for 79.1% of the global online search engine market on desktop devices.
- With the average person conducting 3 to 4 searches daily, it’s clear that 100 million people rely on Google each day, processing 8.5 billion searches globally every day.
(Source: Statista, WPBeginner LLC., Google, Ran Van Veen, BrightEdge, SEO.AI)
What devices do people use to connect to the internet?
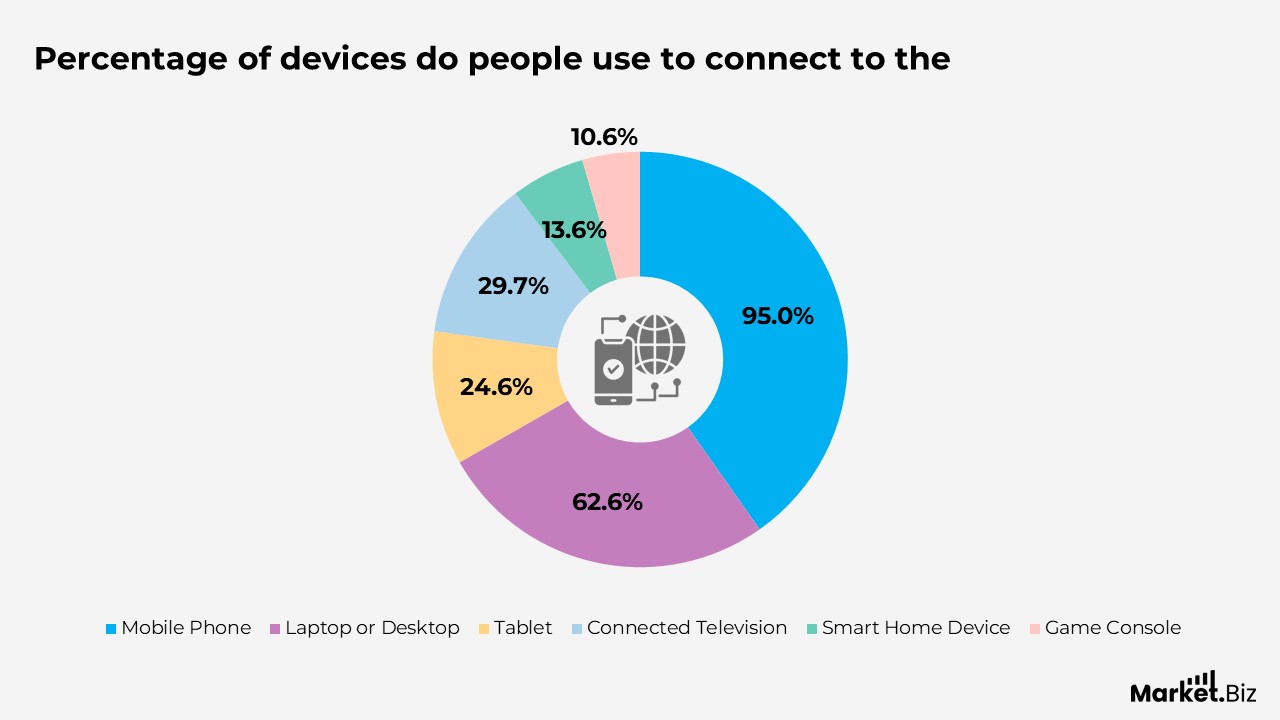
(Source: WPShout)
Mobile Internet Usage Statistics
- By mid-2024, it was estimated that over 96% of the worldwide digital population used mobile devices to connect to the internet.
- By 2024, the U.S. had 401 million mobile internet connections. Mobile devices account for 61.5% of global internet traffic, highlighting the growing dominance of mobile internet.
- In 2025, the average smartphone will consume 23.78GB of mobile data per month.
- A total of 106.2 exabytes of mobile data will be used monthly by 2025.
- During Q2 2024, global users spent nearly 60% of their online time browsing the web via mobile phones.
- 62.5% of global internet traffic is attributed to mobile devices, with mobile-first markets like Asia and Africa seeing even higher shares of web traffic.
- In the Asia-Pacific region, mobile internet users reached 1.1 billion in China and 1.05 billion in India in 2024.
- Over 62% of mobile internet users prefer to browse the web using Google Chrome.
- 5G is expected to cover more than 45% of the global population by the end of 2023 and 85% by 2029.
- Android continued to dominate the mobile operating system market in Q1 2025 with a market share of 71.88%.
- In 2024, TikTok remained the most downloaded mobile app globally, with 825.5 million downloads.
- Mobile internet usage penetration is projected to reach 87.01% by 2025.
(Source: Keywords Everywhere, Digital Silk, Statista, Light Reading)
Internet Usage Trends by Income Level
A clear connection exists between income and internet usage, with higher income levels linked to increased access to and engagement with digital technologies.
- For individuals earning below USD 30,000 annually, 40% have broadband access at home, 57% use the internet, and 75% own a cellphone.
- Among those with annual earnings between USD 30,000 and 49,999, internet and technology usage increases, with 64% having home broadband, 80% being internet users, and 90% owning a cellphone.
- As of 2024, countries with high income had the highest internet penetration rate, reaching 93%.
- In the USD 50,000 to 74,999 income range, 79% have home broadband, 86% use the internet, and 93% possess a cellphone.
- At the highest income level, above USD 75,000, 95% use the internet, 87% have broadband at home, and 95% own a cellphone.
(Source: Pew Internet & American Life Project, Statista)
Social Media Internet Usage
Social media remains a key platform globally, shaping online interactions, brand research, and influencing purchasing decisions.
- In 2022, 15.7% of individuals aged 16-64 preferred WhatsApp as their primary social media platform.
- Almost 100% of consumers planned to make purchases through social media platforms in 2022.
- Nearly 100% of Gen Z used social media to conduct brand research in 2022.
- Users in the UK spent the most time on TikTok, averaging 27.3 hours per month as of January 2022.
- On average, social media users spent 2.5 hours daily on platforms in 2022
- Facebook had 20.9 million users in Canada at the start of 2022.
- Twitter users posted more than 230 billion tweets throughout 2022.
- Of the 5.35 billion internet users globally, 5.04 billion (over 94%) are social media users.
- In 2023, more than 200 billion tweets were posted on Twitter/X.
- Over 200 billion photos were uploaded to Instagram in 2023.
- 2.9 trillion videos were viewed on YouTube in 2023.
- Social media usage has increased by nearly 30%, adding more than 1 billion new users since the beginning of the pandemic.
- Worldwide spending on social media ads more than doubled since the pandemic, reaching $226 billion in 2022.
- There are over 4.5 billion email accounts registered by internet users worldwide, 551 million more than in 2019.
- On average, 347.3 billion emails were sent each day throughout 2023.
- 60% of consumers prefer to be contacted by brands through email.
- 99% of email users check their email every day, with some checking it up to 20 times a day.
- 58% of users check their email before they check social networking sites or the news.
- 40% of people 18 years old and under first open an email on a mobile device.
(Source: vpnAlert, Statista)
Online Shopping Trends
Online shopping has become a mainstream activity, with most consumers turning to the internet for research before making a purchase. Here are some key statistics:
- Globally, 46.9% of online shoppers are women, while 53.1% are men. Worldwide, 77.0% of women and 84.3% of men engage in online shopping.
- Among U.S. eCommerce shoppers in 2023, the largest group was 18-24-year-olds, making up 46.9%, followed by 25-34-year-olds at 32%.
- In the United States, 300 million people shopped online in 2023, representing 91% of the country’s population.
- 59% of shoppers conduct online research before purchasing to ensure they are making the best decision.
- Nearly 70% of users admit to engaging in window shopping for enjoyment on their smartphones.
- In 2023, there were 300 million online shoppers in the United States, which accounts for 91% of the country’s total population.
- The number of American shoppers is expected to grow by 50.7 million users (+17.92%) between 2024 and 2028.
Moreover
- The leading countries in eCommerce revenue are the United States ($1,163 billion), the UK ($196 billion), China ($3,024 billion), and Japan ($193 billion).
- 46.9% of online shoppers are women, while 53.1% are men. Globally, 77.0% of women and 84.3% of men shop online.
- In 2023, the largest group of eCommerce shoppers in the U.S. was 18-24-year-olds with 46.9% of the share, followed by 25-34-year-olds with 32%.
- 59% of shoppers do research online before making a purchase to ensure they are making the best choice.
- 83% of in-store shoppers searched online before visiting physical stores, looking for details like store locations, product availability, business hours, directions, and contact information.
- Nearly 70% of users admit to window shopping for fun on their smartphones.
- 77% of these digital window shoppers make impulse purchases. If they don’t purchase immediately, 70% will return within the first hour to complete the purchase from their device.
(Source: Pixel Union, Deloitte, WPBeginner LLC.)
Countries with the Highest Number of Internet Users
| Countries | Number of Internet Users 2024 |
|---|---|
| China | 1.1B |
| India | 881.3M |
| United States | 311.3M |
| Indonesia | 215.6M |
| Pakistan | 170M |
| Brazil | 165.3M |
| Nigeria | 136.2M |
| Russia | 129.8M |
| Bangladesh | 126.2M |
| Japan | 117.4M |
(Source: World Population Review)
Demographics of Internet Usage
Age
- 97% of individuals aged 18 to 29 use the internet.
- 98% of people aged 30 to 49 are internet users.
- 96% of individuals in the 50 to 64 age group access the internet.
- 88% of people aged 65 and over use the internet.
(Source: Pew Research Center, DemandSage)
Gender
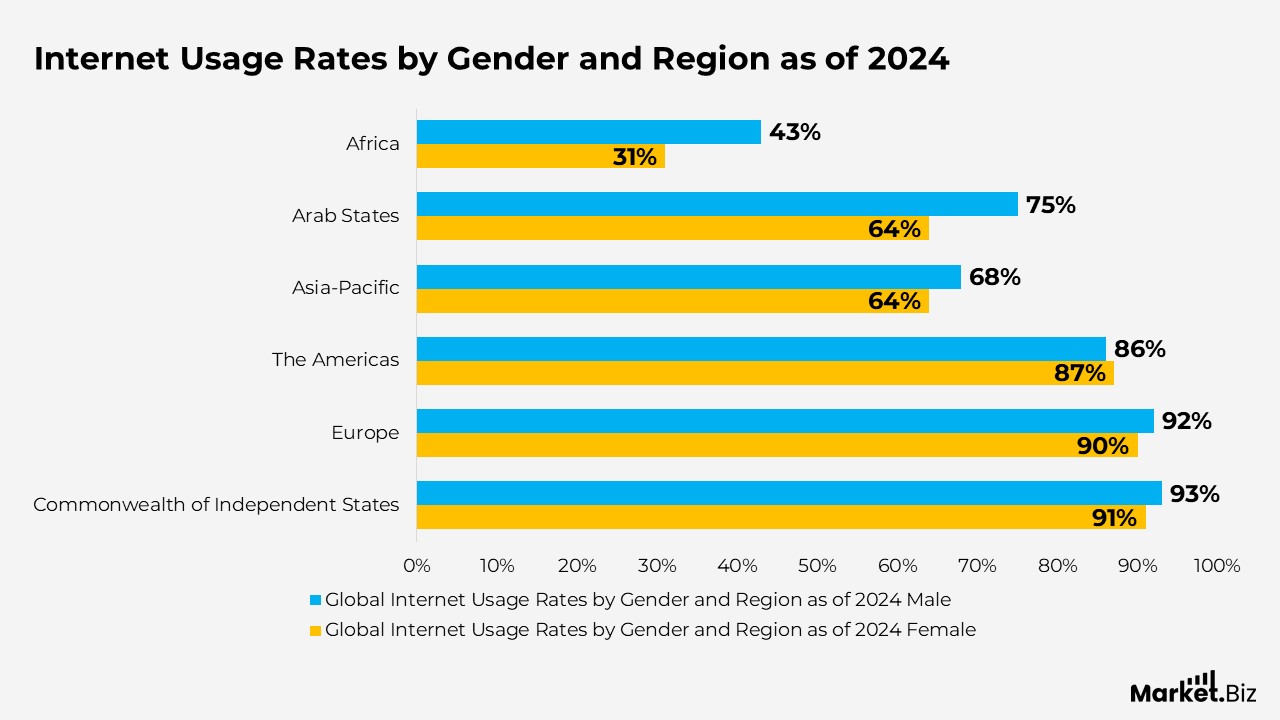
- In 2024, the CIS region (Commonwealth of Independent States) had the highest internet usage globally, with 91% of women and 93% of men accessing the internet.
- In the same year, Europe ranked 2nd in global internet usage, with 90% of females and 92% of males online.
- In Africa, 4% of women had internet access, while 45% of men used the internet.
- In the Arab States, 65% of women and 75% of men had access to the internet.
- By 2022, Africa had the lowest online access rate globally, with just over 30% of the population using the internet.
(Source: Statista)
Internet Security Insights
Cybersecurity remains a critical issue, with numerous sectors facing significant threats.
- 3 sectors were responsible for nearly 59% of all cyberattacks in 2022.
- By 2023, the global number of connected devices was projected to reach approximately 15.14 billion.
- Every day, more than 30,000 websites are compromised in cyberattacks.
- WordPress emerged as the most vulnerable CMS, making up 95.6% of all hacked websites.
- Over 15 million registered records were lost or stolen globally in2022 due to daily data breaches.
- It’s estimated that cybercrime will cost the global economy around $8 trillion by 2023.
- Nearly 95% of piracy activities in 2022 took place on unlicensed streaming platforms.
- Men were more likely to engage in catfishing, with 38% pretending to be someone else online, compared to 23% of women in 2022.
(Source: Statista, Garbo, Variety, Forbes, Exploding Topics, Data Prot)
Recent Developments
Emerging Technologies:
- The integration of blockchain technology into online transactions bolstered security and transparency, driving a 20% rise in blockchain-based applications.
- The adoption of virtual reality (VR) and augmented reality (AR) technologies in gaming and entertainment created immersive experiences, drawing in a younger audience of internet users.
Regulatory Changes:
- The introduction of stringent data privacy regulations directed to a 25% reduction in targeted ads across digital platforms.
- The implementation of net neutrality laws ensured fairer access to online content, fostering more equitable internet usage for consumers.
Technological Advancements:
- The rollout of 5G technology significantly boosted internet speeds, with some urban areas seeing an average 50% increase in download speeds.
- The use of AI-powered algorithms by content platforms enhanced content discovery, resulting in a 15% increase in user engagement on average
Conclusion
Internet usage continues to grow at an impressive rate, with billions of people globally relying on it for a wide range of activities, including communication, social media, e-commerce, and entertainment. The expansion of mobile internet and the rollout of 5G networks are driving this growth, enhancing the user experience and facilitating seamless digital interactions.
Despite this global growth, regional differences persist, with regions like Northern Europe and the Netherlands achieving nearly universal internet access while others, such as North Korea, have limited internet usage. The widespread use of social media, rapid growth in broadband subscriptions, and the increasing significance of the internet in business and education emphasize its vital role in today’s world.
As technology evolves, the internet’s future looks set for continued growth, helping to close gaps and enabling greater participation from people and regions worldwide in the digital era.
FAQ’s
As of February 2025, around 5.56 billion people, or 67.9% of the world’s population, were using the internet.
Mobile devices make up approximately 53-55% of global internet traffic, making them the dominant platform for online access.
As of October 2024, the Netherlands, Norway, Saudi Arabia, and the United Arab Emirates boast 99% internet penetration.
People aged 16 to 24 are the most active online, engaging in various activities such as social media, streaming, and gaming.
Between 2000 and 2024, global internet usage surged by 1,482%, marking a significant digital transformation.
English is the most common language online, accounting for 25.9% of internet content, followed by Russian (5.3%) and Spanish (4.3%).