
Introduction
Mobile Commerce Statistics: Mobile commerce (m-commerce) has swiftly revolutionized the retail sector, enabling consumers to shop, pay, and access various services directly through their smartphones. With the increasing prevalence of mobile devices and the development of mobile applications and secure payment systems, m-commerce has become a core aspect of everyday life.
Consumers are now relying on their phones not only for communication but also for conducting transactions, banking, and enjoying entertainment. As mobile connectivity improves and businesses continue to embrace mobile-first strategies, m-commerce is expected to expand further, changing how consumers interact with brands and make purchases.
This transformation is fueled by the convenience of mobile Shopping, customized experiences, and the adoption of secure payment methods like mobile wallets, which streamline transactions. As the mobile ecosystem progresses, m-commerce is increasingly vital in shaping the global digital economy.
Editor’s Choice
- 30% of the global digital population shops via mobile devices, equating to approximately 1.65 billion mobile shoppers.
- Consumers worldwide collectively spend more than 41.9 billion hours on shopping apps.
- In the United States, around 76% of adults make purchases using their smartphones.
- By 2025, mobile commerce is projected to account for 75% of all e-commerce sales.
- 73% of online shoppers prefer using mobile apps over websites for their shopping experiences.
- Global m-commerce revenue is expected to reach USD 6.5 trillion by 2025.
- 82% of smartphone users have made a purchase on their mobile device within the last six months.
- Mobile wallets, such as Apple Pay and Google Pay, now drive 60% of digital transactions globally.
- The average annual spend of a mobile shopper is around USD 2,500.
- Mobile conversion rates have grown by 30% over the past two years.
- In 2023, 70% of online orders in the UK were placed via mobile devices.
- Global consumer spending on mobile devices is expected to reach USD 3.2 trillion by 2026.
- So far in 2024, 70% of m-commerce purchases have been made through mobile apps rather than mobile websites.
- Mobile wallets are projected to account for over 50% of e-commerce payments by 2027.
- The conversion rate for mobile shoppers in 2023 was 2.25%, the lowest compared to other devices like tablets (4.06%) and desktops (4.81%).
- Growing trends in the m-commerce space include one-click payments, mobile-optimized websites, and social commerce, where social media platforms are used to sell products.
General Mobile Commerce Statistics
- 50.9% of weekly online shoppers prefer mobile Shopping over other methods.
- 8% of consumer e-commerce spending is made through mobile phones.
- Amazon’s mobile app had 197 million monthly users in 2022.
- In the U.S., 73% of e-commerce transactions are conducted through mobile devices.
- 16 billion people made digital payments globally.
- Mobile phones accounted for 59.8% of e-commerce spending last year, marking a 1.2% increase from the previous year.
- Fashion retailers boast an impressive 89.3% conversion rate for mobile traffic turned into sales.
- Mobile cart abandonment rates average 69.02%, while desktop devices see a lower rate of 62.11%. The main reasons for mobile abandonment include poorly optimized websites and apps, security concerns, and excessive add-ons.
- 44% of travel industry sales are completed via mobile devices.
- 69.4% of internet users use at minimum 1 mobile shopping app on their devices.
- The mobile payment platform market in the U.S. grew by 24% over the last three years, adding 15.5 million new users. This surge is attributed to improved accessibility, security, and convenience.
(Source: SupplyGem, Statista)
Digital Commerce Market Size
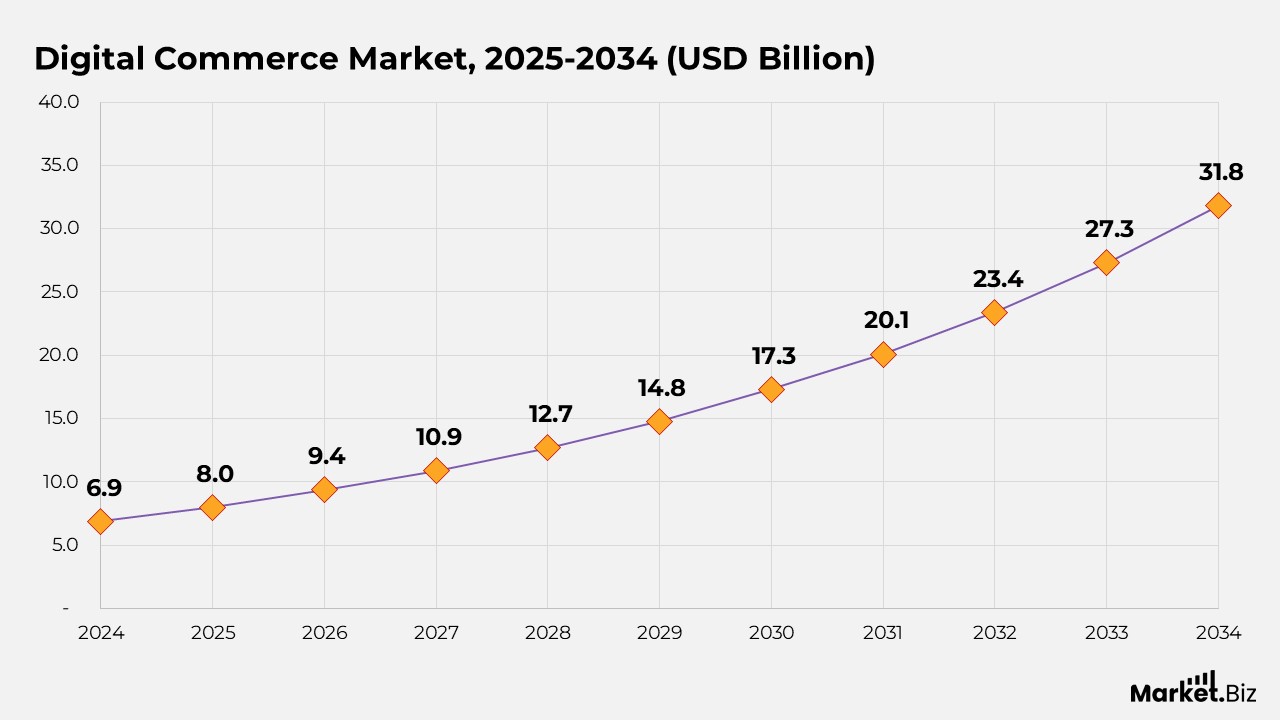
- According to Market.us, the digital commerce market is expected to rise from $8.0 billion in 2025 to $31.8 billion by 2034, representing a compound annual growth rate (CAGR) of 16.5% from 2025 to 2034.
- The digital commerce market growth is fueled by technological advancements and shifting consumer behaviors, emphasizing personalization and customer engagement.
- In 2024, the Digital Wallets segment dominated the market with a share exceeding 50%, driven by changing consumer preferences.
- The Solutions segment held more than 62.5% of the market in 2024, as businesses rely on digital commerce solutions for effective online operations.
- The Mobile and Tablets segment led the market with a share of over 65.7% in 2024, spurred by widespread smartphone and tablet adoption.
- In 2024, the Business to Business (B2B) segment captured more than 59.6% of the market, fueled by high transaction volumes and rapid digital transformation.
- The Automotive segment held over 31% of the digital commerce market in 2024, supported by key growth drivers in the sector.
- In 2024, the Asia-Pacific (APAC) region led the market with a dominant share of 56.7%, generating approximately USD 3.9 trillion in revenue.
- APAC’s significant market share is attributed to rapid digital adoption, a growing middle class, and increased smartphone and internet penetration in countries like China and India.
- The Automotive sector was the leading vertical, capturing over 31% of the digital commerce market in 2024.
(Source: Market.us)
Subscription-based E-commerce Market Size
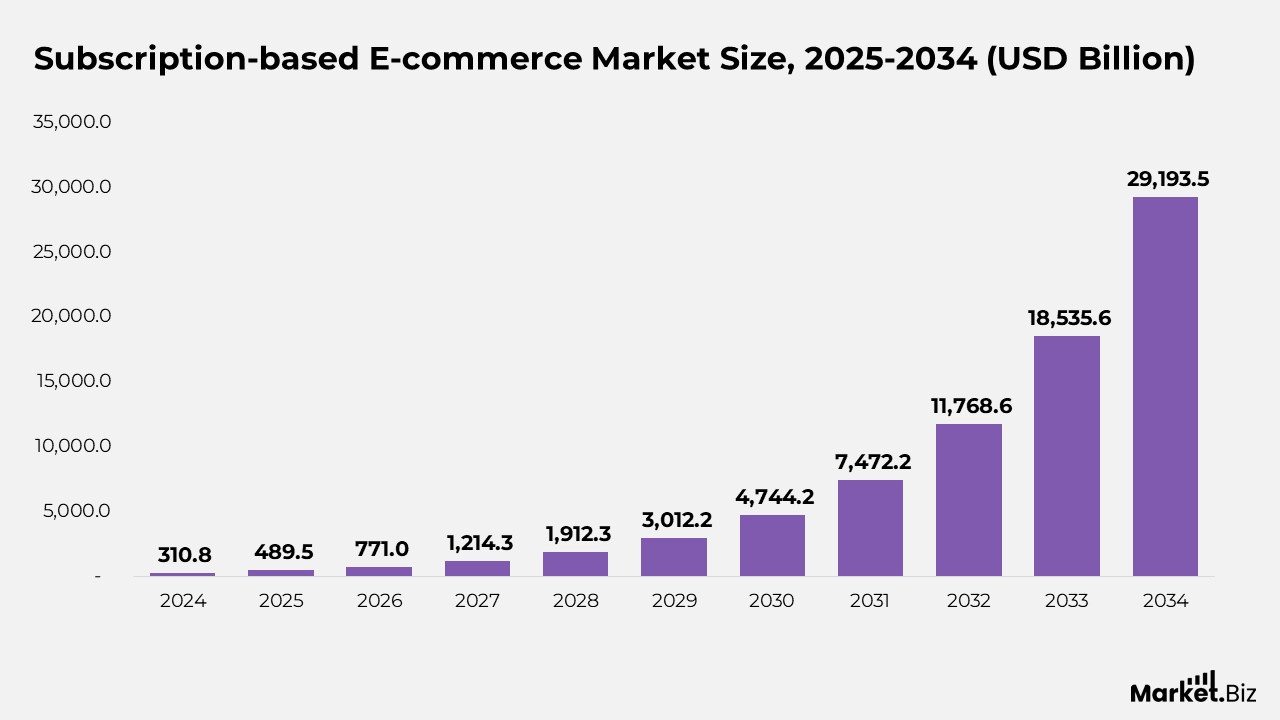
- According to Market.us, the subscription-based e-commerce market is expected to grow from $489.5 billion in 2025 to $29,193.0 billion by 2034, representing a compound annual growth rate (CAGR) of 57.5% from 2025 to 2034.
- Market growth is driven by changing consumer preferences and technological advancements, particularly among millennials and Gen Z, who prioritize convenience, flexibility, and personalization.
- In 2024, the Replenishment Subscription Model dominated the market, capturing more than 45% of the subscription-based e-commerce market, driven by consumer demand for convenience and consistency.
- The Food & Beverage segment led the subscription-based e-commerce market in 2024, holding over 30% of the market, driven by the growing demand for convenience and quality in dietary choices.
- The U.S. subscription-based e-commerce market was valued at approximately USD 119.5 billion in 2024, with a projected CAGR of 52.8%, reflecting rapid growth in sectors like entertainment, food, and personal care.
- North America held over 41% of the subscription-based e-commerce market in 2024, generating approximately USD 127 billion, due to factors supporting robust growth and adoption of subscription services.
- Subscription services help build customer loyalty through regular product or service deliveries, with emotionally connected customers having 306% higher lifetime value than satisfied ones.
- Subscription commerce simplifies Shopping by offering convenience and personalization, with 29% of consumers opting for retail subscriptions. The top four platforms are Target, Walmart, Amazon, and Panera Bread.
(Source: Market.us)
Mobile App Downloads and Consumer Preferences Statistics
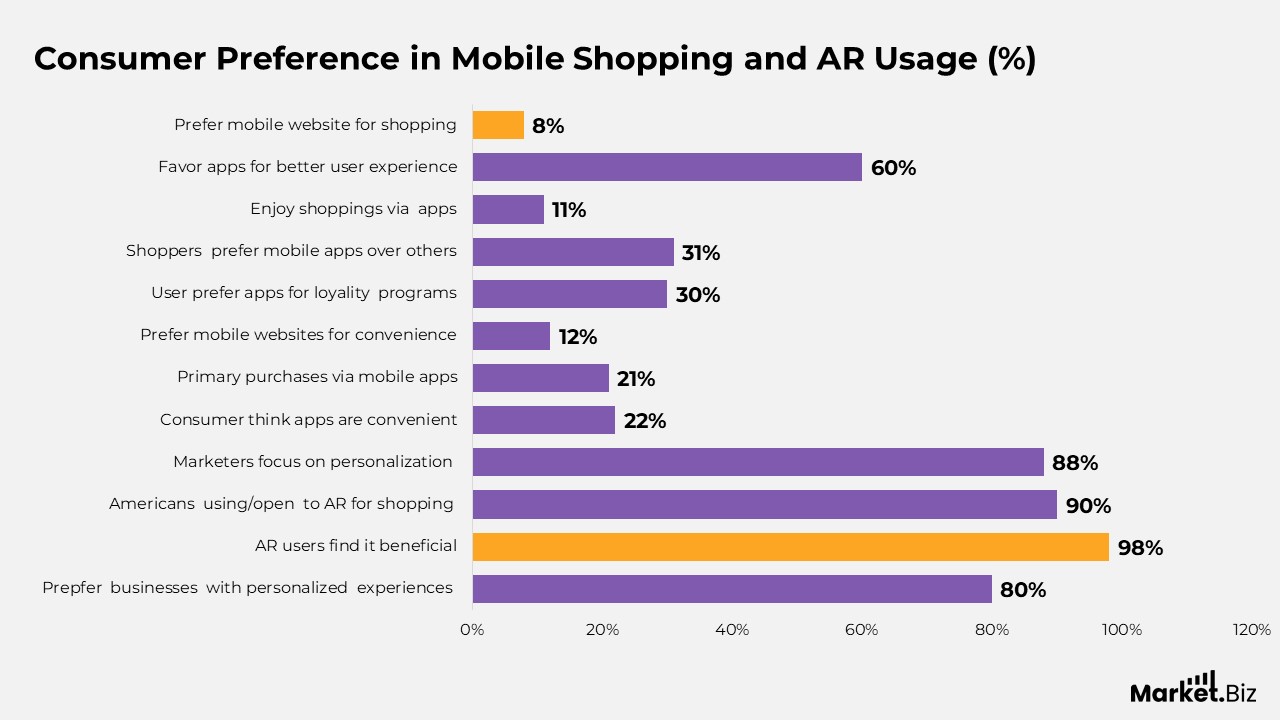
- 80% of consumers are more inclined to make purchases from businesses offering personalized experiences.
- 98% of AR users consider augmented reality to be beneficial during their shopping experience.
- Over 90% of Americans are either using or open to using Augmented Reality (AR) for shopping purposes.
- 88% of marketers are focusing on personalization as a way to improve the customer experience.
- China leads the global mobile app market with 362 million downloads.
- 22% of consumers believe mobile apps offer the most convenient shopping experience.
- 21% of consumers primarily make e-commerce purchases through mobile apps, while 17% opt for mobile web stores.
- Only 12% of people think mobile websites provide the most convenient way to shop.
- 30% of users prefer apps due to superior loyalty programs, while 23% cite better customer service as a key factor.
- 31% of shoppers prefer using a mobile app for Shopping over in-store, desktop, or mobile web alternatives.
- 11% of consumers enjoy shopping through e-commerce apps the most, 37.5% higher than the preference for mobile websites.
- 60% of users favor apps for a better user experience, while 51% appreciate better promotions or discounts, and 30% are drawn to exclusive products.
- Only 8% prefer mobile websites, a significant 83.3% less than the preference for Shopping on computers.
(Source: Gauss, Data Portal, Statista, Influencer Marketing Hub)
Global Trends in Mobile Shopping
- In 2022, shoppers worldwide dedicated an impressive 108 billion hours to shopping apps, reflecting a 9.1% increase from the previous year.
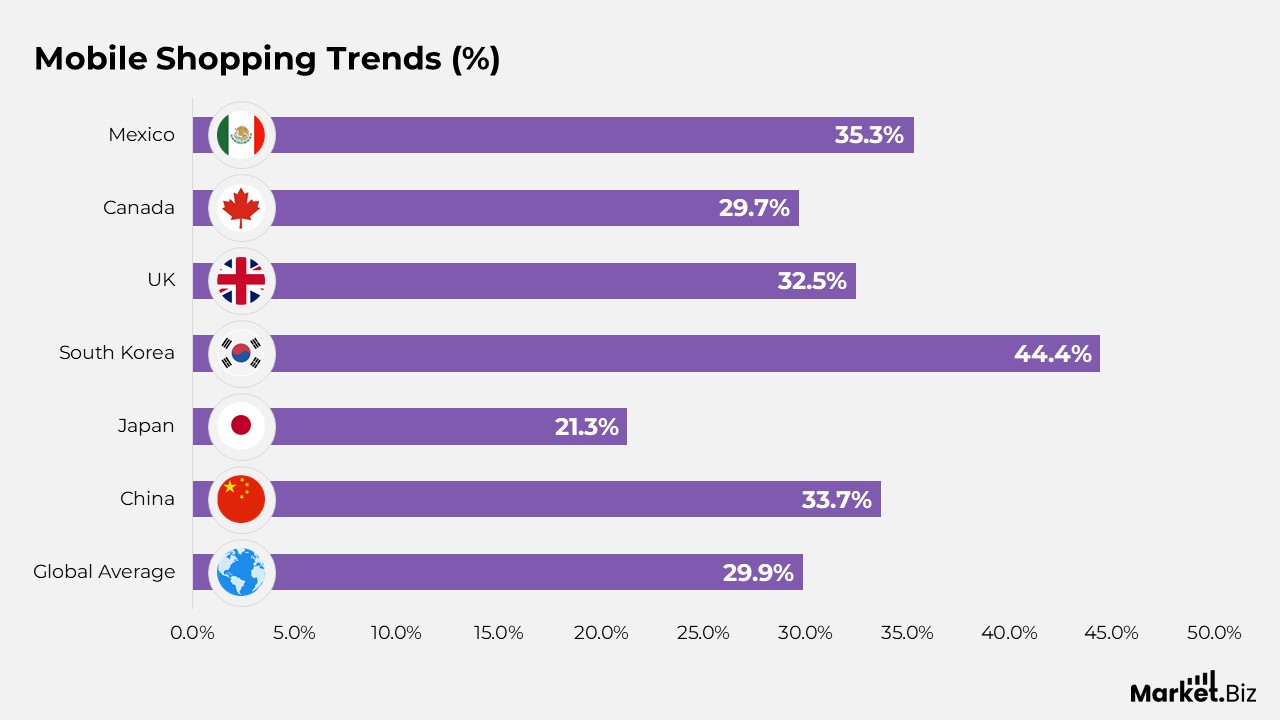
- 29.9% of online shoppers worldwide make weekly purchases using their smartphones.
- 80% of global consumers browse retailer websites on their smartphones while shopping in-store, and 74% use retailer apps during the in-store shopping experience.
- In China, 33.7% of internet users make weekly mobile e-commerce purchases, which is 12.7% higher than the global average.
- 21.3% of Japanese internet users make weekly e-commerce purchases, 28.8% lower than the global average.
- In South Korea, 44.4% of internet users make weekly purchases via smartphones, 48.5% higher than the global average.
- 32.5% of UK internet users make weekly mobile e-commerce purchases, 8.7% higher than the global average.
- 29.7% of Canadian internet workers engage in weekly mobile e-commerce purchases, which is just 0.67% lower than the global average.
- Among individuals aged 30-49, an astounding 92% regularly use smartphones for online Shopping, with 49% Shopping weekly.
- 35.3% of Mexican internet users engage in weekly mobile e-commerce purchases, 18.1% higher than the global average.
(Source: Gauss, McKinsey, Semrush, Practical Ecommerce, ZDNet, TechTarget, Statista, Technology Signals, Zippia, Influencer Marketing Hub, Oberlo, Monetate)
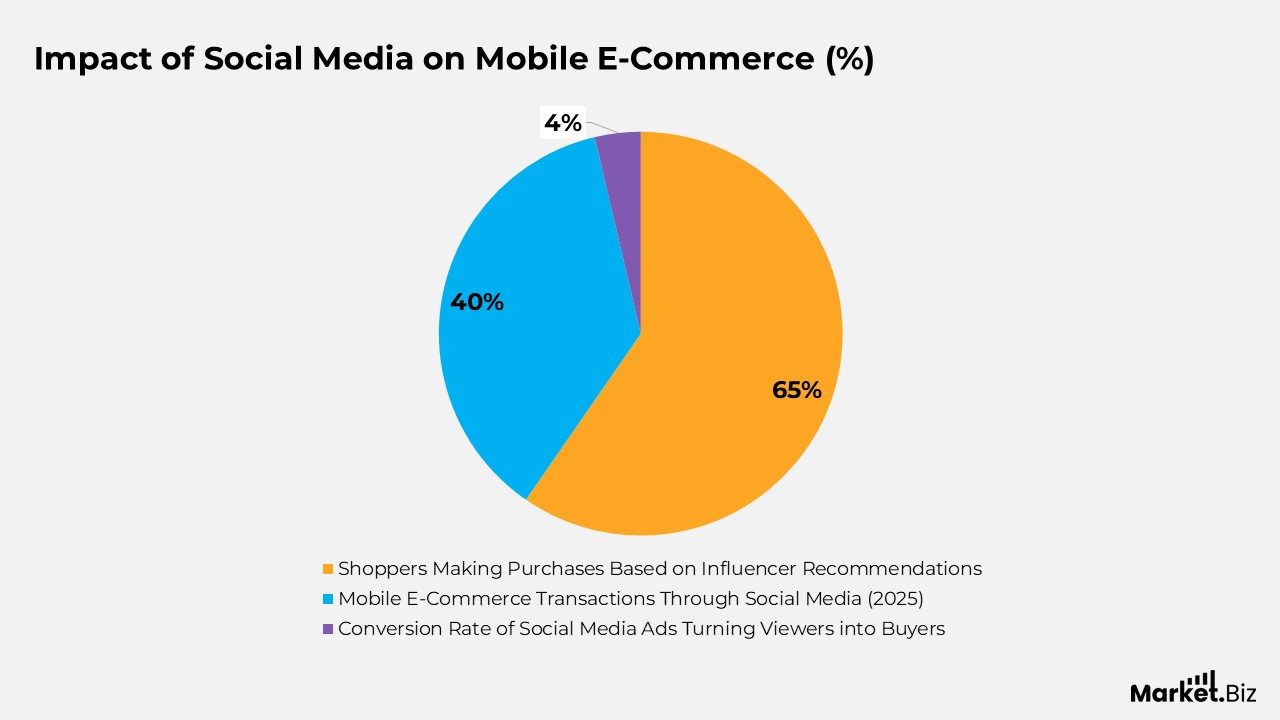
Impact of Social Media on Mobile E-Commerce
- Approximately 65% of shoppers reported making purchases based on recommendations from influencers they follow.
- In 2025, nearly 40% of all mobile e-commerce transactions occurred directly through social media platforms.
- On social media platforms, users generally spend about 30 minutes browsing products during each session.
- Social media advertisements significantly contributed to mobile e-commerce sales, with a 4% conversion rate turning viewers and app users into buyers.
(Source: Wisernotify, Statista, Apptile, Tidio, Buildfire)
Mobile Commerce Trends
- Mobile apps outperformed mobile websites in conversion rates, achieving 3.5% in 2024 compared to 2% for mobile websites.
- In the second quarter of 2022, the average order value for mobile app purchases in the UK reached $86.28, highlighting the significant buying power of mobile app users.
- In 2023, 70% of online orders in the UK were made via mobile phones, showcasing the growing reliance on mobile devices for Shopping.
- In the U.S., 72% of consumers use mobile devices to search for products while shopping in-store, reflecting the growing integration of mobile technology in both online and offline shopping behaviors.
- About 65% of mobile users purchased after receiving a recommendation from an influencer, indicating the increasing influence of social media on buying decisions.
- In 2024, global mobile commerce sales are expected to rise by 20% compared to 2023, emphasizing mobile commerce’s growing importance in retail.
- 1 in 20 fraud incidents is linked to malicious mobile apps, underlining the importance of enhancing security in mobile commerce.
- By 2024, it is expected that 55% of consumers will make purchases through social media apps like Instagram and TikTok, transforming these platforms into powerful e-commerce tools.
- In 2023, the mobile commerce conversion rate stood at 2.25%, lower than desktop’s 4.81%, but higher than mobile websites, signalling opportunities for further optimization.
- The usage of shopping apps saw a 54% increase in 2024, driven by factors like convenience, personalized experiences, and improved user interfaces.
(Source: Oyelabs, Statista, Influencer Marketing Hub)
Mobile E-Commerce Conversion Statistics
- 61% of mobile shoppers complete most of their online purchases on desktop or laptop computers.
- The average e-commerce conversion rate for mobile phones is 2.0%, which is 16.7% lower than that of desktops.
- Tablets have a 2.5% conversion rate, 4.17% higher than desktops.
- Only 16% of e-commerce conversions occur from mobile device shoppers.
- 83.6% of mobile shoppers abandon their carts, which is 16.1% higher than desktop abandonment rates.
- The add-to-cart rate for smartphone e-commerce stands at 12.6%, 43.2% higher than desktops.
- Tablet e-commerce add-to-cart rates are 10.6%, 20.5% higher than desktop rates.
- Smartphone users average 5.6 pages per visit on e-commerce sites, which is 12.0% more than desktop users.
- Only 2.21% of e-commerce site traffic comes from tablet users.
- 65.3% of e-commerce site traffic originates from mobile phone users.
- Tablet users browse an average of 6.3 pages on e-commerce sites, which is 26.0% more than desktop users.
- Tablet users abandon carts at a rate of 76.3%, 5.97% higher than desktop users.
(Source: Capital One Shopping, U.S. Census Bureau, Pew Research Center, Statista, National Retail Federation)
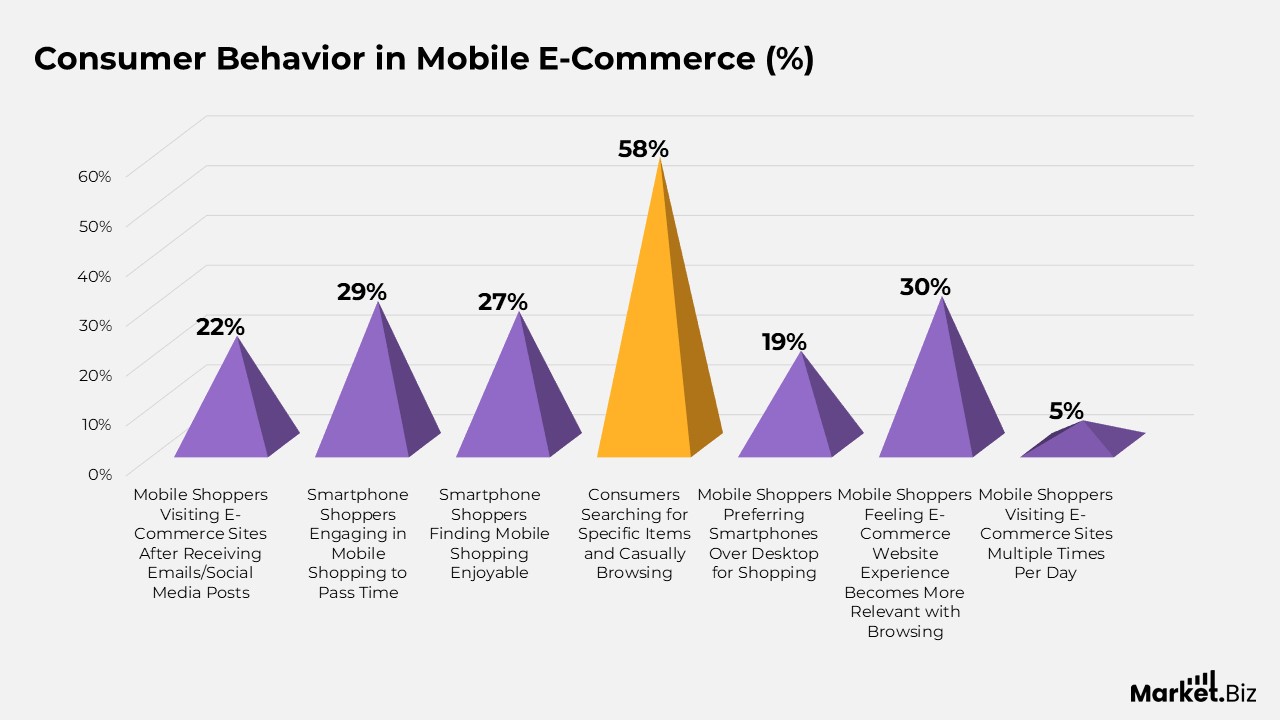
Consumer Behavior in Mobile E-Commerce
- 22% of mobile shoppers visit e-commerce sites after receiving an email or seeing a social media post from the brand.
- 29% of smartphone shoppers engage in mobile Shopping as a way to pass the time, while 27% find the activity enjoyable.
- 58% of consumers on mobile devices are both searching for specific items and casually browsing during their shopping experience.
- 19% of mobile shoppers prefer using their smartphones for shopping rather than a desktop computer.
- Only 30% of mobile shoppers feel that the e-commerce website’s experience becomes more relevant as they continue browsing.
- 5% of mobile shoppers visit e-commerce sites multiple times per day.
- 22% of mobile shoppers are simply browsing, while 20% are actively searching for a specific item to purchase immediately.
(Source: Capital One Shopping, Pew Research Center, Morning Consult, Smart Cart, U.S. Census Bureau, Statista, National Retail Federation)
Conclusion
Mobile commerce is steadily transforming the retail sector, influencing consumer shopping habits and driving the expansion of e-commerce. As more consumers turn to mobile apps for their shopping needs and embrace mobile wallets, the convenience and effectiveness of m-commerce are becoming increasingly clear.
With mobile devices playing an ever-growing role in daily life, the future of Shopping is set to be predominantly mobile-based. Companies are adapting to this shift by integrating innovative technologies such as one-click payments and social commerce to enhance the shopping experience.
As mobile commerce continues to evolve, it is poised to remain a vital force in the digital economy, offering both opportunities and challenges for businesses striving to remain competitive.
FAQ’s
Mobile commerce (m-commerce) involves the selling and buying of services and goods through mobile devices such as smartphones and tablets. It encompasses activities like Shopping, mobile banking, and transactions through mobile wallets.
Approximately 30% of the global digital population shops via mobile phones, which equals about 1.65 billion mobile shoppers.
In the United States, roughly 76% of adults use their smartphones to make purchases.
Globally, consumers spend over 41.9 billion hours on shopping apps, demonstrating the growing dependence on mobile Shopping.
By 2025, mobile commerce is projected to account for 75% of all e-commerce sales, reflecting its dominant role in the digital shopping world.
Global mobile commerce revenue is forecasted to reach $6.5 trillion by 2025, underscoring the rapid growth of mobile-based Shopping.
Yes, 73% of online shoppers favor using mobile apps over websites, as apps offer a more seamless and intuitive shopping experience.
Mobile wallets, such as Apple Pay and Google Pay, account for 60% of digital transactions globally, providing consumers with a secure and convenient payment method via mobile devices.
82% of smartphone users have purchased their mobile device in the past six months, indicating regular engagement with mobile commerce.